Free Statistics

of Irreproducible Research!

Author's title

Author*Unverified author*
R Software Modulerwasp_autocorrelation.wasp
Title produced by software(Partial) Autocorrelation Function
Date of computationSat, 18 Oct 2014 10:07:02 +0100
Cite this page as followsStatistical Computations at FreeStatistics.org, Office for Research Development and Education, URL https://freestatistics.org/blog/index.php?v=date/2014/Oct/18/t14136232740fhq59jkfk6rtlo.htm/, Retrieved Mon, 13 May 2024 06:53:26 +0000
Statistical Computations at FreeStatistics.org, Office for Research Development and Education, URL https://freestatistics.org/blog/index.php?pk=243417, Retrieved Mon, 13 May 2024 06:53:26 +0000
QR Codes:

Original text written by user:
IsPrivate?No (this computation is public)
User-defined keywords
Estimated Impact108
Family? (F = Feedback message, R = changed R code, M = changed R Module, P = changed Parameters, D = changed Data)
-       [(Partial) Autocorrelation Function] [] [2014-10-18 09:07:02] [9c8c71143ae36c30e98dcd90d9bfe9d4] [Current]
Feedback Forum

Post a new message
Dataseries X:
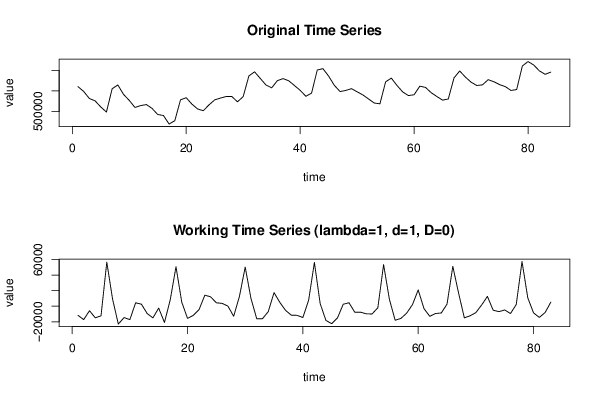
560576
548854
531673
525919
511038
498662
555362
564591
541657
527070
509846
514258
516922
507561
492622
490243
469357
477580
528379
533590
517945
506174
501866
516141
528222
532638
536322
536535
523597
536214
586570
596594
580523
564478
557560
575093
580112
574761
563250
551531
537034
544686
600991
604378
586111
563668
548604
551174
555654
547970
540324
530577
520579
518654
572273
581302
563280
547612
538712
540735
561649
558685
545732
536352
527676
530455
581744
598714
583775
571477
563278
564872
577537
572399
565430
560619
551227
553397
610893
621668
613148
598778
590623
595902


Summary of computational transaction
Raw Inputview raw input (R code)
Raw Outputview raw output of R engine
Computing time1 seconds
R Server'Sir Maurice George Kendall' @ kendall.wessa.net

\begin{tabular}{lllllllll}
\hline
Summary of computational transaction \tabularnewline
Raw Input & view raw input (R code)  \tabularnewline
Raw Output & view raw output of R engine  \tabularnewline
Computing time & 1 seconds \tabularnewline
R Server & 'Sir Maurice George Kendall' @ kendall.wessa.net \tabularnewline
\hline
\end{tabular}
%Source: https://freestatistics.org/blog/index.php?pk=243417&T=0

[TABLE]
[ROW][C]Summary of computational transaction[/C][/ROW]
[ROW][C]Raw Input[/C][C]view raw input (R code) [/C][/ROW]
[ROW][C]Raw Output[/C][C]view raw output of R engine [/C][/ROW]
[ROW][C]Computing time[/C][C]1 seconds[/C][/ROW]
[ROW][C]R Server[/C][C]'Sir Maurice George Kendall' @ kendall.wessa.net[/C][/ROW]
[/TABLE]
Source: https://freestatistics.org/blog/index.php?pk=243417&T=0

Globally Unique Identifier (entire table): ba.freestatistics.org/blog/index.php?pk=243417&T=0

As an alternative you can also use a QR Code:  

The GUIDs for individual cells are displayed in the table below:

Summary of computational transaction
Raw Inputview raw input (R code)
Raw Outputview raw output of R engine
Computing time1 seconds
R Server'Sir Maurice George Kendall' @ kendall.wessa.net


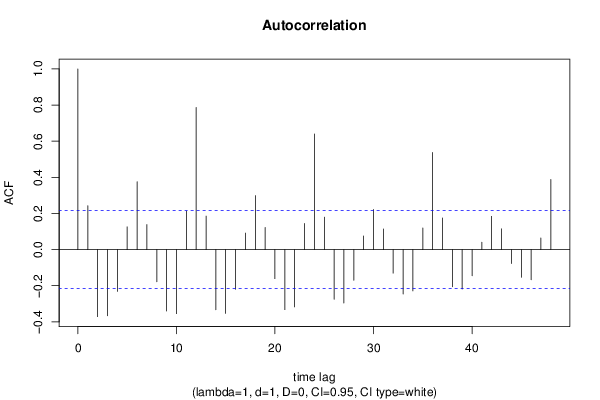
Autocorrelation Function
Time lag kACF(k)T-STATP-value
10.242452.20880.014972
2-0.371132-3.38120.000551
3-0.366643-3.34030.000628
4-0.231079-2.10520.019147
50.1259731.14770.127202
60.3759043.42460.00048
70.1383631.26050.105503
8-0.178372-1.6250.053972
9-0.339792-3.09570.001339
10-0.354515-3.22980.000888
110.2129971.94050.027857
120.7869667.16960
130.1854721.68970.047417
14-0.333147-3.03510.001605
15-0.353249-3.21820.00092
16-0.219726-2.00180.024286
170.0912640.83150.204051
180.2987212.72150.003959
190.1224681.11570.133876
20-0.160725-1.46430.073448
21-0.332131-3.02590.00165
22-0.316998-2.8880.002472
230.1449441.32050.095149
240.6403865.83420
250.1796381.63660.052753
26-0.275069-2.5060.007082
27-0.29555-2.69260.004288
28-0.170002-1.54880.062618
290.0754390.68730.246909
300.2217832.02050.023276
310.1144131.04240.150137
32-0.130407-1.18810.119099
33-0.245443-2.23610.014015
34-0.228454-2.08130.020244
350.1192771.08670.140166
360.5374464.89642e-06
370.1750991.59520.057231
38-0.205367-1.8710.032435
39-0.218068-1.98670.025128
40-0.144506-1.31650.095813
410.0403750.36780.356968
420.1839841.67620.048733
430.1148731.04650.149173
44-0.077295-0.70420.241644
45-0.153472-1.39820.082889
46-0.167358-1.52470.065568
470.0639240.58240.280945
480.3880913.53570.000334

\begin{tabular}{lllllllll}
\hline
Autocorrelation Function \tabularnewline
Time lag k & ACF(k) & T-STAT & P-value \tabularnewline
1 & 0.24245 & 2.2088 & 0.014972 \tabularnewline
2 & -0.371132 & -3.3812 & 0.000551 \tabularnewline
3 & -0.366643 & -3.3403 & 0.000628 \tabularnewline
4 & -0.231079 & -2.1052 & 0.019147 \tabularnewline
5 & 0.125973 & 1.1477 & 0.127202 \tabularnewline
6 & 0.375904 & 3.4246 & 0.00048 \tabularnewline
7 & 0.138363 & 1.2605 & 0.105503 \tabularnewline
8 & -0.178372 & -1.625 & 0.053972 \tabularnewline
9 & -0.339792 & -3.0957 & 0.001339 \tabularnewline
10 & -0.354515 & -3.2298 & 0.000888 \tabularnewline
11 & 0.212997 & 1.9405 & 0.027857 \tabularnewline
12 & 0.786966 & 7.1696 & 0 \tabularnewline
13 & 0.185472 & 1.6897 & 0.047417 \tabularnewline
14 & -0.333147 & -3.0351 & 0.001605 \tabularnewline
15 & -0.353249 & -3.2182 & 0.00092 \tabularnewline
16 & -0.219726 & -2.0018 & 0.024286 \tabularnewline
17 & 0.091264 & 0.8315 & 0.204051 \tabularnewline
18 & 0.298721 & 2.7215 & 0.003959 \tabularnewline
19 & 0.122468 & 1.1157 & 0.133876 \tabularnewline
20 & -0.160725 & -1.4643 & 0.073448 \tabularnewline
21 & -0.332131 & -3.0259 & 0.00165 \tabularnewline
22 & -0.316998 & -2.888 & 0.002472 \tabularnewline
23 & 0.144944 & 1.3205 & 0.095149 \tabularnewline
24 & 0.640386 & 5.8342 & 0 \tabularnewline
25 & 0.179638 & 1.6366 & 0.052753 \tabularnewline
26 & -0.275069 & -2.506 & 0.007082 \tabularnewline
27 & -0.29555 & -2.6926 & 0.004288 \tabularnewline
28 & -0.170002 & -1.5488 & 0.062618 \tabularnewline
29 & 0.075439 & 0.6873 & 0.246909 \tabularnewline
30 & 0.221783 & 2.0205 & 0.023276 \tabularnewline
31 & 0.114413 & 1.0424 & 0.150137 \tabularnewline
32 & -0.130407 & -1.1881 & 0.119099 \tabularnewline
33 & -0.245443 & -2.2361 & 0.014015 \tabularnewline
34 & -0.228454 & -2.0813 & 0.020244 \tabularnewline
35 & 0.119277 & 1.0867 & 0.140166 \tabularnewline
36 & 0.537446 & 4.8964 & 2e-06 \tabularnewline
37 & 0.175099 & 1.5952 & 0.057231 \tabularnewline
38 & -0.205367 & -1.871 & 0.032435 \tabularnewline
39 & -0.218068 & -1.9867 & 0.025128 \tabularnewline
40 & -0.144506 & -1.3165 & 0.095813 \tabularnewline
41 & 0.040375 & 0.3678 & 0.356968 \tabularnewline
42 & 0.183984 & 1.6762 & 0.048733 \tabularnewline
43 & 0.114873 & 1.0465 & 0.149173 \tabularnewline
44 & -0.077295 & -0.7042 & 0.241644 \tabularnewline
45 & -0.153472 & -1.3982 & 0.082889 \tabularnewline
46 & -0.167358 & -1.5247 & 0.065568 \tabularnewline
47 & 0.063924 & 0.5824 & 0.280945 \tabularnewline
48 & 0.388091 & 3.5357 & 0.000334 \tabularnewline
\hline
\end{tabular}
%Source: https://freestatistics.org/blog/index.php?pk=243417&T=1

[TABLE]
[ROW][C]Autocorrelation Function[/C][/ROW]
[ROW][C]Time lag k[/C][C]ACF(k)[/C][C]T-STAT[/C][C]P-value[/C][/ROW]
[ROW][C]1[/C][C]0.24245[/C][C]2.2088[/C][C]0.014972[/C][/ROW]
[ROW][C]2[/C][C]-0.371132[/C][C]-3.3812[/C][C]0.000551[/C][/ROW]
[ROW][C]3[/C][C]-0.366643[/C][C]-3.3403[/C][C]0.000628[/C][/ROW]
[ROW][C]4[/C][C]-0.231079[/C][C]-2.1052[/C][C]0.019147[/C][/ROW]
[ROW][C]5[/C][C]0.125973[/C][C]1.1477[/C][C]0.127202[/C][/ROW]
[ROW][C]6[/C][C]0.375904[/C][C]3.4246[/C][C]0.00048[/C][/ROW]
[ROW][C]7[/C][C]0.138363[/C][C]1.2605[/C][C]0.105503[/C][/ROW]
[ROW][C]8[/C][C]-0.178372[/C][C]-1.625[/C][C]0.053972[/C][/ROW]
[ROW][C]9[/C][C]-0.339792[/C][C]-3.0957[/C][C]0.001339[/C][/ROW]
[ROW][C]10[/C][C]-0.354515[/C][C]-3.2298[/C][C]0.000888[/C][/ROW]
[ROW][C]11[/C][C]0.212997[/C][C]1.9405[/C][C]0.027857[/C][/ROW]
[ROW][C]12[/C][C]0.786966[/C][C]7.1696[/C][C]0[/C][/ROW]
[ROW][C]13[/C][C]0.185472[/C][C]1.6897[/C][C]0.047417[/C][/ROW]
[ROW][C]14[/C][C]-0.333147[/C][C]-3.0351[/C][C]0.001605[/C][/ROW]
[ROW][C]15[/C][C]-0.353249[/C][C]-3.2182[/C][C]0.00092[/C][/ROW]
[ROW][C]16[/C][C]-0.219726[/C][C]-2.0018[/C][C]0.024286[/C][/ROW]
[ROW][C]17[/C][C]0.091264[/C][C]0.8315[/C][C]0.204051[/C][/ROW]
[ROW][C]18[/C][C]0.298721[/C][C]2.7215[/C][C]0.003959[/C][/ROW]
[ROW][C]19[/C][C]0.122468[/C][C]1.1157[/C][C]0.133876[/C][/ROW]
[ROW][C]20[/C][C]-0.160725[/C][C]-1.4643[/C][C]0.073448[/C][/ROW]
[ROW][C]21[/C][C]-0.332131[/C][C]-3.0259[/C][C]0.00165[/C][/ROW]
[ROW][C]22[/C][C]-0.316998[/C][C]-2.888[/C][C]0.002472[/C][/ROW]
[ROW][C]23[/C][C]0.144944[/C][C]1.3205[/C][C]0.095149[/C][/ROW]
[ROW][C]24[/C][C]0.640386[/C][C]5.8342[/C][C]0[/C][/ROW]
[ROW][C]25[/C][C]0.179638[/C][C]1.6366[/C][C]0.052753[/C][/ROW]
[ROW][C]26[/C][C]-0.275069[/C][C]-2.506[/C][C]0.007082[/C][/ROW]
[ROW][C]27[/C][C]-0.29555[/C][C]-2.6926[/C][C]0.004288[/C][/ROW]
[ROW][C]28[/C][C]-0.170002[/C][C]-1.5488[/C][C]0.062618[/C][/ROW]
[ROW][C]29[/C][C]0.075439[/C][C]0.6873[/C][C]0.246909[/C][/ROW]
[ROW][C]30[/C][C]0.221783[/C][C]2.0205[/C][C]0.023276[/C][/ROW]
[ROW][C]31[/C][C]0.114413[/C][C]1.0424[/C][C]0.150137[/C][/ROW]
[ROW][C]32[/C][C]-0.130407[/C][C]-1.1881[/C][C]0.119099[/C][/ROW]
[ROW][C]33[/C][C]-0.245443[/C][C]-2.2361[/C][C]0.014015[/C][/ROW]
[ROW][C]34[/C][C]-0.228454[/C][C]-2.0813[/C][C]0.020244[/C][/ROW]
[ROW][C]35[/C][C]0.119277[/C][C]1.0867[/C][C]0.140166[/C][/ROW]
[ROW][C]36[/C][C]0.537446[/C][C]4.8964[/C][C]2e-06[/C][/ROW]
[ROW][C]37[/C][C]0.175099[/C][C]1.5952[/C][C]0.057231[/C][/ROW]
[ROW][C]38[/C][C]-0.205367[/C][C]-1.871[/C][C]0.032435[/C][/ROW]
[ROW][C]39[/C][C]-0.218068[/C][C]-1.9867[/C][C]0.025128[/C][/ROW]
[ROW][C]40[/C][C]-0.144506[/C][C]-1.3165[/C][C]0.095813[/C][/ROW]
[ROW][C]41[/C][C]0.040375[/C][C]0.3678[/C][C]0.356968[/C][/ROW]
[ROW][C]42[/C][C]0.183984[/C][C]1.6762[/C][C]0.048733[/C][/ROW]
[ROW][C]43[/C][C]0.114873[/C][C]1.0465[/C][C]0.149173[/C][/ROW]
[ROW][C]44[/C][C]-0.077295[/C][C]-0.7042[/C][C]0.241644[/C][/ROW]
[ROW][C]45[/C][C]-0.153472[/C][C]-1.3982[/C][C]0.082889[/C][/ROW]
[ROW][C]46[/C][C]-0.167358[/C][C]-1.5247[/C][C]0.065568[/C][/ROW]
[ROW][C]47[/C][C]0.063924[/C][C]0.5824[/C][C]0.280945[/C][/ROW]
[ROW][C]48[/C][C]0.388091[/C][C]3.5357[/C][C]0.000334[/C][/ROW]
[/TABLE]
Source: https://freestatistics.org/blog/index.php?pk=243417&T=1

Globally Unique Identifier (entire table): ba.freestatistics.org/blog/index.php?pk=243417&T=1

As an alternative you can also use a QR Code:  

The GUIDs for individual cells are displayed in the table below:

Autocorrelation Function
Time lag kACF(k)T-STATP-value
10.242452.20880.014972
2-0.371132-3.38120.000551
3-0.366643-3.34030.000628
4-0.231079-2.10520.019147
50.1259731.14770.127202
60.3759043.42460.00048
70.1383631.26050.105503
8-0.178372-1.6250.053972
9-0.339792-3.09570.001339
10-0.354515-3.22980.000888
110.2129971.94050.027857
120.7869667.16960
130.1854721.68970.047417
14-0.333147-3.03510.001605
15-0.353249-3.21820.00092
16-0.219726-2.00180.024286
170.0912640.83150.204051
180.2987212.72150.003959
190.1224681.11570.133876
20-0.160725-1.46430.073448
21-0.332131-3.02590.00165
22-0.316998-2.8880.002472
230.1449441.32050.095149
240.6403865.83420
250.1796381.63660.052753
26-0.275069-2.5060.007082
27-0.29555-2.69260.004288
28-0.170002-1.54880.062618
290.0754390.68730.246909
300.2217832.02050.023276
310.1144131.04240.150137
32-0.130407-1.18810.119099
33-0.245443-2.23610.014015
34-0.228454-2.08130.020244
350.1192771.08670.140166
360.5374464.89642e-06
370.1750991.59520.057231
38-0.205367-1.8710.032435
39-0.218068-1.98670.025128
40-0.144506-1.31650.095813
410.0403750.36780.356968
420.1839841.67620.048733
430.1148731.04650.149173
44-0.077295-0.70420.241644
45-0.153472-1.39820.082889
46-0.167358-1.52470.065568
470.0639240.58240.280945
480.3880913.53570.000334


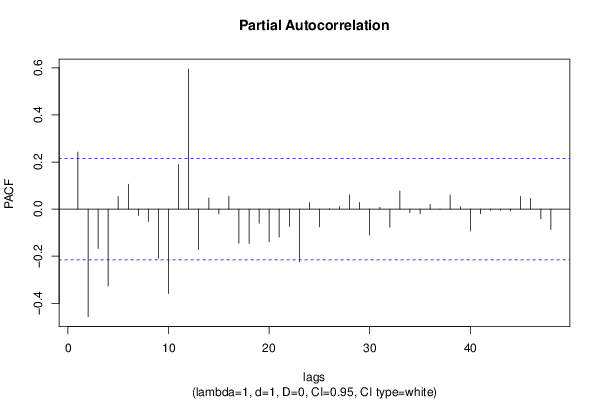
Partial Autocorrelation Function
Time lag kPACF(k)T-STATP-value
10.242452.20880.014972
2-0.456763-4.16133.8e-05
3-0.167578-1.52670.065317
4-0.326786-2.97720.001906
50.0532460.48510.314445
60.105840.96420.168862
7-0.027175-0.24760.402537
8-0.052938-0.48230.315436
9-0.208816-1.90240.030293
10-0.358193-3.26338e-04
110.1882071.71460.045071
120.595485.42510
13-0.171757-1.56480.06072
140.0472590.43060.333955
15-0.020333-0.18520.426746
160.054450.49610.310581
17-0.145316-1.32390.094587
18-0.145717-1.32750.093984
19-0.059845-0.54520.293533
20-0.139299-1.26910.103981
21-0.118681-1.08120.141362
22-0.073223-0.66710.253282
23-0.223792-2.03880.022324
240.0282770.25760.398671
25-0.075245-0.68550.247466
26-0.000658-0.0060.497615
270.0110810.1010.459915
280.0607840.55380.290614
290.0284290.2590.398137
30-0.110549-1.00720.158395
310.0075580.06890.472633
32-0.077327-0.70450.241553
330.0770.70150.242476
34-0.014918-0.13590.446109
35-0.019825-0.18060.428557
360.0197810.18020.428713
37-1.2e-05-1e-040.499957
380.0600050.54670.293034
390.0100220.09130.463734
40-0.092866-0.8460.199979
41-0.019499-0.17760.429718
42-0.004733-0.04310.482856
43-0.004225-0.03850.484693
44-0.007422-0.06760.473125
450.0536810.48910.313046
460.0452040.41180.340763
47-0.041246-0.37580.354024
48-0.086945-0.79210.215279

\begin{tabular}{lllllllll}
\hline
Partial Autocorrelation Function \tabularnewline
Time lag k & PACF(k) & T-STAT & P-value \tabularnewline
1 & 0.24245 & 2.2088 & 0.014972 \tabularnewline
2 & -0.456763 & -4.1613 & 3.8e-05 \tabularnewline
3 & -0.167578 & -1.5267 & 0.065317 \tabularnewline
4 & -0.326786 & -2.9772 & 0.001906 \tabularnewline
5 & 0.053246 & 0.4851 & 0.314445 \tabularnewline
6 & 0.10584 & 0.9642 & 0.168862 \tabularnewline
7 & -0.027175 & -0.2476 & 0.402537 \tabularnewline
8 & -0.052938 & -0.4823 & 0.315436 \tabularnewline
9 & -0.208816 & -1.9024 & 0.030293 \tabularnewline
10 & -0.358193 & -3.2633 & 8e-04 \tabularnewline
11 & 0.188207 & 1.7146 & 0.045071 \tabularnewline
12 & 0.59548 & 5.4251 & 0 \tabularnewline
13 & -0.171757 & -1.5648 & 0.06072 \tabularnewline
14 & 0.047259 & 0.4306 & 0.333955 \tabularnewline
15 & -0.020333 & -0.1852 & 0.426746 \tabularnewline
16 & 0.05445 & 0.4961 & 0.310581 \tabularnewline
17 & -0.145316 & -1.3239 & 0.094587 \tabularnewline
18 & -0.145717 & -1.3275 & 0.093984 \tabularnewline
19 & -0.059845 & -0.5452 & 0.293533 \tabularnewline
20 & -0.139299 & -1.2691 & 0.103981 \tabularnewline
21 & -0.118681 & -1.0812 & 0.141362 \tabularnewline
22 & -0.073223 & -0.6671 & 0.253282 \tabularnewline
23 & -0.223792 & -2.0388 & 0.022324 \tabularnewline
24 & 0.028277 & 0.2576 & 0.398671 \tabularnewline
25 & -0.075245 & -0.6855 & 0.247466 \tabularnewline
26 & -0.000658 & -0.006 & 0.497615 \tabularnewline
27 & 0.011081 & 0.101 & 0.459915 \tabularnewline
28 & 0.060784 & 0.5538 & 0.290614 \tabularnewline
29 & 0.028429 & 0.259 & 0.398137 \tabularnewline
30 & -0.110549 & -1.0072 & 0.158395 \tabularnewline
31 & 0.007558 & 0.0689 & 0.472633 \tabularnewline
32 & -0.077327 & -0.7045 & 0.241553 \tabularnewline
33 & 0.077 & 0.7015 & 0.242476 \tabularnewline
34 & -0.014918 & -0.1359 & 0.446109 \tabularnewline
35 & -0.019825 & -0.1806 & 0.428557 \tabularnewline
36 & 0.019781 & 0.1802 & 0.428713 \tabularnewline
37 & -1.2e-05 & -1e-04 & 0.499957 \tabularnewline
38 & 0.060005 & 0.5467 & 0.293034 \tabularnewline
39 & 0.010022 & 0.0913 & 0.463734 \tabularnewline
40 & -0.092866 & -0.846 & 0.199979 \tabularnewline
41 & -0.019499 & -0.1776 & 0.429718 \tabularnewline
42 & -0.004733 & -0.0431 & 0.482856 \tabularnewline
43 & -0.004225 & -0.0385 & 0.484693 \tabularnewline
44 & -0.007422 & -0.0676 & 0.473125 \tabularnewline
45 & 0.053681 & 0.4891 & 0.313046 \tabularnewline
46 & 0.045204 & 0.4118 & 0.340763 \tabularnewline
47 & -0.041246 & -0.3758 & 0.354024 \tabularnewline
48 & -0.086945 & -0.7921 & 0.215279 \tabularnewline
\hline
\end{tabular}
%Source: https://freestatistics.org/blog/index.php?pk=243417&T=2

[TABLE]
[ROW][C]Partial Autocorrelation Function[/C][/ROW]
[ROW][C]Time lag k[/C][C]PACF(k)[/C][C]T-STAT[/C][C]P-value[/C][/ROW]
[ROW][C]1[/C][C]0.24245[/C][C]2.2088[/C][C]0.014972[/C][/ROW]
[ROW][C]2[/C][C]-0.456763[/C][C]-4.1613[/C][C]3.8e-05[/C][/ROW]
[ROW][C]3[/C][C]-0.167578[/C][C]-1.5267[/C][C]0.065317[/C][/ROW]
[ROW][C]4[/C][C]-0.326786[/C][C]-2.9772[/C][C]0.001906[/C][/ROW]
[ROW][C]5[/C][C]0.053246[/C][C]0.4851[/C][C]0.314445[/C][/ROW]
[ROW][C]6[/C][C]0.10584[/C][C]0.9642[/C][C]0.168862[/C][/ROW]
[ROW][C]7[/C][C]-0.027175[/C][C]-0.2476[/C][C]0.402537[/C][/ROW]
[ROW][C]8[/C][C]-0.052938[/C][C]-0.4823[/C][C]0.315436[/C][/ROW]
[ROW][C]9[/C][C]-0.208816[/C][C]-1.9024[/C][C]0.030293[/C][/ROW]
[ROW][C]10[/C][C]-0.358193[/C][C]-3.2633[/C][C]8e-04[/C][/ROW]
[ROW][C]11[/C][C]0.188207[/C][C]1.7146[/C][C]0.045071[/C][/ROW]
[ROW][C]12[/C][C]0.59548[/C][C]5.4251[/C][C]0[/C][/ROW]
[ROW][C]13[/C][C]-0.171757[/C][C]-1.5648[/C][C]0.06072[/C][/ROW]
[ROW][C]14[/C][C]0.047259[/C][C]0.4306[/C][C]0.333955[/C][/ROW]
[ROW][C]15[/C][C]-0.020333[/C][C]-0.1852[/C][C]0.426746[/C][/ROW]
[ROW][C]16[/C][C]0.05445[/C][C]0.4961[/C][C]0.310581[/C][/ROW]
[ROW][C]17[/C][C]-0.145316[/C][C]-1.3239[/C][C]0.094587[/C][/ROW]
[ROW][C]18[/C][C]-0.145717[/C][C]-1.3275[/C][C]0.093984[/C][/ROW]
[ROW][C]19[/C][C]-0.059845[/C][C]-0.5452[/C][C]0.293533[/C][/ROW]
[ROW][C]20[/C][C]-0.139299[/C][C]-1.2691[/C][C]0.103981[/C][/ROW]
[ROW][C]21[/C][C]-0.118681[/C][C]-1.0812[/C][C]0.141362[/C][/ROW]
[ROW][C]22[/C][C]-0.073223[/C][C]-0.6671[/C][C]0.253282[/C][/ROW]
[ROW][C]23[/C][C]-0.223792[/C][C]-2.0388[/C][C]0.022324[/C][/ROW]
[ROW][C]24[/C][C]0.028277[/C][C]0.2576[/C][C]0.398671[/C][/ROW]
[ROW][C]25[/C][C]-0.075245[/C][C]-0.6855[/C][C]0.247466[/C][/ROW]
[ROW][C]26[/C][C]-0.000658[/C][C]-0.006[/C][C]0.497615[/C][/ROW]
[ROW][C]27[/C][C]0.011081[/C][C]0.101[/C][C]0.459915[/C][/ROW]
[ROW][C]28[/C][C]0.060784[/C][C]0.5538[/C][C]0.290614[/C][/ROW]
[ROW][C]29[/C][C]0.028429[/C][C]0.259[/C][C]0.398137[/C][/ROW]
[ROW][C]30[/C][C]-0.110549[/C][C]-1.0072[/C][C]0.158395[/C][/ROW]
[ROW][C]31[/C][C]0.007558[/C][C]0.0689[/C][C]0.472633[/C][/ROW]
[ROW][C]32[/C][C]-0.077327[/C][C]-0.7045[/C][C]0.241553[/C][/ROW]
[ROW][C]33[/C][C]0.077[/C][C]0.7015[/C][C]0.242476[/C][/ROW]
[ROW][C]34[/C][C]-0.014918[/C][C]-0.1359[/C][C]0.446109[/C][/ROW]
[ROW][C]35[/C][C]-0.019825[/C][C]-0.1806[/C][C]0.428557[/C][/ROW]
[ROW][C]36[/C][C]0.019781[/C][C]0.1802[/C][C]0.428713[/C][/ROW]
[ROW][C]37[/C][C]-1.2e-05[/C][C]-1e-04[/C][C]0.499957[/C][/ROW]
[ROW][C]38[/C][C]0.060005[/C][C]0.5467[/C][C]0.293034[/C][/ROW]
[ROW][C]39[/C][C]0.010022[/C][C]0.0913[/C][C]0.463734[/C][/ROW]
[ROW][C]40[/C][C]-0.092866[/C][C]-0.846[/C][C]0.199979[/C][/ROW]
[ROW][C]41[/C][C]-0.019499[/C][C]-0.1776[/C][C]0.429718[/C][/ROW]
[ROW][C]42[/C][C]-0.004733[/C][C]-0.0431[/C][C]0.482856[/C][/ROW]
[ROW][C]43[/C][C]-0.004225[/C][C]-0.0385[/C][C]0.484693[/C][/ROW]
[ROW][C]44[/C][C]-0.007422[/C][C]-0.0676[/C][C]0.473125[/C][/ROW]
[ROW][C]45[/C][C]0.053681[/C][C]0.4891[/C][C]0.313046[/C][/ROW]
[ROW][C]46[/C][C]0.045204[/C][C]0.4118[/C][C]0.340763[/C][/ROW]
[ROW][C]47[/C][C]-0.041246[/C][C]-0.3758[/C][C]0.354024[/C][/ROW]
[ROW][C]48[/C][C]-0.086945[/C][C]-0.7921[/C][C]0.215279[/C][/ROW]
[/TABLE]
Source: https://freestatistics.org/blog/index.php?pk=243417&T=2

Globally Unique Identifier (entire table): ba.freestatistics.org/blog/index.php?pk=243417&T=2

As an alternative you can also use a QR Code:  

The GUIDs for individual cells are displayed in the table below:

Partial Autocorrelation Function
Time lag kPACF(k)T-STATP-value
10.242452.20880.014972
2-0.456763-4.16133.8e-05
3-0.167578-1.52670.065317
4-0.326786-2.97720.001906
50.0532460.48510.314445
60.105840.96420.168862
7-0.027175-0.24760.402537
8-0.052938-0.48230.315436
9-0.208816-1.90240.030293
10-0.358193-3.26338e-04
110.1882071.71460.045071
120.595485.42510
13-0.171757-1.56480.06072
140.0472590.43060.333955
15-0.020333-0.18520.426746
160.054450.49610.310581
17-0.145316-1.32390.094587
18-0.145717-1.32750.093984
19-0.059845-0.54520.293533
20-0.139299-1.26910.103981
21-0.118681-1.08120.141362
22-0.073223-0.66710.253282
23-0.223792-2.03880.022324
240.0282770.25760.398671
25-0.075245-0.68550.247466
26-0.000658-0.0060.497615
270.0110810.1010.459915
280.0607840.55380.290614
290.0284290.2590.398137
30-0.110549-1.00720.158395
310.0075580.06890.472633
32-0.077327-0.70450.241553
330.0770.70150.242476
34-0.014918-0.13590.446109
35-0.019825-0.18060.428557
360.0197810.18020.428713
37-1.2e-05-1e-040.499957
380.0600050.54670.293034
390.0100220.09130.463734
40-0.092866-0.8460.199979
41-0.019499-0.17760.429718
42-0.004733-0.04310.482856
43-0.004225-0.03850.484693
44-0.007422-0.06760.473125
450.0536810.48910.313046
460.0452040.41180.340763
47-0.041246-0.37580.354024
48-0.086945-0.79210.215279


Parameters (Session):
par1 = 48 ; par2 = 1 ; par3 = 1 ; par4 = 0 ; par5 = 12 ; par6 = White Noise ; par7 = 0.95 ;
Parameters (R input):
par1 = 48 ; par2 = 1 ; par3 = 1 ; par4 = 0 ; par5 = 12 ; par6 = White Noise ; par7 = 0.95 ; par8 = ;
R code (references can be found in the software module):
if (par1 == 'Default') {
par1 = 10*log10(length(x))
} else {
par1 <- as.numeric(par1)
}
par2 <- as.numeric(par2)
par3 <- as.numeric(par3)
par4 <- as.numeric(par4)
par5 <- as.numeric(par5)
if (par6 == 'White Noise') par6 <- 'white' else par6 <- 'ma'
par7 <- as.numeric(par7)
if (par8 != '') par8 <- as.numeric(par8)
ox <- x
if (par8 == '') {
if (par2 == 0) {
x <- log(x)
} else {
x <- (x ^ par2 - 1) / par2
}
} else {
x <- log(x,base=par8)
}
if (par3 > 0) x <- diff(x,lag=1,difference=par3)
if (par4 > 0) x <- diff(x,lag=par5,difference=par4)
bitmap(file='picts.png')
op <- par(mfrow=c(2,1))
plot(ox,type='l',main='Original Time Series',xlab='time',ylab='value')
if (par8=='') {
mytitle <- paste('Working Time Series (lambda=',par2,', d=',par3,', D=',par4,')',sep='')
mysub <- paste('(lambda=',par2,', d=',par3,', D=',par4,', CI=', par7, ', CI type=',par6,')',sep='')
} else {
mytitle <- paste('Working Time Series (base=',par8,', d=',par3,', D=',par4,')',sep='')
mysub <- paste('(base=',par8,', d=',par3,', D=',par4,', CI=', par7, ', CI type=',par6,')',sep='')
}
plot(x,type='l', main=mytitle,xlab='time',ylab='value')
par(op)
dev.off()
bitmap(file='pic1.png')
racf <- acf(x, par1, main='Autocorrelation', xlab='time lag', ylab='ACF', ci.type=par6, ci=par7, sub=mysub)
dev.off()
bitmap(file='pic2.png')
rpacf <- pacf(x,par1,main='Partial Autocorrelation',xlab='lags',ylab='PACF',sub=mysub)
dev.off()
(myacf <- c(racf$acf))
(mypacf <- c(rpacf$acf))
lengthx <- length(x)
sqrtn <- sqrt(lengthx)
load(file='createtable')
a<-table.start()
a<-table.row.start(a)
a<-table.element(a,'Autocorrelation Function',4,TRUE)
a<-table.row.end(a)
a<-table.row.start(a)
a<-table.element(a,'Time lag k',header=TRUE)
a<-table.element(a,hyperlink('basics.htm','ACF(k)','click here for more information about the Autocorrelation Function'),header=TRUE)
a<-table.element(a,'T-STAT',header=TRUE)
a<-table.element(a,'P-value',header=TRUE)
a<-table.row.end(a)
for (i in 2:(par1+1)) {
a<-table.row.start(a)
a<-table.element(a,i-1,header=TRUE)
a<-table.element(a,round(myacf[i],6))
mytstat <- myacf[i]*sqrtn
a<-table.element(a,round(mytstat,4))
a<-table.element(a,round(1-pt(abs(mytstat),lengthx),6))
a<-table.row.end(a)
}
a<-table.end(a)
table.save(a,file='mytable.tab')
a<-table.start()
a<-table.row.start(a)
a<-table.element(a,'Partial Autocorrelation Function',4,TRUE)
a<-table.row.end(a)
a<-table.row.start(a)
a<-table.element(a,'Time lag k',header=TRUE)
a<-table.element(a,hyperlink('basics.htm','PACF(k)','click here for more information about the Partial Autocorrelation Function'),header=TRUE)
a<-table.element(a,'T-STAT',header=TRUE)
a<-table.element(a,'P-value',header=TRUE)
a<-table.row.end(a)
for (i in 1:par1) {
a<-table.row.start(a)
a<-table.element(a,i,header=TRUE)
a<-table.element(a,round(mypacf[i],6))
mytstat <- mypacf[i]*sqrtn
a<-table.element(a,round(mytstat,4))
a<-table.element(a,round(1-pt(abs(mytstat),lengthx),6))
a<-table.row.end(a)
}
a<-table.end(a)
table.save(a,file='mytable1.tab')