Free Statistics

of Irreproducible Research!

Author's title

Author*Unverified author*
R Software Modulerwasp_autocorrelation.wasp
Title produced by software(Partial) Autocorrelation Function
Date of computationSat, 18 Oct 2014 10:02:28 +0100
Cite this page as followsStatistical Computations at FreeStatistics.org, Office for Research Development and Education, URL https://freestatistics.org/blog/index.php?v=date/2014/Oct/18/t1413623017s03dvce8fz2z5rf.htm/, Retrieved Mon, 13 May 2024 18:58:31 +0000
Statistical Computations at FreeStatistics.org, Office for Research Development and Education, URL https://freestatistics.org/blog/index.php?pk=243412, Retrieved Mon, 13 May 2024 18:58:31 +0000
QR Codes:

Original text written by user:
IsPrivate?No (this computation is public)
User-defined keywords
Estimated Impact111
Family? (F = Feedback message, R = changed R code, M = changed R Module, P = changed Parameters, D = changed Data)
-       [(Partial) Autocorrelation Function] [] [2014-10-18 09:02:28] [758076884586a983948783cc30ebf05d] [Current]
Feedback Forum

Post a new message
Dataseries X:
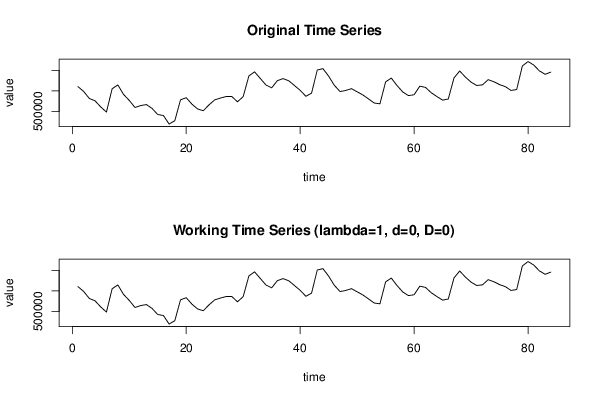
560576
548854
531673
525919
511038
498662
555362
564591
541657
527070
509846
514258
516922
507561
492622
490243
469357
477580
528379
533590
517945
506174
501866
516141
528222
532638
536322
536535
523597
536214
586570
596594
580523
564478
557560
575093
580112
574761
563250
551531
537034
544686
600991
604378
586111
563668
548604
551174
555654
547970
540324
530577
520579
518654
572273
581302
563280
547612
538712
540735
561649
558685
545732
536352
527676
530455
581744
598714
583775
571477
563278
564872
577537
572399
565430
560619
551227
553397
610893
621668
613148
598778
590623
595902


Summary of computational transaction
Raw Inputview raw input (R code)
Raw Outputview raw output of R engine
Computing time2 seconds
R Server'Herman Ole Andreas Wold' @ wold.wessa.net

\begin{tabular}{lllllllll}
\hline
Summary of computational transaction \tabularnewline
Raw Input & view raw input (R code)  \tabularnewline
Raw Output & view raw output of R engine  \tabularnewline
Computing time & 2 seconds \tabularnewline
R Server & 'Herman Ole Andreas Wold' @ wold.wessa.net \tabularnewline
\hline
\end{tabular}
%Source: https://freestatistics.org/blog/index.php?pk=243412&T=0

[TABLE]
[ROW][C]Summary of computational transaction[/C][/ROW]
[ROW][C]Raw Input[/C][C]view raw input (R code) [/C][/ROW]
[ROW][C]Raw Output[/C][C]view raw output of R engine [/C][/ROW]
[ROW][C]Computing time[/C][C]2 seconds[/C][/ROW]
[ROW][C]R Server[/C][C]'Herman Ole Andreas Wold' @ wold.wessa.net[/C][/ROW]
[/TABLE]
Source: https://freestatistics.org/blog/index.php?pk=243412&T=0

Globally Unique Identifier (entire table): ba.freestatistics.org/blog/index.php?pk=243412&T=0

As an alternative you can also use a QR Code:  

The GUIDs for individual cells are displayed in the table below:

Summary of computational transaction
Raw Inputview raw input (R code)
Raw Outputview raw output of R engine
Computing time2 seconds
R Server'Herman Ole Andreas Wold' @ wold.wessa.net


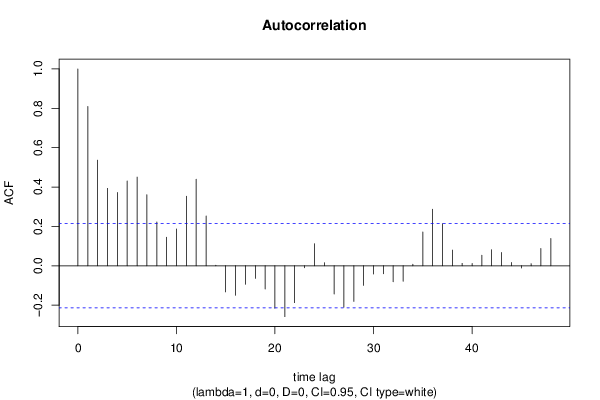
Autocorrelation Function
Time lag kACF(k)T-STATP-value
10.8093617.41790
20.5366914.91892e-06
30.393233.6040.000265
40.3725293.41430.000493
50.4305953.94658.2e-05
60.4506724.13054.3e-05
70.3611343.30980.000688
80.2225342.03960.022268
90.1449591.32860.093794
100.1870661.71450.045063
110.3531293.23650.000866
120.4399024.03186.1e-05
130.2533972.32240.011315
140.0027310.0250.490044
15-0.132601-1.21530.113826
16-0.149291-1.36830.087437
17-0.094072-0.86220.195521
18-0.063717-0.5840.280402
19-0.118217-1.08350.140849
20-0.215373-1.97390.025839
21-0.25831-2.36750.010105
22-0.187121-1.7150.045017
23-0.010108-0.09260.463205
240.1117961.02460.15424
250.0159010.14570.442241
26-0.143335-1.31370.096265
27-0.210229-1.92680.028694
28-0.180796-1.6570.050623
29-0.09942-0.91120.1824
30-0.041784-0.3830.35136
31-0.040049-0.36710.357251
32-0.080907-0.74150.230222
33-0.078657-0.72090.236485
340.0075560.06930.472476
350.1716261.5730.059741
360.2870632.6310.005064
370.2134811.95660.026859
380.0798080.73150.233268
390.0123160.11290.4552
400.0114020.10450.45851
410.0533640.48910.313026
420.0814940.74690.228602
430.0677730.62110.268092
440.0171920.15760.437588
45-0.011392-0.10440.458548
460.0109130.10.460285
470.0881010.80750.21084
480.1391511.27530.102853

\begin{tabular}{lllllllll}
\hline
Autocorrelation Function \tabularnewline
Time lag k & ACF(k) & T-STAT & P-value \tabularnewline
1 & 0.809361 & 7.4179 & 0 \tabularnewline
2 & 0.536691 & 4.9189 & 2e-06 \tabularnewline
3 & 0.39323 & 3.604 & 0.000265 \tabularnewline
4 & 0.372529 & 3.4143 & 0.000493 \tabularnewline
5 & 0.430595 & 3.9465 & 8.2e-05 \tabularnewline
6 & 0.450672 & 4.1305 & 4.3e-05 \tabularnewline
7 & 0.361134 & 3.3098 & 0.000688 \tabularnewline
8 & 0.222534 & 2.0396 & 0.022268 \tabularnewline
9 & 0.144959 & 1.3286 & 0.093794 \tabularnewline
10 & 0.187066 & 1.7145 & 0.045063 \tabularnewline
11 & 0.353129 & 3.2365 & 0.000866 \tabularnewline
12 & 0.439902 & 4.0318 & 6.1e-05 \tabularnewline
13 & 0.253397 & 2.3224 & 0.011315 \tabularnewline
14 & 0.002731 & 0.025 & 0.490044 \tabularnewline
15 & -0.132601 & -1.2153 & 0.113826 \tabularnewline
16 & -0.149291 & -1.3683 & 0.087437 \tabularnewline
17 & -0.094072 & -0.8622 & 0.195521 \tabularnewline
18 & -0.063717 & -0.584 & 0.280402 \tabularnewline
19 & -0.118217 & -1.0835 & 0.140849 \tabularnewline
20 & -0.215373 & -1.9739 & 0.025839 \tabularnewline
21 & -0.25831 & -2.3675 & 0.010105 \tabularnewline
22 & -0.187121 & -1.715 & 0.045017 \tabularnewline
23 & -0.010108 & -0.0926 & 0.463205 \tabularnewline
24 & 0.111796 & 1.0246 & 0.15424 \tabularnewline
25 & 0.015901 & 0.1457 & 0.442241 \tabularnewline
26 & -0.143335 & -1.3137 & 0.096265 \tabularnewline
27 & -0.210229 & -1.9268 & 0.028694 \tabularnewline
28 & -0.180796 & -1.657 & 0.050623 \tabularnewline
29 & -0.09942 & -0.9112 & 0.1824 \tabularnewline
30 & -0.041784 & -0.383 & 0.35136 \tabularnewline
31 & -0.040049 & -0.3671 & 0.357251 \tabularnewline
32 & -0.080907 & -0.7415 & 0.230222 \tabularnewline
33 & -0.078657 & -0.7209 & 0.236485 \tabularnewline
34 & 0.007556 & 0.0693 & 0.472476 \tabularnewline
35 & 0.171626 & 1.573 & 0.059741 \tabularnewline
36 & 0.287063 & 2.631 & 0.005064 \tabularnewline
37 & 0.213481 & 1.9566 & 0.026859 \tabularnewline
38 & 0.079808 & 0.7315 & 0.233268 \tabularnewline
39 & 0.012316 & 0.1129 & 0.4552 \tabularnewline
40 & 0.011402 & 0.1045 & 0.45851 \tabularnewline
41 & 0.053364 & 0.4891 & 0.313026 \tabularnewline
42 & 0.081494 & 0.7469 & 0.228602 \tabularnewline
43 & 0.067773 & 0.6211 & 0.268092 \tabularnewline
44 & 0.017192 & 0.1576 & 0.437588 \tabularnewline
45 & -0.011392 & -0.1044 & 0.458548 \tabularnewline
46 & 0.010913 & 0.1 & 0.460285 \tabularnewline
47 & 0.088101 & 0.8075 & 0.21084 \tabularnewline
48 & 0.139151 & 1.2753 & 0.102853 \tabularnewline
\hline
\end{tabular}
%Source: https://freestatistics.org/blog/index.php?pk=243412&T=1

[TABLE]
[ROW][C]Autocorrelation Function[/C][/ROW]
[ROW][C]Time lag k[/C][C]ACF(k)[/C][C]T-STAT[/C][C]P-value[/C][/ROW]
[ROW][C]1[/C][C]0.809361[/C][C]7.4179[/C][C]0[/C][/ROW]
[ROW][C]2[/C][C]0.536691[/C][C]4.9189[/C][C]2e-06[/C][/ROW]
[ROW][C]3[/C][C]0.39323[/C][C]3.604[/C][C]0.000265[/C][/ROW]
[ROW][C]4[/C][C]0.372529[/C][C]3.4143[/C][C]0.000493[/C][/ROW]
[ROW][C]5[/C][C]0.430595[/C][C]3.9465[/C][C]8.2e-05[/C][/ROW]
[ROW][C]6[/C][C]0.450672[/C][C]4.1305[/C][C]4.3e-05[/C][/ROW]
[ROW][C]7[/C][C]0.361134[/C][C]3.3098[/C][C]0.000688[/C][/ROW]
[ROW][C]8[/C][C]0.222534[/C][C]2.0396[/C][C]0.022268[/C][/ROW]
[ROW][C]9[/C][C]0.144959[/C][C]1.3286[/C][C]0.093794[/C][/ROW]
[ROW][C]10[/C][C]0.187066[/C][C]1.7145[/C][C]0.045063[/C][/ROW]
[ROW][C]11[/C][C]0.353129[/C][C]3.2365[/C][C]0.000866[/C][/ROW]
[ROW][C]12[/C][C]0.439902[/C][C]4.0318[/C][C]6.1e-05[/C][/ROW]
[ROW][C]13[/C][C]0.253397[/C][C]2.3224[/C][C]0.011315[/C][/ROW]
[ROW][C]14[/C][C]0.002731[/C][C]0.025[/C][C]0.490044[/C][/ROW]
[ROW][C]15[/C][C]-0.132601[/C][C]-1.2153[/C][C]0.113826[/C][/ROW]
[ROW][C]16[/C][C]-0.149291[/C][C]-1.3683[/C][C]0.087437[/C][/ROW]
[ROW][C]17[/C][C]-0.094072[/C][C]-0.8622[/C][C]0.195521[/C][/ROW]
[ROW][C]18[/C][C]-0.063717[/C][C]-0.584[/C][C]0.280402[/C][/ROW]
[ROW][C]19[/C][C]-0.118217[/C][C]-1.0835[/C][C]0.140849[/C][/ROW]
[ROW][C]20[/C][C]-0.215373[/C][C]-1.9739[/C][C]0.025839[/C][/ROW]
[ROW][C]21[/C][C]-0.25831[/C][C]-2.3675[/C][C]0.010105[/C][/ROW]
[ROW][C]22[/C][C]-0.187121[/C][C]-1.715[/C][C]0.045017[/C][/ROW]
[ROW][C]23[/C][C]-0.010108[/C][C]-0.0926[/C][C]0.463205[/C][/ROW]
[ROW][C]24[/C][C]0.111796[/C][C]1.0246[/C][C]0.15424[/C][/ROW]
[ROW][C]25[/C][C]0.015901[/C][C]0.1457[/C][C]0.442241[/C][/ROW]
[ROW][C]26[/C][C]-0.143335[/C][C]-1.3137[/C][C]0.096265[/C][/ROW]
[ROW][C]27[/C][C]-0.210229[/C][C]-1.9268[/C][C]0.028694[/C][/ROW]
[ROW][C]28[/C][C]-0.180796[/C][C]-1.657[/C][C]0.050623[/C][/ROW]
[ROW][C]29[/C][C]-0.09942[/C][C]-0.9112[/C][C]0.1824[/C][/ROW]
[ROW][C]30[/C][C]-0.041784[/C][C]-0.383[/C][C]0.35136[/C][/ROW]
[ROW][C]31[/C][C]-0.040049[/C][C]-0.3671[/C][C]0.357251[/C][/ROW]
[ROW][C]32[/C][C]-0.080907[/C][C]-0.7415[/C][C]0.230222[/C][/ROW]
[ROW][C]33[/C][C]-0.078657[/C][C]-0.7209[/C][C]0.236485[/C][/ROW]
[ROW][C]34[/C][C]0.007556[/C][C]0.0693[/C][C]0.472476[/C][/ROW]
[ROW][C]35[/C][C]0.171626[/C][C]1.573[/C][C]0.059741[/C][/ROW]
[ROW][C]36[/C][C]0.287063[/C][C]2.631[/C][C]0.005064[/C][/ROW]
[ROW][C]37[/C][C]0.213481[/C][C]1.9566[/C][C]0.026859[/C][/ROW]
[ROW][C]38[/C][C]0.079808[/C][C]0.7315[/C][C]0.233268[/C][/ROW]
[ROW][C]39[/C][C]0.012316[/C][C]0.1129[/C][C]0.4552[/C][/ROW]
[ROW][C]40[/C][C]0.011402[/C][C]0.1045[/C][C]0.45851[/C][/ROW]
[ROW][C]41[/C][C]0.053364[/C][C]0.4891[/C][C]0.313026[/C][/ROW]
[ROW][C]42[/C][C]0.081494[/C][C]0.7469[/C][C]0.228602[/C][/ROW]
[ROW][C]43[/C][C]0.067773[/C][C]0.6211[/C][C]0.268092[/C][/ROW]
[ROW][C]44[/C][C]0.017192[/C][C]0.1576[/C][C]0.437588[/C][/ROW]
[ROW][C]45[/C][C]-0.011392[/C][C]-0.1044[/C][C]0.458548[/C][/ROW]
[ROW][C]46[/C][C]0.010913[/C][C]0.1[/C][C]0.460285[/C][/ROW]
[ROW][C]47[/C][C]0.088101[/C][C]0.8075[/C][C]0.21084[/C][/ROW]
[ROW][C]48[/C][C]0.139151[/C][C]1.2753[/C][C]0.102853[/C][/ROW]
[/TABLE]
Source: https://freestatistics.org/blog/index.php?pk=243412&T=1

Globally Unique Identifier (entire table): ba.freestatistics.org/blog/index.php?pk=243412&T=1

As an alternative you can also use a QR Code:  

The GUIDs for individual cells are displayed in the table below:

Autocorrelation Function
Time lag kACF(k)T-STATP-value
10.8093617.41790
20.5366914.91892e-06
30.393233.6040.000265
40.3725293.41430.000493
50.4305953.94658.2e-05
60.4506724.13054.3e-05
70.3611343.30980.000688
80.2225342.03960.022268
90.1449591.32860.093794
100.1870661.71450.045063
110.3531293.23650.000866
120.4399024.03186.1e-05
130.2533972.32240.011315
140.0027310.0250.490044
15-0.132601-1.21530.113826
16-0.149291-1.36830.087437
17-0.094072-0.86220.195521
18-0.063717-0.5840.280402
19-0.118217-1.08350.140849
20-0.215373-1.97390.025839
21-0.25831-2.36750.010105
22-0.187121-1.7150.045017
23-0.010108-0.09260.463205
240.1117961.02460.15424
250.0159010.14570.442241
26-0.143335-1.31370.096265
27-0.210229-1.92680.028694
28-0.180796-1.6570.050623
29-0.09942-0.91120.1824
30-0.041784-0.3830.35136
31-0.040049-0.36710.357251
32-0.080907-0.74150.230222
33-0.078657-0.72090.236485
340.0075560.06930.472476
350.1716261.5730.059741
360.2870632.6310.005064
370.2134811.95660.026859
380.0798080.73150.233268
390.0123160.11290.4552
400.0114020.10450.45851
410.0533640.48910.313026
420.0814940.74690.228602
430.0677730.62110.268092
440.0171920.15760.437588
45-0.011392-0.10440.458548
460.0109130.10.460285
470.0881010.80750.21084
480.1391511.27530.102853


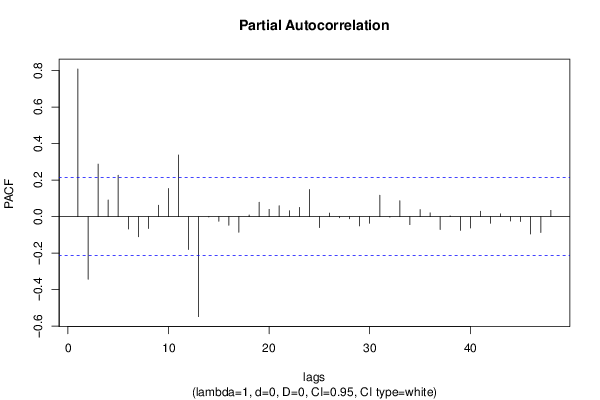
Partial Autocorrelation Function
Time lag kPACF(k)T-STATP-value
10.8093617.41790
2-0.343177-3.14530.001147
30.2876622.63650.004989
40.0910550.83450.203174
50.2272182.08250.02017
6-0.067554-0.61910.268748
7-0.110734-1.01490.156534
8-0.064913-0.59490.276742
90.0621850.56990.285122
100.1543531.41470.080431
110.3377713.09570.001334
12-0.180062-1.65030.051309
13-0.548238-5.02471e-06
14-0.002034-0.01860.492585
15-0.025856-0.2370.406629
16-0.047437-0.43480.332425
17-0.08576-0.7860.217039
180.0088970.08150.467603
190.0785410.71980.23681
200.0397710.36450.358198
210.059930.54930.292138
220.0325480.29830.383104
230.0505310.46310.322235
240.1487391.36320.088229
25-0.06016-0.55140.29142
260.0193770.17760.429734
27-0.006259-0.05740.477195
28-0.011744-0.10760.457271
29-0.050947-0.46690.320877
30-0.036336-0.3330.369972
310.1174411.07640.142424
32-0.002928-0.02680.489328
330.0874170.80120.212641
34-0.043997-0.40320.343899
350.0384750.35260.362623
360.0207970.19060.424647
37-0.070467-0.64580.260071
380.0040730.03730.485155
39-0.07534-0.69050.245892
40-0.062472-0.57260.284234
410.0290890.26660.395212
42-0.036446-0.3340.369593
430.0150780.13820.445208
44-0.024481-0.22440.411507
45-0.026566-0.24350.404114
46-0.09489-0.86970.193477
47-0.087033-0.79770.213655
480.0343880.31520.376707

\begin{tabular}{lllllllll}
\hline
Partial Autocorrelation Function \tabularnewline
Time lag k & PACF(k) & T-STAT & P-value \tabularnewline
1 & 0.809361 & 7.4179 & 0 \tabularnewline
2 & -0.343177 & -3.1453 & 0.001147 \tabularnewline
3 & 0.287662 & 2.6365 & 0.004989 \tabularnewline
4 & 0.091055 & 0.8345 & 0.203174 \tabularnewline
5 & 0.227218 & 2.0825 & 0.02017 \tabularnewline
6 & -0.067554 & -0.6191 & 0.268748 \tabularnewline
7 & -0.110734 & -1.0149 & 0.156534 \tabularnewline
8 & -0.064913 & -0.5949 & 0.276742 \tabularnewline
9 & 0.062185 & 0.5699 & 0.285122 \tabularnewline
10 & 0.154353 & 1.4147 & 0.080431 \tabularnewline
11 & 0.337771 & 3.0957 & 0.001334 \tabularnewline
12 & -0.180062 & -1.6503 & 0.051309 \tabularnewline
13 & -0.548238 & -5.0247 & 1e-06 \tabularnewline
14 & -0.002034 & -0.0186 & 0.492585 \tabularnewline
15 & -0.025856 & -0.237 & 0.406629 \tabularnewline
16 & -0.047437 & -0.4348 & 0.332425 \tabularnewline
17 & -0.08576 & -0.786 & 0.217039 \tabularnewline
18 & 0.008897 & 0.0815 & 0.467603 \tabularnewline
19 & 0.078541 & 0.7198 & 0.23681 \tabularnewline
20 & 0.039771 & 0.3645 & 0.358198 \tabularnewline
21 & 0.05993 & 0.5493 & 0.292138 \tabularnewline
22 & 0.032548 & 0.2983 & 0.383104 \tabularnewline
23 & 0.050531 & 0.4631 & 0.322235 \tabularnewline
24 & 0.148739 & 1.3632 & 0.088229 \tabularnewline
25 & -0.06016 & -0.5514 & 0.29142 \tabularnewline
26 & 0.019377 & 0.1776 & 0.429734 \tabularnewline
27 & -0.006259 & -0.0574 & 0.477195 \tabularnewline
28 & -0.011744 & -0.1076 & 0.457271 \tabularnewline
29 & -0.050947 & -0.4669 & 0.320877 \tabularnewline
30 & -0.036336 & -0.333 & 0.369972 \tabularnewline
31 & 0.117441 & 1.0764 & 0.142424 \tabularnewline
32 & -0.002928 & -0.0268 & 0.489328 \tabularnewline
33 & 0.087417 & 0.8012 & 0.212641 \tabularnewline
34 & -0.043997 & -0.4032 & 0.343899 \tabularnewline
35 & 0.038475 & 0.3526 & 0.362623 \tabularnewline
36 & 0.020797 & 0.1906 & 0.424647 \tabularnewline
37 & -0.070467 & -0.6458 & 0.260071 \tabularnewline
38 & 0.004073 & 0.0373 & 0.485155 \tabularnewline
39 & -0.07534 & -0.6905 & 0.245892 \tabularnewline
40 & -0.062472 & -0.5726 & 0.284234 \tabularnewline
41 & 0.029089 & 0.2666 & 0.395212 \tabularnewline
42 & -0.036446 & -0.334 & 0.369593 \tabularnewline
43 & 0.015078 & 0.1382 & 0.445208 \tabularnewline
44 & -0.024481 & -0.2244 & 0.411507 \tabularnewline
45 & -0.026566 & -0.2435 & 0.404114 \tabularnewline
46 & -0.09489 & -0.8697 & 0.193477 \tabularnewline
47 & -0.087033 & -0.7977 & 0.213655 \tabularnewline
48 & 0.034388 & 0.3152 & 0.376707 \tabularnewline
\hline
\end{tabular}
%Source: https://freestatistics.org/blog/index.php?pk=243412&T=2

[TABLE]
[ROW][C]Partial Autocorrelation Function[/C][/ROW]
[ROW][C]Time lag k[/C][C]PACF(k)[/C][C]T-STAT[/C][C]P-value[/C][/ROW]
[ROW][C]1[/C][C]0.809361[/C][C]7.4179[/C][C]0[/C][/ROW]
[ROW][C]2[/C][C]-0.343177[/C][C]-3.1453[/C][C]0.001147[/C][/ROW]
[ROW][C]3[/C][C]0.287662[/C][C]2.6365[/C][C]0.004989[/C][/ROW]
[ROW][C]4[/C][C]0.091055[/C][C]0.8345[/C][C]0.203174[/C][/ROW]
[ROW][C]5[/C][C]0.227218[/C][C]2.0825[/C][C]0.02017[/C][/ROW]
[ROW][C]6[/C][C]-0.067554[/C][C]-0.6191[/C][C]0.268748[/C][/ROW]
[ROW][C]7[/C][C]-0.110734[/C][C]-1.0149[/C][C]0.156534[/C][/ROW]
[ROW][C]8[/C][C]-0.064913[/C][C]-0.5949[/C][C]0.276742[/C][/ROW]
[ROW][C]9[/C][C]0.062185[/C][C]0.5699[/C][C]0.285122[/C][/ROW]
[ROW][C]10[/C][C]0.154353[/C][C]1.4147[/C][C]0.080431[/C][/ROW]
[ROW][C]11[/C][C]0.337771[/C][C]3.0957[/C][C]0.001334[/C][/ROW]
[ROW][C]12[/C][C]-0.180062[/C][C]-1.6503[/C][C]0.051309[/C][/ROW]
[ROW][C]13[/C][C]-0.548238[/C][C]-5.0247[/C][C]1e-06[/C][/ROW]
[ROW][C]14[/C][C]-0.002034[/C][C]-0.0186[/C][C]0.492585[/C][/ROW]
[ROW][C]15[/C][C]-0.025856[/C][C]-0.237[/C][C]0.406629[/C][/ROW]
[ROW][C]16[/C][C]-0.047437[/C][C]-0.4348[/C][C]0.332425[/C][/ROW]
[ROW][C]17[/C][C]-0.08576[/C][C]-0.786[/C][C]0.217039[/C][/ROW]
[ROW][C]18[/C][C]0.008897[/C][C]0.0815[/C][C]0.467603[/C][/ROW]
[ROW][C]19[/C][C]0.078541[/C][C]0.7198[/C][C]0.23681[/C][/ROW]
[ROW][C]20[/C][C]0.039771[/C][C]0.3645[/C][C]0.358198[/C][/ROW]
[ROW][C]21[/C][C]0.05993[/C][C]0.5493[/C][C]0.292138[/C][/ROW]
[ROW][C]22[/C][C]0.032548[/C][C]0.2983[/C][C]0.383104[/C][/ROW]
[ROW][C]23[/C][C]0.050531[/C][C]0.4631[/C][C]0.322235[/C][/ROW]
[ROW][C]24[/C][C]0.148739[/C][C]1.3632[/C][C]0.088229[/C][/ROW]
[ROW][C]25[/C][C]-0.06016[/C][C]-0.5514[/C][C]0.29142[/C][/ROW]
[ROW][C]26[/C][C]0.019377[/C][C]0.1776[/C][C]0.429734[/C][/ROW]
[ROW][C]27[/C][C]-0.006259[/C][C]-0.0574[/C][C]0.477195[/C][/ROW]
[ROW][C]28[/C][C]-0.011744[/C][C]-0.1076[/C][C]0.457271[/C][/ROW]
[ROW][C]29[/C][C]-0.050947[/C][C]-0.4669[/C][C]0.320877[/C][/ROW]
[ROW][C]30[/C][C]-0.036336[/C][C]-0.333[/C][C]0.369972[/C][/ROW]
[ROW][C]31[/C][C]0.117441[/C][C]1.0764[/C][C]0.142424[/C][/ROW]
[ROW][C]32[/C][C]-0.002928[/C][C]-0.0268[/C][C]0.489328[/C][/ROW]
[ROW][C]33[/C][C]0.087417[/C][C]0.8012[/C][C]0.212641[/C][/ROW]
[ROW][C]34[/C][C]-0.043997[/C][C]-0.4032[/C][C]0.343899[/C][/ROW]
[ROW][C]35[/C][C]0.038475[/C][C]0.3526[/C][C]0.362623[/C][/ROW]
[ROW][C]36[/C][C]0.020797[/C][C]0.1906[/C][C]0.424647[/C][/ROW]
[ROW][C]37[/C][C]-0.070467[/C][C]-0.6458[/C][C]0.260071[/C][/ROW]
[ROW][C]38[/C][C]0.004073[/C][C]0.0373[/C][C]0.485155[/C][/ROW]
[ROW][C]39[/C][C]-0.07534[/C][C]-0.6905[/C][C]0.245892[/C][/ROW]
[ROW][C]40[/C][C]-0.062472[/C][C]-0.5726[/C][C]0.284234[/C][/ROW]
[ROW][C]41[/C][C]0.029089[/C][C]0.2666[/C][C]0.395212[/C][/ROW]
[ROW][C]42[/C][C]-0.036446[/C][C]-0.334[/C][C]0.369593[/C][/ROW]
[ROW][C]43[/C][C]0.015078[/C][C]0.1382[/C][C]0.445208[/C][/ROW]
[ROW][C]44[/C][C]-0.024481[/C][C]-0.2244[/C][C]0.411507[/C][/ROW]
[ROW][C]45[/C][C]-0.026566[/C][C]-0.2435[/C][C]0.404114[/C][/ROW]
[ROW][C]46[/C][C]-0.09489[/C][C]-0.8697[/C][C]0.193477[/C][/ROW]
[ROW][C]47[/C][C]-0.087033[/C][C]-0.7977[/C][C]0.213655[/C][/ROW]
[ROW][C]48[/C][C]0.034388[/C][C]0.3152[/C][C]0.376707[/C][/ROW]
[/TABLE]
Source: https://freestatistics.org/blog/index.php?pk=243412&T=2

Globally Unique Identifier (entire table): ba.freestatistics.org/blog/index.php?pk=243412&T=2

As an alternative you can also use a QR Code:  

The GUIDs for individual cells are displayed in the table below:

Partial Autocorrelation Function
Time lag kPACF(k)T-STATP-value
10.8093617.41790
2-0.343177-3.14530.001147
30.2876622.63650.004989
40.0910550.83450.203174
50.2272182.08250.02017
6-0.067554-0.61910.268748
7-0.110734-1.01490.156534
8-0.064913-0.59490.276742
90.0621850.56990.285122
100.1543531.41470.080431
110.3377713.09570.001334
12-0.180062-1.65030.051309
13-0.548238-5.02471e-06
14-0.002034-0.01860.492585
15-0.025856-0.2370.406629
16-0.047437-0.43480.332425
17-0.08576-0.7860.217039
180.0088970.08150.467603
190.0785410.71980.23681
200.0397710.36450.358198
210.059930.54930.292138
220.0325480.29830.383104
230.0505310.46310.322235
240.1487391.36320.088229
25-0.06016-0.55140.29142
260.0193770.17760.429734
27-0.006259-0.05740.477195
28-0.011744-0.10760.457271
29-0.050947-0.46690.320877
30-0.036336-0.3330.369972
310.1174411.07640.142424
32-0.002928-0.02680.489328
330.0874170.80120.212641
34-0.043997-0.40320.343899
350.0384750.35260.362623
360.0207970.19060.424647
37-0.070467-0.64580.260071
380.0040730.03730.485155
39-0.07534-0.69050.245892
40-0.062472-0.57260.284234
410.0290890.26660.395212
42-0.036446-0.3340.369593
430.0150780.13820.445208
44-0.024481-0.22440.411507
45-0.026566-0.24350.404114
46-0.09489-0.86970.193477
47-0.087033-0.79770.213655
480.0343880.31520.376707


Parameters (Session):
par1 = 48 ; par2 = 1 ; par3 = 0 ; par4 = 0 ; par5 = 12 ; par6 = White Noise ; par7 = 0.95 ;
Parameters (R input):
par1 = 48 ; par2 = 1 ; par3 = 0 ; par4 = 0 ; par5 = 12 ; par6 = White Noise ; par7 = 0.95 ; par8 = ;
R code (references can be found in the software module):
if (par1 == 'Default') {
par1 = 10*log10(length(x))
} else {
par1 <- as.numeric(par1)
}
par2 <- as.numeric(par2)
par3 <- as.numeric(par3)
par4 <- as.numeric(par4)
par5 <- as.numeric(par5)
if (par6 == 'White Noise') par6 <- 'white' else par6 <- 'ma'
par7 <- as.numeric(par7)
if (par8 != '') par8 <- as.numeric(par8)
ox <- x
if (par8 == '') {
if (par2 == 0) {
x <- log(x)
} else {
x <- (x ^ par2 - 1) / par2
}
} else {
x <- log(x,base=par8)
}
if (par3 > 0) x <- diff(x,lag=1,difference=par3)
if (par4 > 0) x <- diff(x,lag=par5,difference=par4)
bitmap(file='picts.png')
op <- par(mfrow=c(2,1))
plot(ox,type='l',main='Original Time Series',xlab='time',ylab='value')
if (par8=='') {
mytitle <- paste('Working Time Series (lambda=',par2,', d=',par3,', D=',par4,')',sep='')
mysub <- paste('(lambda=',par2,', d=',par3,', D=',par4,', CI=', par7, ', CI type=',par6,')',sep='')
} else {
mytitle <- paste('Working Time Series (base=',par8,', d=',par3,', D=',par4,')',sep='')
mysub <- paste('(base=',par8,', d=',par3,', D=',par4,', CI=', par7, ', CI type=',par6,')',sep='')
}
plot(x,type='l', main=mytitle,xlab='time',ylab='value')
par(op)
dev.off()
bitmap(file='pic1.png')
racf <- acf(x, par1, main='Autocorrelation', xlab='time lag', ylab='ACF', ci.type=par6, ci=par7, sub=mysub)
dev.off()
bitmap(file='pic2.png')
rpacf <- pacf(x,par1,main='Partial Autocorrelation',xlab='lags',ylab='PACF',sub=mysub)
dev.off()
(myacf <- c(racf$acf))
(mypacf <- c(rpacf$acf))
lengthx <- length(x)
sqrtn <- sqrt(lengthx)
load(file='createtable')
a<-table.start()
a<-table.row.start(a)
a<-table.element(a,'Autocorrelation Function',4,TRUE)
a<-table.row.end(a)
a<-table.row.start(a)
a<-table.element(a,'Time lag k',header=TRUE)
a<-table.element(a,hyperlink('basics.htm','ACF(k)','click here for more information about the Autocorrelation Function'),header=TRUE)
a<-table.element(a,'T-STAT',header=TRUE)
a<-table.element(a,'P-value',header=TRUE)
a<-table.row.end(a)
for (i in 2:(par1+1)) {
a<-table.row.start(a)
a<-table.element(a,i-1,header=TRUE)
a<-table.element(a,round(myacf[i],6))
mytstat <- myacf[i]*sqrtn
a<-table.element(a,round(mytstat,4))
a<-table.element(a,round(1-pt(abs(mytstat),lengthx),6))
a<-table.row.end(a)
}
a<-table.end(a)
table.save(a,file='mytable.tab')
a<-table.start()
a<-table.row.start(a)
a<-table.element(a,'Partial Autocorrelation Function',4,TRUE)
a<-table.row.end(a)
a<-table.row.start(a)
a<-table.element(a,'Time lag k',header=TRUE)
a<-table.element(a,hyperlink('basics.htm','PACF(k)','click here for more information about the Partial Autocorrelation Function'),header=TRUE)
a<-table.element(a,'T-STAT',header=TRUE)
a<-table.element(a,'P-value',header=TRUE)
a<-table.row.end(a)
for (i in 1:par1) {
a<-table.row.start(a)
a<-table.element(a,i,header=TRUE)
a<-table.element(a,round(mypacf[i],6))
mytstat <- mypacf[i]*sqrtn
a<-table.element(a,round(mytstat,4))
a<-table.element(a,round(1-pt(abs(mytstat),lengthx),6))
a<-table.row.end(a)
}
a<-table.end(a)
table.save(a,file='mytable1.tab')