Free Statistics

of Irreproducible Research!

Author's title

Author*Unverified author*
R Software Modulerwasp_autocorrelation.wasp
Title produced by software(Partial) Autocorrelation Function
Date of computationFri, 17 Oct 2014 18:38:20 +0100
Cite this page as followsStatistical Computations at FreeStatistics.org, Office for Research Development and Education, URL https://freestatistics.org/blog/index.php?v=date/2014/Oct/17/t1413567515fvd61hwlfehhiv3.htm/, Retrieved Thu, 09 May 2024 23:00:26 +0000
Statistical Computations at FreeStatistics.org, Office for Research Development and Education, URL https://freestatistics.org/blog/index.php?pk=243363, Retrieved Thu, 09 May 2024 23:00:26 +0000
QR Codes:

Original text written by user:
IsPrivate?No (this computation is public)
User-defined keywords
Estimated Impact74
Family? (F = Feedback message, R = changed R code, M = changed R Module, P = changed Parameters, D = changed Data)
-       [(Partial) Autocorrelation Function] [] [2014-10-17 17:38:20] [397b699eae6f3431a51b0bb18afa5c27] [Current]
Feedback Forum

Post a new message
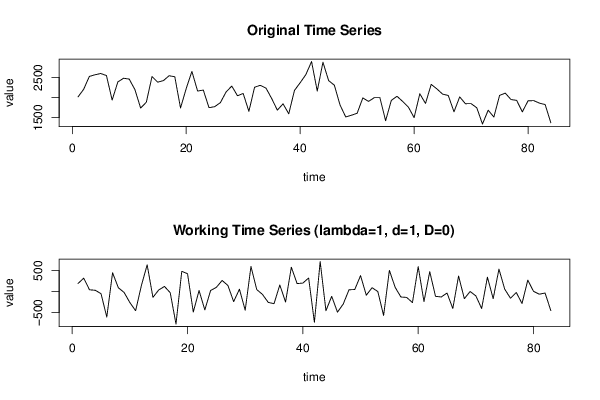
Dataseries X:
2011
2203
2523
2565
2596
2545
1935
2386
2478
2457
2194
1736
1881
2520
2381
2419
2541
2514
1737
2221
2648
2159
2184
1745
1770
1871
2137
2283
2042
2099
1653
2254
2302
2233
1974
1684
1842
1592
2175
2366
2569
2894
2159
2877
2419
2305
1812
1514
1557
1606
1988
1901
1993
1993
1420
1927
2029
1899
1759
1496
2091
1850
2326
2212
2083
2048
1642
2014
1844
1846
1743
1337
1682
1512
2050
2108
1948
1927
1641
1916
1921
1858
1823
1367


Summary of computational transaction
Raw Inputview raw input (R code)
Raw Outputview raw output of R engine
Computing time1 seconds
R Server'Gwilym Jenkins' @ jenkins.wessa.net

\begin{tabular}{lllllllll}
\hline
Summary of computational transaction \tabularnewline
Raw Input & view raw input (R code)  \tabularnewline
Raw Output & view raw output of R engine  \tabularnewline
Computing time & 1 seconds \tabularnewline
R Server & 'Gwilym Jenkins' @ jenkins.wessa.net \tabularnewline
\hline
\end{tabular}
%Source: https://freestatistics.org/blog/index.php?pk=243363&T=0

[TABLE]
[ROW][C]Summary of computational transaction[/C][/ROW]
[ROW][C]Raw Input[/C][C]view raw input (R code) [/C][/ROW]
[ROW][C]Raw Output[/C][C]view raw output of R engine [/C][/ROW]
[ROW][C]Computing time[/C][C]1 seconds[/C][/ROW]
[ROW][C]R Server[/C][C]'Gwilym Jenkins' @ jenkins.wessa.net[/C][/ROW]
[/TABLE]
Source: https://freestatistics.org/blog/index.php?pk=243363&T=0

Globally Unique Identifier (entire table): ba.freestatistics.org/blog/index.php?pk=243363&T=0

As an alternative you can also use a QR Code:  

The GUIDs for individual cells are displayed in the table below:

Summary of computational transaction
Raw Inputview raw input (R code)
Raw Outputview raw output of R engine
Computing time1 seconds
R Server'Gwilym Jenkins' @ jenkins.wessa.net


Autocorrelation Function
Time lag kACF(k)T-STATP-value
1-0.295552-2.69260.004287
20.038340.34930.363878
3-0.129657-1.18120.120443
4-0.250202-2.27940.012604
50.2764592.51870.00685
6-0.212508-1.9360.028134
70.3417563.11350.001268
8-0.292227-2.66230.004659
9-0.123077-1.12130.1327
100.0287970.26240.39685
11-0.193898-1.76650.040495
120.6384695.81670
13-0.213908-1.94880.027349
140.0333430.30380.381031
15-0.130131-1.18560.119591
16-0.206115-1.87780.031961
170.2286642.08320.020154
18-0.125232-1.14090.128593
190.3162052.88080.002523
20-0.239856-2.18520.015847
21-0.081865-0.74580.228941
220.0031390.02860.488629
23-0.11538-1.05120.148118
240.4631224.21923.1e-05
25-0.16296-1.48460.070714
260.0353830.32240.373998
27-0.115542-1.05260.147781
28-0.12931-1.17810.121067
290.1653641.50650.067863
30-0.099653-0.90790.183283
310.2213492.01660.023486
32-0.222293-2.02520.023031
33-0.052385-0.47720.31722
34-0.004247-0.03870.484614
35-0.098413-0.89660.186267
360.4098623.7340.000172
37-0.128919-1.17450.121776
380.0363910.33150.370537
39-0.095069-0.86610.194462
40-0.033629-0.30640.380044
410.1086470.98980.16257
42-0.064966-0.59190.277774
430.1626521.48180.071087
44-0.185174-1.6870.047678
45-0.058432-0.53230.297957
46-0.063324-0.57690.28278
470.0289140.26340.396442
480.2178271.98450.025252

\begin{tabular}{lllllllll}
\hline
Autocorrelation Function \tabularnewline
Time lag k & ACF(k) & T-STAT & P-value \tabularnewline
1 & -0.295552 & -2.6926 & 0.004287 \tabularnewline
2 & 0.03834 & 0.3493 & 0.363878 \tabularnewline
3 & -0.129657 & -1.1812 & 0.120443 \tabularnewline
4 & -0.250202 & -2.2794 & 0.012604 \tabularnewline
5 & 0.276459 & 2.5187 & 0.00685 \tabularnewline
6 & -0.212508 & -1.936 & 0.028134 \tabularnewline
7 & 0.341756 & 3.1135 & 0.001268 \tabularnewline
8 & -0.292227 & -2.6623 & 0.004659 \tabularnewline
9 & -0.123077 & -1.1213 & 0.1327 \tabularnewline
10 & 0.028797 & 0.2624 & 0.39685 \tabularnewline
11 & -0.193898 & -1.7665 & 0.040495 \tabularnewline
12 & 0.638469 & 5.8167 & 0 \tabularnewline
13 & -0.213908 & -1.9488 & 0.027349 \tabularnewline
14 & 0.033343 & 0.3038 & 0.381031 \tabularnewline
15 & -0.130131 & -1.1856 & 0.119591 \tabularnewline
16 & -0.206115 & -1.8778 & 0.031961 \tabularnewline
17 & 0.228664 & 2.0832 & 0.020154 \tabularnewline
18 & -0.125232 & -1.1409 & 0.128593 \tabularnewline
19 & 0.316205 & 2.8808 & 0.002523 \tabularnewline
20 & -0.239856 & -2.1852 & 0.015847 \tabularnewline
21 & -0.081865 & -0.7458 & 0.228941 \tabularnewline
22 & 0.003139 & 0.0286 & 0.488629 \tabularnewline
23 & -0.11538 & -1.0512 & 0.148118 \tabularnewline
24 & 0.463122 & 4.2192 & 3.1e-05 \tabularnewline
25 & -0.16296 & -1.4846 & 0.070714 \tabularnewline
26 & 0.035383 & 0.3224 & 0.373998 \tabularnewline
27 & -0.115542 & -1.0526 & 0.147781 \tabularnewline
28 & -0.12931 & -1.1781 & 0.121067 \tabularnewline
29 & 0.165364 & 1.5065 & 0.067863 \tabularnewline
30 & -0.099653 & -0.9079 & 0.183283 \tabularnewline
31 & 0.221349 & 2.0166 & 0.023486 \tabularnewline
32 & -0.222293 & -2.0252 & 0.023031 \tabularnewline
33 & -0.052385 & -0.4772 & 0.31722 \tabularnewline
34 & -0.004247 & -0.0387 & 0.484614 \tabularnewline
35 & -0.098413 & -0.8966 & 0.186267 \tabularnewline
36 & 0.409862 & 3.734 & 0.000172 \tabularnewline
37 & -0.128919 & -1.1745 & 0.121776 \tabularnewline
38 & 0.036391 & 0.3315 & 0.370537 \tabularnewline
39 & -0.095069 & -0.8661 & 0.194462 \tabularnewline
40 & -0.033629 & -0.3064 & 0.380044 \tabularnewline
41 & 0.108647 & 0.9898 & 0.16257 \tabularnewline
42 & -0.064966 & -0.5919 & 0.277774 \tabularnewline
43 & 0.162652 & 1.4818 & 0.071087 \tabularnewline
44 & -0.185174 & -1.687 & 0.047678 \tabularnewline
45 & -0.058432 & -0.5323 & 0.297957 \tabularnewline
46 & -0.063324 & -0.5769 & 0.28278 \tabularnewline
47 & 0.028914 & 0.2634 & 0.396442 \tabularnewline
48 & 0.217827 & 1.9845 & 0.025252 \tabularnewline
\hline
\end{tabular}
%Source: https://freestatistics.org/blog/index.php?pk=243363&T=1

[TABLE]
[ROW][C]Autocorrelation Function[/C][/ROW]
[ROW][C]Time lag k[/C][C]ACF(k)[/C][C]T-STAT[/C][C]P-value[/C][/ROW]
[ROW][C]1[/C][C]-0.295552[/C][C]-2.6926[/C][C]0.004287[/C][/ROW]
[ROW][C]2[/C][C]0.03834[/C][C]0.3493[/C][C]0.363878[/C][/ROW]
[ROW][C]3[/C][C]-0.129657[/C][C]-1.1812[/C][C]0.120443[/C][/ROW]
[ROW][C]4[/C][C]-0.250202[/C][C]-2.2794[/C][C]0.012604[/C][/ROW]
[ROW][C]5[/C][C]0.276459[/C][C]2.5187[/C][C]0.00685[/C][/ROW]
[ROW][C]6[/C][C]-0.212508[/C][C]-1.936[/C][C]0.028134[/C][/ROW]
[ROW][C]7[/C][C]0.341756[/C][C]3.1135[/C][C]0.001268[/C][/ROW]
[ROW][C]8[/C][C]-0.292227[/C][C]-2.6623[/C][C]0.004659[/C][/ROW]
[ROW][C]9[/C][C]-0.123077[/C][C]-1.1213[/C][C]0.1327[/C][/ROW]
[ROW][C]10[/C][C]0.028797[/C][C]0.2624[/C][C]0.39685[/C][/ROW]
[ROW][C]11[/C][C]-0.193898[/C][C]-1.7665[/C][C]0.040495[/C][/ROW]
[ROW][C]12[/C][C]0.638469[/C][C]5.8167[/C][C]0[/C][/ROW]
[ROW][C]13[/C][C]-0.213908[/C][C]-1.9488[/C][C]0.027349[/C][/ROW]
[ROW][C]14[/C][C]0.033343[/C][C]0.3038[/C][C]0.381031[/C][/ROW]
[ROW][C]15[/C][C]-0.130131[/C][C]-1.1856[/C][C]0.119591[/C][/ROW]
[ROW][C]16[/C][C]-0.206115[/C][C]-1.8778[/C][C]0.031961[/C][/ROW]
[ROW][C]17[/C][C]0.228664[/C][C]2.0832[/C][C]0.020154[/C][/ROW]
[ROW][C]18[/C][C]-0.125232[/C][C]-1.1409[/C][C]0.128593[/C][/ROW]
[ROW][C]19[/C][C]0.316205[/C][C]2.8808[/C][C]0.002523[/C][/ROW]
[ROW][C]20[/C][C]-0.239856[/C][C]-2.1852[/C][C]0.015847[/C][/ROW]
[ROW][C]21[/C][C]-0.081865[/C][C]-0.7458[/C][C]0.228941[/C][/ROW]
[ROW][C]22[/C][C]0.003139[/C][C]0.0286[/C][C]0.488629[/C][/ROW]
[ROW][C]23[/C][C]-0.11538[/C][C]-1.0512[/C][C]0.148118[/C][/ROW]
[ROW][C]24[/C][C]0.463122[/C][C]4.2192[/C][C]3.1e-05[/C][/ROW]
[ROW][C]25[/C][C]-0.16296[/C][C]-1.4846[/C][C]0.070714[/C][/ROW]
[ROW][C]26[/C][C]0.035383[/C][C]0.3224[/C][C]0.373998[/C][/ROW]
[ROW][C]27[/C][C]-0.115542[/C][C]-1.0526[/C][C]0.147781[/C][/ROW]
[ROW][C]28[/C][C]-0.12931[/C][C]-1.1781[/C][C]0.121067[/C][/ROW]
[ROW][C]29[/C][C]0.165364[/C][C]1.5065[/C][C]0.067863[/C][/ROW]
[ROW][C]30[/C][C]-0.099653[/C][C]-0.9079[/C][C]0.183283[/C][/ROW]
[ROW][C]31[/C][C]0.221349[/C][C]2.0166[/C][C]0.023486[/C][/ROW]
[ROW][C]32[/C][C]-0.222293[/C][C]-2.0252[/C][C]0.023031[/C][/ROW]
[ROW][C]33[/C][C]-0.052385[/C][C]-0.4772[/C][C]0.31722[/C][/ROW]
[ROW][C]34[/C][C]-0.004247[/C][C]-0.0387[/C][C]0.484614[/C][/ROW]
[ROW][C]35[/C][C]-0.098413[/C][C]-0.8966[/C][C]0.186267[/C][/ROW]
[ROW][C]36[/C][C]0.409862[/C][C]3.734[/C][C]0.000172[/C][/ROW]
[ROW][C]37[/C][C]-0.128919[/C][C]-1.1745[/C][C]0.121776[/C][/ROW]
[ROW][C]38[/C][C]0.036391[/C][C]0.3315[/C][C]0.370537[/C][/ROW]
[ROW][C]39[/C][C]-0.095069[/C][C]-0.8661[/C][C]0.194462[/C][/ROW]
[ROW][C]40[/C][C]-0.033629[/C][C]-0.3064[/C][C]0.380044[/C][/ROW]
[ROW][C]41[/C][C]0.108647[/C][C]0.9898[/C][C]0.16257[/C][/ROW]
[ROW][C]42[/C][C]-0.064966[/C][C]-0.5919[/C][C]0.277774[/C][/ROW]
[ROW][C]43[/C][C]0.162652[/C][C]1.4818[/C][C]0.071087[/C][/ROW]
[ROW][C]44[/C][C]-0.185174[/C][C]-1.687[/C][C]0.047678[/C][/ROW]
[ROW][C]45[/C][C]-0.058432[/C][C]-0.5323[/C][C]0.297957[/C][/ROW]
[ROW][C]46[/C][C]-0.063324[/C][C]-0.5769[/C][C]0.28278[/C][/ROW]
[ROW][C]47[/C][C]0.028914[/C][C]0.2634[/C][C]0.396442[/C][/ROW]
[ROW][C]48[/C][C]0.217827[/C][C]1.9845[/C][C]0.025252[/C][/ROW]
[/TABLE]
Source: https://freestatistics.org/blog/index.php?pk=243363&T=1

Globally Unique Identifier (entire table): ba.freestatistics.org/blog/index.php?pk=243363&T=1

As an alternative you can also use a QR Code:  

The GUIDs for individual cells are displayed in the table below:

Autocorrelation Function
Time lag kACF(k)T-STATP-value
1-0.295552-2.69260.004287
20.038340.34930.363878
3-0.129657-1.18120.120443
4-0.250202-2.27940.012604
50.2764592.51870.00685
6-0.212508-1.9360.028134
70.3417563.11350.001268
8-0.292227-2.66230.004659
9-0.123077-1.12130.1327
100.0287970.26240.39685
11-0.193898-1.76650.040495
120.6384695.81670
13-0.213908-1.94880.027349
140.0333430.30380.381031
15-0.130131-1.18560.119591
16-0.206115-1.87780.031961
170.2286642.08320.020154
18-0.125232-1.14090.128593
190.3162052.88080.002523
20-0.239856-2.18520.015847
21-0.081865-0.74580.228941
220.0031390.02860.488629
23-0.11538-1.05120.148118
240.4631224.21923.1e-05
25-0.16296-1.48460.070714
260.0353830.32240.373998
27-0.115542-1.05260.147781
28-0.12931-1.17810.121067
290.1653641.50650.067863
30-0.099653-0.90790.183283
310.2213492.01660.023486
32-0.222293-2.02520.023031
33-0.052385-0.47720.31722
34-0.004247-0.03870.484614
35-0.098413-0.89660.186267
360.4098623.7340.000172
37-0.128919-1.17450.121776
380.0363910.33150.370537
39-0.095069-0.86610.194462
40-0.033629-0.30640.380044
410.1086470.98980.16257
42-0.064966-0.59190.277774
430.1626521.48180.071087
44-0.185174-1.6870.047678
45-0.058432-0.53230.297957
46-0.063324-0.57690.28278
470.0289140.26340.396442
480.2178271.98450.025252


Partial Autocorrelation Function
Time lag kPACF(k)T-STATP-value
1-0.295552-2.69260.004287
2-0.053702-0.48920.312978
3-0.146798-1.33740.092374
4-0.371939-3.38850.000538
50.0853420.77750.219536
6-0.185169-1.6870.047682
70.1951911.77830.03951
8-0.245612-2.23760.013962
9-0.244613-2.22850.014275
10-0.214076-1.95030.027257
11-0.289143-2.63420.005029
120.3721893.39080.000535
130.0646710.58920.278672
14-0.104625-0.95320.171633
15-0.07066-0.64370.260758
16-0.111605-1.01680.156109
17-0.09383-0.85480.197554
18-0.014568-0.13270.447366
19-0.023091-0.21040.416947
20-0.029555-0.26930.394201
210.0092380.08420.466565
22-0.068083-0.62030.26839
23-0.01962-0.17870.429285
240.0413180.37640.35378
25-0.008654-0.07880.468676
26-0.023419-0.21340.415786
270.0365940.33340.369842
280.0722830.65850.256011
290.039840.3630.358779
30-0.029153-0.26560.395603
31-0.099313-0.90480.184098
32-0.094973-0.86520.194699
33-0.029626-0.26990.393951
34-0.022464-0.20470.419169
35-0.096546-0.87960.190815
360.0955660.87060.19323
370.0440110.4010.344739
38-0.004291-0.03910.484455
390.0078810.07180.471468
400.1204271.09710.137877
410.0296110.26980.394003
420.0880160.80190.212462
430.0055080.05020.480051
440.0824520.75120.227337
450.0333350.30370.38106
46-0.099232-0.9040.184294
470.1183671.07840.141995
48-0.061532-0.56060.288296

\begin{tabular}{lllllllll}
\hline
Partial Autocorrelation Function \tabularnewline
Time lag k & PACF(k) & T-STAT & P-value \tabularnewline
1 & -0.295552 & -2.6926 & 0.004287 \tabularnewline
2 & -0.053702 & -0.4892 & 0.312978 \tabularnewline
3 & -0.146798 & -1.3374 & 0.092374 \tabularnewline
4 & -0.371939 & -3.3885 & 0.000538 \tabularnewline
5 & 0.085342 & 0.7775 & 0.219536 \tabularnewline
6 & -0.185169 & -1.687 & 0.047682 \tabularnewline
7 & 0.195191 & 1.7783 & 0.03951 \tabularnewline
8 & -0.245612 & -2.2376 & 0.013962 \tabularnewline
9 & -0.244613 & -2.2285 & 0.014275 \tabularnewline
10 & -0.214076 & -1.9503 & 0.027257 \tabularnewline
11 & -0.289143 & -2.6342 & 0.005029 \tabularnewline
12 & 0.372189 & 3.3908 & 0.000535 \tabularnewline
13 & 0.064671 & 0.5892 & 0.278672 \tabularnewline
14 & -0.104625 & -0.9532 & 0.171633 \tabularnewline
15 & -0.07066 & -0.6437 & 0.260758 \tabularnewline
16 & -0.111605 & -1.0168 & 0.156109 \tabularnewline
17 & -0.09383 & -0.8548 & 0.197554 \tabularnewline
18 & -0.014568 & -0.1327 & 0.447366 \tabularnewline
19 & -0.023091 & -0.2104 & 0.416947 \tabularnewline
20 & -0.029555 & -0.2693 & 0.394201 \tabularnewline
21 & 0.009238 & 0.0842 & 0.466565 \tabularnewline
22 & -0.068083 & -0.6203 & 0.26839 \tabularnewline
23 & -0.01962 & -0.1787 & 0.429285 \tabularnewline
24 & 0.041318 & 0.3764 & 0.35378 \tabularnewline
25 & -0.008654 & -0.0788 & 0.468676 \tabularnewline
26 & -0.023419 & -0.2134 & 0.415786 \tabularnewline
27 & 0.036594 & 0.3334 & 0.369842 \tabularnewline
28 & 0.072283 & 0.6585 & 0.256011 \tabularnewline
29 & 0.03984 & 0.363 & 0.358779 \tabularnewline
30 & -0.029153 & -0.2656 & 0.395603 \tabularnewline
31 & -0.099313 & -0.9048 & 0.184098 \tabularnewline
32 & -0.094973 & -0.8652 & 0.194699 \tabularnewline
33 & -0.029626 & -0.2699 & 0.393951 \tabularnewline
34 & -0.022464 & -0.2047 & 0.419169 \tabularnewline
35 & -0.096546 & -0.8796 & 0.190815 \tabularnewline
36 & 0.095566 & 0.8706 & 0.19323 \tabularnewline
37 & 0.044011 & 0.401 & 0.344739 \tabularnewline
38 & -0.004291 & -0.0391 & 0.484455 \tabularnewline
39 & 0.007881 & 0.0718 & 0.471468 \tabularnewline
40 & 0.120427 & 1.0971 & 0.137877 \tabularnewline
41 & 0.029611 & 0.2698 & 0.394003 \tabularnewline
42 & 0.088016 & 0.8019 & 0.212462 \tabularnewline
43 & 0.005508 & 0.0502 & 0.480051 \tabularnewline
44 & 0.082452 & 0.7512 & 0.227337 \tabularnewline
45 & 0.033335 & 0.3037 & 0.38106 \tabularnewline
46 & -0.099232 & -0.904 & 0.184294 \tabularnewline
47 & 0.118367 & 1.0784 & 0.141995 \tabularnewline
48 & -0.061532 & -0.5606 & 0.288296 \tabularnewline
\hline
\end{tabular}
%Source: https://freestatistics.org/blog/index.php?pk=243363&T=2

[TABLE]
[ROW][C]Partial Autocorrelation Function[/C][/ROW]
[ROW][C]Time lag k[/C][C]PACF(k)[/C][C]T-STAT[/C][C]P-value[/C][/ROW]
[ROW][C]1[/C][C]-0.295552[/C][C]-2.6926[/C][C]0.004287[/C][/ROW]
[ROW][C]2[/C][C]-0.053702[/C][C]-0.4892[/C][C]0.312978[/C][/ROW]
[ROW][C]3[/C][C]-0.146798[/C][C]-1.3374[/C][C]0.092374[/C][/ROW]
[ROW][C]4[/C][C]-0.371939[/C][C]-3.3885[/C][C]0.000538[/C][/ROW]
[ROW][C]5[/C][C]0.085342[/C][C]0.7775[/C][C]0.219536[/C][/ROW]
[ROW][C]6[/C][C]-0.185169[/C][C]-1.687[/C][C]0.047682[/C][/ROW]
[ROW][C]7[/C][C]0.195191[/C][C]1.7783[/C][C]0.03951[/C][/ROW]
[ROW][C]8[/C][C]-0.245612[/C][C]-2.2376[/C][C]0.013962[/C][/ROW]
[ROW][C]9[/C][C]-0.244613[/C][C]-2.2285[/C][C]0.014275[/C][/ROW]
[ROW][C]10[/C][C]-0.214076[/C][C]-1.9503[/C][C]0.027257[/C][/ROW]
[ROW][C]11[/C][C]-0.289143[/C][C]-2.6342[/C][C]0.005029[/C][/ROW]
[ROW][C]12[/C][C]0.372189[/C][C]3.3908[/C][C]0.000535[/C][/ROW]
[ROW][C]13[/C][C]0.064671[/C][C]0.5892[/C][C]0.278672[/C][/ROW]
[ROW][C]14[/C][C]-0.104625[/C][C]-0.9532[/C][C]0.171633[/C][/ROW]
[ROW][C]15[/C][C]-0.07066[/C][C]-0.6437[/C][C]0.260758[/C][/ROW]
[ROW][C]16[/C][C]-0.111605[/C][C]-1.0168[/C][C]0.156109[/C][/ROW]
[ROW][C]17[/C][C]-0.09383[/C][C]-0.8548[/C][C]0.197554[/C][/ROW]
[ROW][C]18[/C][C]-0.014568[/C][C]-0.1327[/C][C]0.447366[/C][/ROW]
[ROW][C]19[/C][C]-0.023091[/C][C]-0.2104[/C][C]0.416947[/C][/ROW]
[ROW][C]20[/C][C]-0.029555[/C][C]-0.2693[/C][C]0.394201[/C][/ROW]
[ROW][C]21[/C][C]0.009238[/C][C]0.0842[/C][C]0.466565[/C][/ROW]
[ROW][C]22[/C][C]-0.068083[/C][C]-0.6203[/C][C]0.26839[/C][/ROW]
[ROW][C]23[/C][C]-0.01962[/C][C]-0.1787[/C][C]0.429285[/C][/ROW]
[ROW][C]24[/C][C]0.041318[/C][C]0.3764[/C][C]0.35378[/C][/ROW]
[ROW][C]25[/C][C]-0.008654[/C][C]-0.0788[/C][C]0.468676[/C][/ROW]
[ROW][C]26[/C][C]-0.023419[/C][C]-0.2134[/C][C]0.415786[/C][/ROW]
[ROW][C]27[/C][C]0.036594[/C][C]0.3334[/C][C]0.369842[/C][/ROW]
[ROW][C]28[/C][C]0.072283[/C][C]0.6585[/C][C]0.256011[/C][/ROW]
[ROW][C]29[/C][C]0.03984[/C][C]0.363[/C][C]0.358779[/C][/ROW]
[ROW][C]30[/C][C]-0.029153[/C][C]-0.2656[/C][C]0.395603[/C][/ROW]
[ROW][C]31[/C][C]-0.099313[/C][C]-0.9048[/C][C]0.184098[/C][/ROW]
[ROW][C]32[/C][C]-0.094973[/C][C]-0.8652[/C][C]0.194699[/C][/ROW]
[ROW][C]33[/C][C]-0.029626[/C][C]-0.2699[/C][C]0.393951[/C][/ROW]
[ROW][C]34[/C][C]-0.022464[/C][C]-0.2047[/C][C]0.419169[/C][/ROW]
[ROW][C]35[/C][C]-0.096546[/C][C]-0.8796[/C][C]0.190815[/C][/ROW]
[ROW][C]36[/C][C]0.095566[/C][C]0.8706[/C][C]0.19323[/C][/ROW]
[ROW][C]37[/C][C]0.044011[/C][C]0.401[/C][C]0.344739[/C][/ROW]
[ROW][C]38[/C][C]-0.004291[/C][C]-0.0391[/C][C]0.484455[/C][/ROW]
[ROW][C]39[/C][C]0.007881[/C][C]0.0718[/C][C]0.471468[/C][/ROW]
[ROW][C]40[/C][C]0.120427[/C][C]1.0971[/C][C]0.137877[/C][/ROW]
[ROW][C]41[/C][C]0.029611[/C][C]0.2698[/C][C]0.394003[/C][/ROW]
[ROW][C]42[/C][C]0.088016[/C][C]0.8019[/C][C]0.212462[/C][/ROW]
[ROW][C]43[/C][C]0.005508[/C][C]0.0502[/C][C]0.480051[/C][/ROW]
[ROW][C]44[/C][C]0.082452[/C][C]0.7512[/C][C]0.227337[/C][/ROW]
[ROW][C]45[/C][C]0.033335[/C][C]0.3037[/C][C]0.38106[/C][/ROW]
[ROW][C]46[/C][C]-0.099232[/C][C]-0.904[/C][C]0.184294[/C][/ROW]
[ROW][C]47[/C][C]0.118367[/C][C]1.0784[/C][C]0.141995[/C][/ROW]
[ROW][C]48[/C][C]-0.061532[/C][C]-0.5606[/C][C]0.288296[/C][/ROW]
[/TABLE]
Source: https://freestatistics.org/blog/index.php?pk=243363&T=2

Globally Unique Identifier (entire table): ba.freestatistics.org/blog/index.php?pk=243363&T=2

As an alternative you can also use a QR Code:  

The GUIDs for individual cells are displayed in the table below:

Partial Autocorrelation Function
Time lag kPACF(k)T-STATP-value
1-0.295552-2.69260.004287
2-0.053702-0.48920.312978
3-0.146798-1.33740.092374
4-0.371939-3.38850.000538
50.0853420.77750.219536
6-0.185169-1.6870.047682
70.1951911.77830.03951
8-0.245612-2.23760.013962
9-0.244613-2.22850.014275
10-0.214076-1.95030.027257
11-0.289143-2.63420.005029
120.3721893.39080.000535
130.0646710.58920.278672
14-0.104625-0.95320.171633
15-0.07066-0.64370.260758
16-0.111605-1.01680.156109
17-0.09383-0.85480.197554
18-0.014568-0.13270.447366
19-0.023091-0.21040.416947
20-0.029555-0.26930.394201
210.0092380.08420.466565
22-0.068083-0.62030.26839
23-0.01962-0.17870.429285
240.0413180.37640.35378
25-0.008654-0.07880.468676
26-0.023419-0.21340.415786
270.0365940.33340.369842
280.0722830.65850.256011
290.039840.3630.358779
30-0.029153-0.26560.395603
31-0.099313-0.90480.184098
32-0.094973-0.86520.194699
33-0.029626-0.26990.393951
34-0.022464-0.20470.419169
35-0.096546-0.87960.190815
360.0955660.87060.19323
370.0440110.4010.344739
38-0.004291-0.03910.484455
390.0078810.07180.471468
400.1204271.09710.137877
410.0296110.26980.394003
420.0880160.80190.212462
430.0055080.05020.480051
440.0824520.75120.227337
450.0333350.30370.38106
46-0.099232-0.9040.184294
470.1183671.07840.141995
48-0.061532-0.56060.288296


Parameters (Session):
par1 = 48 ; par2 = 1 ; par3 = 1 ; par4 = 0 ; par5 = 12 ; par6 = White Noise ; par7 = 0.95 ;
Parameters (R input):
par1 = 48 ; par2 = 1 ; par3 = 1 ; par4 = 0 ; par5 = 12 ; par6 = White Noise ; par7 = 0.95 ; par8 = ;
R code (references can be found in the software module):
par8 <- ''
par7 <- '0.95'
par6 <- 'White Noise'
par5 <- '12'
par4 <- '0'
par3 <- '0'
par2 <- '1'
par1 <- '48'
if (par1 == 'Default') {
par1 = 10*log10(length(x))
} else {
par1 <- as.numeric(par1)
}
par2 <- as.numeric(par2)
par3 <- as.numeric(par3)
par4 <- as.numeric(par4)
par5 <- as.numeric(par5)
if (par6 == 'White Noise') par6 <- 'white' else par6 <- 'ma'
par7 <- as.numeric(par7)
if (par8 != '') par8 <- as.numeric(par8)
ox <- x
if (par8 == '') {
if (par2 == 0) {
x <- log(x)
} else {
x <- (x ^ par2 - 1) / par2
}
} else {
x <- log(x,base=par8)
}
if (par3 > 0) x <- diff(x,lag=1,difference=par3)
if (par4 > 0) x <- diff(x,lag=par5,difference=par4)
bitmap(file='picts.png')
op <- par(mfrow=c(2,1))
plot(ox,type='l',main='Original Time Series',xlab='time',ylab='value')
if (par8=='') {
mytitle <- paste('Working Time Series (lambda=',par2,', d=',par3,', D=',par4,')',sep='')
mysub <- paste('(lambda=',par2,', d=',par3,', D=',par4,', CI=', par7, ', CI type=',par6,')',sep='')
} else {
mytitle <- paste('Working Time Series (base=',par8,', d=',par3,', D=',par4,')',sep='')
mysub <- paste('(base=',par8,', d=',par3,', D=',par4,', CI=', par7, ', CI type=',par6,')',sep='')
}
plot(x,type='l', main=mytitle,xlab='time',ylab='value')
par(op)
dev.off()
bitmap(file='pic1.png')
racf <- acf(x, par1, main='Autocorrelation', xlab='time lag', ylab='ACF', ci.type=par6, ci=par7, sub=mysub)
dev.off()
bitmap(file='pic2.png')
rpacf <- pacf(x,par1,main='Partial Autocorrelation',xlab='lags',ylab='PACF',sub=mysub)
dev.off()
(myacf <- c(racf$acf))
(mypacf <- c(rpacf$acf))
lengthx <- length(x)
sqrtn <- sqrt(lengthx)
load(file='createtable')
a<-table.start()
a<-table.row.start(a)
a<-table.element(a,'Autocorrelation Function',4,TRUE)
a<-table.row.end(a)
a<-table.row.start(a)
a<-table.element(a,'Time lag k',header=TRUE)
a<-table.element(a,hyperlink('basics.htm','ACF(k)','click here for more information about the Autocorrelation Function'),header=TRUE)
a<-table.element(a,'T-STAT',header=TRUE)
a<-table.element(a,'P-value',header=TRUE)
a<-table.row.end(a)
for (i in 2:(par1+1)) {
a<-table.row.start(a)
a<-table.element(a,i-1,header=TRUE)
a<-table.element(a,round(myacf[i],6))
mytstat <- myacf[i]*sqrtn
a<-table.element(a,round(mytstat,4))
a<-table.element(a,round(1-pt(abs(mytstat),lengthx),6))
a<-table.row.end(a)
}
a<-table.end(a)
table.save(a,file='mytable.tab')
a<-table.start()
a<-table.row.start(a)
a<-table.element(a,'Partial Autocorrelation Function',4,TRUE)
a<-table.row.end(a)
a<-table.row.start(a)
a<-table.element(a,'Time lag k',header=TRUE)
a<-table.element(a,hyperlink('basics.htm','PACF(k)','click here for more information about the Partial Autocorrelation Function'),header=TRUE)
a<-table.element(a,'T-STAT',header=TRUE)
a<-table.element(a,'P-value',header=TRUE)
a<-table.row.end(a)
for (i in 1:par1) {
a<-table.row.start(a)
a<-table.element(a,i,header=TRUE)
a<-table.element(a,round(mypacf[i],6))
mytstat <- mypacf[i]*sqrtn
a<-table.element(a,round(mytstat,4))
a<-table.element(a,round(1-pt(abs(mytstat),lengthx),6))
a<-table.row.end(a)
}
a<-table.end(a)
table.save(a,file='mytable1.tab')