Free Statistics

of Irreproducible Research!

Author's title

Author*Unverified author*
R Software Modulerwasp_autocorrelation.wasp
Title produced by software(Partial) Autocorrelation Function
Date of computationFri, 17 Oct 2014 18:33:36 +0100
Cite this page as followsStatistical Computations at FreeStatistics.org, Office for Research Development and Education, URL https://freestatistics.org/blog/index.php?v=date/2014/Oct/17/t1413567244wo4cun8d9691ior.htm/, Retrieved Fri, 10 May 2024 11:40:47 +0000
Statistical Computations at FreeStatistics.org, Office for Research Development and Education, URL https://freestatistics.org/blog/index.php?pk=243362, Retrieved Fri, 10 May 2024 11:40:47 +0000
QR Codes:

Original text written by user:
IsPrivate?No (this computation is public)
User-defined keywords
Estimated Impact71
Family? (F = Feedback message, R = changed R code, M = changed R Module, P = changed Parameters, D = changed Data)
-       [(Partial) Autocorrelation Function] [] [2014-10-17 17:33:36] [397b699eae6f3431a51b0bb18afa5c27] [Current]
Feedback Forum

Post a new message
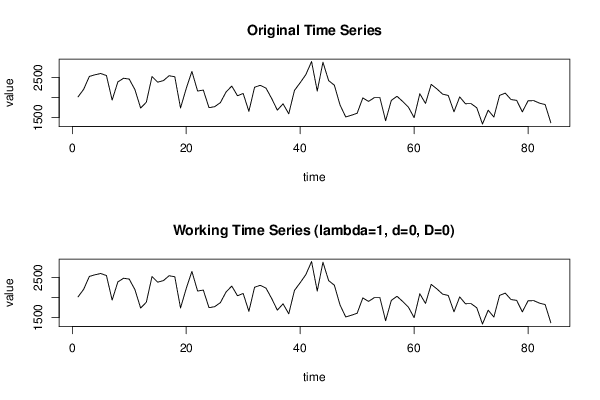
Dataseries X:
2011
2203
2523
2565
2596
2545
1935
2386
2478
2457
2194
1736
1881
2520
2381
2419
2541
2514
1737
2221
2648
2159
2184
1745
1770
1871
2137
2283
2042
2099
1653
2254
2302
2233
1974
1684
1842
1592
2175
2366
2569
2894
2159
2877
2419
2305
1812
1514
1557
1606
1988
1901
1993
1993
1420
1927
2029
1899
1759
1496
2091
1850
2326
2212
2083
2048
1642
2014
1844
1846
1743
1337
1682
1512
2050
2108
1948
1927
1641
1916
1921
1858
1823
1367


Summary of computational transaction
Raw Inputview raw input (R code)
Raw Outputview raw output of R engine
Computing time1 seconds
R Server'Herman Ole Andreas Wold' @ wold.wessa.net

\begin{tabular}{lllllllll}
\hline
Summary of computational transaction \tabularnewline
Raw Input & view raw input (R code)  \tabularnewline
Raw Output & view raw output of R engine  \tabularnewline
Computing time & 1 seconds \tabularnewline
R Server & 'Herman Ole Andreas Wold' @ wold.wessa.net \tabularnewline
\hline
\end{tabular}
%Source: https://freestatistics.org/blog/index.php?pk=243362&T=0

[TABLE]
[ROW][C]Summary of computational transaction[/C][/ROW]
[ROW][C]Raw Input[/C][C]view raw input (R code) [/C][/ROW]
[ROW][C]Raw Output[/C][C]view raw output of R engine [/C][/ROW]
[ROW][C]Computing time[/C][C]1 seconds[/C][/ROW]
[ROW][C]R Server[/C][C]'Herman Ole Andreas Wold' @ wold.wessa.net[/C][/ROW]
[/TABLE]
Source: https://freestatistics.org/blog/index.php?pk=243362&T=0

Globally Unique Identifier (entire table): ba.freestatistics.org/blog/index.php?pk=243362&T=0

As an alternative you can also use a QR Code:  

The GUIDs for individual cells are displayed in the table below:

Summary of computational transaction
Raw Inputview raw input (R code)
Raw Outputview raw output of R engine
Computing time1 seconds
R Server'Herman Ole Andreas Wold' @ wold.wessa.net


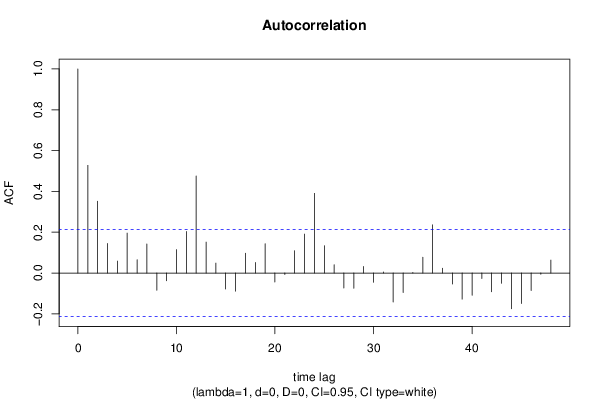
Autocorrelation Function
Time lag kACF(k)T-STATP-value
10.5275794.83533e-06
20.3520443.22650.000893
30.1450341.32930.093682
40.0583690.5350.297045
50.1955721.79240.038331
60.0648370.59420.276974
70.1423371.30450.097807
8-0.084445-0.7740.220566
9-0.037925-0.34760.364509
100.11471.05120.148081
110.2032191.86250.033012
120.4757874.36071.8e-05
130.151491.38840.084339
140.0484930.44440.328932
15-0.078382-0.71840.237256
16-0.088959-0.81530.208597
170.0970590.88960.188121
180.0514620.47170.319197
190.1435411.31560.095948
20-0.044489-0.40770.342249
21-0.007342-0.06730.473254
220.1094391.0030.159366
230.1905681.74660.042182
240.3904023.57810.000289
250.1334621.22320.112337
260.0409220.37510.354283
27-0.073262-0.67150.251885
28-0.074682-0.68450.24778
290.0319570.29290.385162
30-0.045039-0.41280.340405
310.005160.04730.481198
32-0.141739-1.29910.098738
33-0.095668-0.87680.191544
340.0027570.02530.48995
350.0775190.71050.239689
360.2362.1630.016693
370.0235850.21620.414693
38-0.053614-0.49140.312218
39-0.127949-1.17270.122122
40-0.108675-0.9960.161049
41-0.027223-0.24950.401791
42-0.092101-0.84410.2005
43-0.050609-0.46380.321982
44-0.175426-1.60780.055815
45-0.149712-1.37210.086837
46-0.085345-0.78220.218148
47-0.006083-0.05570.477837
480.0632560.57970.281818

\begin{tabular}{lllllllll}
\hline
Autocorrelation Function \tabularnewline
Time lag k & ACF(k) & T-STAT & P-value \tabularnewline
1 & 0.527579 & 4.8353 & 3e-06 \tabularnewline
2 & 0.352044 & 3.2265 & 0.000893 \tabularnewline
3 & 0.145034 & 1.3293 & 0.093682 \tabularnewline
4 & 0.058369 & 0.535 & 0.297045 \tabularnewline
5 & 0.195572 & 1.7924 & 0.038331 \tabularnewline
6 & 0.064837 & 0.5942 & 0.276974 \tabularnewline
7 & 0.142337 & 1.3045 & 0.097807 \tabularnewline
8 & -0.084445 & -0.774 & 0.220566 \tabularnewline
9 & -0.037925 & -0.3476 & 0.364509 \tabularnewline
10 & 0.1147 & 1.0512 & 0.148081 \tabularnewline
11 & 0.203219 & 1.8625 & 0.033012 \tabularnewline
12 & 0.475787 & 4.3607 & 1.8e-05 \tabularnewline
13 & 0.15149 & 1.3884 & 0.084339 \tabularnewline
14 & 0.048493 & 0.4444 & 0.328932 \tabularnewline
15 & -0.078382 & -0.7184 & 0.237256 \tabularnewline
16 & -0.088959 & -0.8153 & 0.208597 \tabularnewline
17 & 0.097059 & 0.8896 & 0.188121 \tabularnewline
18 & 0.051462 & 0.4717 & 0.319197 \tabularnewline
19 & 0.143541 & 1.3156 & 0.095948 \tabularnewline
20 & -0.044489 & -0.4077 & 0.342249 \tabularnewline
21 & -0.007342 & -0.0673 & 0.473254 \tabularnewline
22 & 0.109439 & 1.003 & 0.159366 \tabularnewline
23 & 0.190568 & 1.7466 & 0.042182 \tabularnewline
24 & 0.390402 & 3.5781 & 0.000289 \tabularnewline
25 & 0.133462 & 1.2232 & 0.112337 \tabularnewline
26 & 0.040922 & 0.3751 & 0.354283 \tabularnewline
27 & -0.073262 & -0.6715 & 0.251885 \tabularnewline
28 & -0.074682 & -0.6845 & 0.24778 \tabularnewline
29 & 0.031957 & 0.2929 & 0.385162 \tabularnewline
30 & -0.045039 & -0.4128 & 0.340405 \tabularnewline
31 & 0.00516 & 0.0473 & 0.481198 \tabularnewline
32 & -0.141739 & -1.2991 & 0.098738 \tabularnewline
33 & -0.095668 & -0.8768 & 0.191544 \tabularnewline
34 & 0.002757 & 0.0253 & 0.48995 \tabularnewline
35 & 0.077519 & 0.7105 & 0.239689 \tabularnewline
36 & 0.236 & 2.163 & 0.016693 \tabularnewline
37 & 0.023585 & 0.2162 & 0.414693 \tabularnewline
38 & -0.053614 & -0.4914 & 0.312218 \tabularnewline
39 & -0.127949 & -1.1727 & 0.122122 \tabularnewline
40 & -0.108675 & -0.996 & 0.161049 \tabularnewline
41 & -0.027223 & -0.2495 & 0.401791 \tabularnewline
42 & -0.092101 & -0.8441 & 0.2005 \tabularnewline
43 & -0.050609 & -0.4638 & 0.321982 \tabularnewline
44 & -0.175426 & -1.6078 & 0.055815 \tabularnewline
45 & -0.149712 & -1.3721 & 0.086837 \tabularnewline
46 & -0.085345 & -0.7822 & 0.218148 \tabularnewline
47 & -0.006083 & -0.0557 & 0.477837 \tabularnewline
48 & 0.063256 & 0.5797 & 0.281818 \tabularnewline
\hline
\end{tabular}
%Source: https://freestatistics.org/blog/index.php?pk=243362&T=1

[TABLE]
[ROW][C]Autocorrelation Function[/C][/ROW]
[ROW][C]Time lag k[/C][C]ACF(k)[/C][C]T-STAT[/C][C]P-value[/C][/ROW]
[ROW][C]1[/C][C]0.527579[/C][C]4.8353[/C][C]3e-06[/C][/ROW]
[ROW][C]2[/C][C]0.352044[/C][C]3.2265[/C][C]0.000893[/C][/ROW]
[ROW][C]3[/C][C]0.145034[/C][C]1.3293[/C][C]0.093682[/C][/ROW]
[ROW][C]4[/C][C]0.058369[/C][C]0.535[/C][C]0.297045[/C][/ROW]
[ROW][C]5[/C][C]0.195572[/C][C]1.7924[/C][C]0.038331[/C][/ROW]
[ROW][C]6[/C][C]0.064837[/C][C]0.5942[/C][C]0.276974[/C][/ROW]
[ROW][C]7[/C][C]0.142337[/C][C]1.3045[/C][C]0.097807[/C][/ROW]
[ROW][C]8[/C][C]-0.084445[/C][C]-0.774[/C][C]0.220566[/C][/ROW]
[ROW][C]9[/C][C]-0.037925[/C][C]-0.3476[/C][C]0.364509[/C][/ROW]
[ROW][C]10[/C][C]0.1147[/C][C]1.0512[/C][C]0.148081[/C][/ROW]
[ROW][C]11[/C][C]0.203219[/C][C]1.8625[/C][C]0.033012[/C][/ROW]
[ROW][C]12[/C][C]0.475787[/C][C]4.3607[/C][C]1.8e-05[/C][/ROW]
[ROW][C]13[/C][C]0.15149[/C][C]1.3884[/C][C]0.084339[/C][/ROW]
[ROW][C]14[/C][C]0.048493[/C][C]0.4444[/C][C]0.328932[/C][/ROW]
[ROW][C]15[/C][C]-0.078382[/C][C]-0.7184[/C][C]0.237256[/C][/ROW]
[ROW][C]16[/C][C]-0.088959[/C][C]-0.8153[/C][C]0.208597[/C][/ROW]
[ROW][C]17[/C][C]0.097059[/C][C]0.8896[/C][C]0.188121[/C][/ROW]
[ROW][C]18[/C][C]0.051462[/C][C]0.4717[/C][C]0.319197[/C][/ROW]
[ROW][C]19[/C][C]0.143541[/C][C]1.3156[/C][C]0.095948[/C][/ROW]
[ROW][C]20[/C][C]-0.044489[/C][C]-0.4077[/C][C]0.342249[/C][/ROW]
[ROW][C]21[/C][C]-0.007342[/C][C]-0.0673[/C][C]0.473254[/C][/ROW]
[ROW][C]22[/C][C]0.109439[/C][C]1.003[/C][C]0.159366[/C][/ROW]
[ROW][C]23[/C][C]0.190568[/C][C]1.7466[/C][C]0.042182[/C][/ROW]
[ROW][C]24[/C][C]0.390402[/C][C]3.5781[/C][C]0.000289[/C][/ROW]
[ROW][C]25[/C][C]0.133462[/C][C]1.2232[/C][C]0.112337[/C][/ROW]
[ROW][C]26[/C][C]0.040922[/C][C]0.3751[/C][C]0.354283[/C][/ROW]
[ROW][C]27[/C][C]-0.073262[/C][C]-0.6715[/C][C]0.251885[/C][/ROW]
[ROW][C]28[/C][C]-0.074682[/C][C]-0.6845[/C][C]0.24778[/C][/ROW]
[ROW][C]29[/C][C]0.031957[/C][C]0.2929[/C][C]0.385162[/C][/ROW]
[ROW][C]30[/C][C]-0.045039[/C][C]-0.4128[/C][C]0.340405[/C][/ROW]
[ROW][C]31[/C][C]0.00516[/C][C]0.0473[/C][C]0.481198[/C][/ROW]
[ROW][C]32[/C][C]-0.141739[/C][C]-1.2991[/C][C]0.098738[/C][/ROW]
[ROW][C]33[/C][C]-0.095668[/C][C]-0.8768[/C][C]0.191544[/C][/ROW]
[ROW][C]34[/C][C]0.002757[/C][C]0.0253[/C][C]0.48995[/C][/ROW]
[ROW][C]35[/C][C]0.077519[/C][C]0.7105[/C][C]0.239689[/C][/ROW]
[ROW][C]36[/C][C]0.236[/C][C]2.163[/C][C]0.016693[/C][/ROW]
[ROW][C]37[/C][C]0.023585[/C][C]0.2162[/C][C]0.414693[/C][/ROW]
[ROW][C]38[/C][C]-0.053614[/C][C]-0.4914[/C][C]0.312218[/C][/ROW]
[ROW][C]39[/C][C]-0.127949[/C][C]-1.1727[/C][C]0.122122[/C][/ROW]
[ROW][C]40[/C][C]-0.108675[/C][C]-0.996[/C][C]0.161049[/C][/ROW]
[ROW][C]41[/C][C]-0.027223[/C][C]-0.2495[/C][C]0.401791[/C][/ROW]
[ROW][C]42[/C][C]-0.092101[/C][C]-0.8441[/C][C]0.2005[/C][/ROW]
[ROW][C]43[/C][C]-0.050609[/C][C]-0.4638[/C][C]0.321982[/C][/ROW]
[ROW][C]44[/C][C]-0.175426[/C][C]-1.6078[/C][C]0.055815[/C][/ROW]
[ROW][C]45[/C][C]-0.149712[/C][C]-1.3721[/C][C]0.086837[/C][/ROW]
[ROW][C]46[/C][C]-0.085345[/C][C]-0.7822[/C][C]0.218148[/C][/ROW]
[ROW][C]47[/C][C]-0.006083[/C][C]-0.0557[/C][C]0.477837[/C][/ROW]
[ROW][C]48[/C][C]0.063256[/C][C]0.5797[/C][C]0.281818[/C][/ROW]
[/TABLE]
Source: https://freestatistics.org/blog/index.php?pk=243362&T=1

Globally Unique Identifier (entire table): ba.freestatistics.org/blog/index.php?pk=243362&T=1

As an alternative you can also use a QR Code:  

The GUIDs for individual cells are displayed in the table below:

Autocorrelation Function
Time lag kACF(k)T-STATP-value
10.5275794.83533e-06
20.3520443.22650.000893
30.1450341.32930.093682
40.0583690.5350.297045
50.1955721.79240.038331
60.0648370.59420.276974
70.1423371.30450.097807
8-0.084445-0.7740.220566
9-0.037925-0.34760.364509
100.11471.05120.148081
110.2032191.86250.033012
120.4757874.36071.8e-05
130.151491.38840.084339
140.0484930.44440.328932
15-0.078382-0.71840.237256
16-0.088959-0.81530.208597
170.0970590.88960.188121
180.0514620.47170.319197
190.1435411.31560.095948
20-0.044489-0.40770.342249
21-0.007342-0.06730.473254
220.1094391.0030.159366
230.1905681.74660.042182
240.3904023.57810.000289
250.1334621.22320.112337
260.0409220.37510.354283
27-0.073262-0.67150.251885
28-0.074682-0.68450.24778
290.0319570.29290.385162
30-0.045039-0.41280.340405
310.005160.04730.481198
32-0.141739-1.29910.098738
33-0.095668-0.87680.191544
340.0027570.02530.48995
350.0775190.71050.239689
360.2362.1630.016693
370.0235850.21620.414693
38-0.053614-0.49140.312218
39-0.127949-1.17270.122122
40-0.108675-0.9960.161049
41-0.027223-0.24950.401791
42-0.092101-0.84410.2005
43-0.050609-0.46380.321982
44-0.175426-1.60780.055815
45-0.149712-1.37210.086837
46-0.085345-0.78220.218148
47-0.006083-0.05570.477837
480.0632560.57970.281818


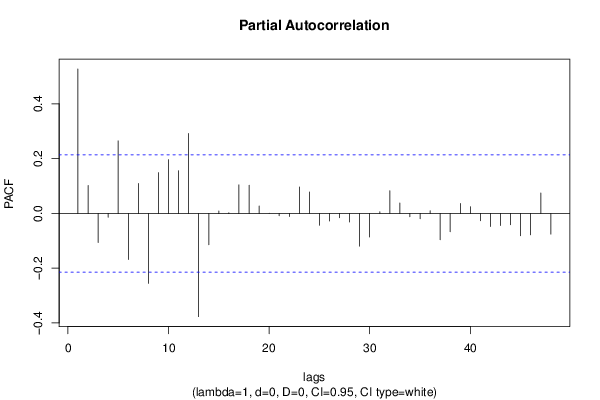
Partial Autocorrelation Function
Time lag kPACF(k)T-STATP-value
10.5275794.83533e-06
20.1021330.93610.175963
3-0.105879-0.97040.167318
4-0.013671-0.12530.450293
50.2650752.42950.008626
6-0.168372-1.54320.063276
70.1091020.99990.160106
8-0.255505-2.34170.010781
90.1490941.36650.087719
100.1964321.80030.037699
110.1556641.42670.078689
120.2919552.67580.00448
13-0.376844-3.45380.000434
14-0.114521-1.04960.148455
150.0086520.07930.468494
160.0027610.02530.489935
170.1042650.95560.171007
180.1028610.94270.174261
190.0270070.24750.402553
20-0.000114-0.0010.499585
21-0.008641-0.07920.468533
22-0.011362-0.10410.458655
230.096470.88420.189566
240.0782810.71750.237542
25-0.043234-0.39620.346464
26-0.027401-0.25110.40116
27-0.015903-0.14580.442232
28-0.03132-0.28710.387389
29-0.119276-1.09320.13872
30-0.085753-0.78590.217058
310.0060140.05510.478088
320.0826670.75770.225389
330.0380730.34890.364002
34-0.012041-0.11040.456193
35-0.019568-0.17930.429049
360.0099650.09130.463725
37-0.096162-0.88130.190325
38-0.066955-0.61370.270552
390.036680.33620.368787
400.0242170.2220.412444
41-0.026868-0.24620.403047
42-0.047696-0.43710.331565
43-0.044283-0.40590.342937
44-0.041527-0.38060.35223
45-0.081632-0.74820.228223
46-0.078173-0.71650.237845
470.0745530.68330.248152
48-0.075622-0.69310.245084

\begin{tabular}{lllllllll}
\hline
Partial Autocorrelation Function \tabularnewline
Time lag k & PACF(k) & T-STAT & P-value \tabularnewline
1 & 0.527579 & 4.8353 & 3e-06 \tabularnewline
2 & 0.102133 & 0.9361 & 0.175963 \tabularnewline
3 & -0.105879 & -0.9704 & 0.167318 \tabularnewline
4 & -0.013671 & -0.1253 & 0.450293 \tabularnewline
5 & 0.265075 & 2.4295 & 0.008626 \tabularnewline
6 & -0.168372 & -1.5432 & 0.063276 \tabularnewline
7 & 0.109102 & 0.9999 & 0.160106 \tabularnewline
8 & -0.255505 & -2.3417 & 0.010781 \tabularnewline
9 & 0.149094 & 1.3665 & 0.087719 \tabularnewline
10 & 0.196432 & 1.8003 & 0.037699 \tabularnewline
11 & 0.155664 & 1.4267 & 0.078689 \tabularnewline
12 & 0.291955 & 2.6758 & 0.00448 \tabularnewline
13 & -0.376844 & -3.4538 & 0.000434 \tabularnewline
14 & -0.114521 & -1.0496 & 0.148455 \tabularnewline
15 & 0.008652 & 0.0793 & 0.468494 \tabularnewline
16 & 0.002761 & 0.0253 & 0.489935 \tabularnewline
17 & 0.104265 & 0.9556 & 0.171007 \tabularnewline
18 & 0.102861 & 0.9427 & 0.174261 \tabularnewline
19 & 0.027007 & 0.2475 & 0.402553 \tabularnewline
20 & -0.000114 & -0.001 & 0.499585 \tabularnewline
21 & -0.008641 & -0.0792 & 0.468533 \tabularnewline
22 & -0.011362 & -0.1041 & 0.458655 \tabularnewline
23 & 0.09647 & 0.8842 & 0.189566 \tabularnewline
24 & 0.078281 & 0.7175 & 0.237542 \tabularnewline
25 & -0.043234 & -0.3962 & 0.346464 \tabularnewline
26 & -0.027401 & -0.2511 & 0.40116 \tabularnewline
27 & -0.015903 & -0.1458 & 0.442232 \tabularnewline
28 & -0.03132 & -0.2871 & 0.387389 \tabularnewline
29 & -0.119276 & -1.0932 & 0.13872 \tabularnewline
30 & -0.085753 & -0.7859 & 0.217058 \tabularnewline
31 & 0.006014 & 0.0551 & 0.478088 \tabularnewline
32 & 0.082667 & 0.7577 & 0.225389 \tabularnewline
33 & 0.038073 & 0.3489 & 0.364002 \tabularnewline
34 & -0.012041 & -0.1104 & 0.456193 \tabularnewline
35 & -0.019568 & -0.1793 & 0.429049 \tabularnewline
36 & 0.009965 & 0.0913 & 0.463725 \tabularnewline
37 & -0.096162 & -0.8813 & 0.190325 \tabularnewline
38 & -0.066955 & -0.6137 & 0.270552 \tabularnewline
39 & 0.03668 & 0.3362 & 0.368787 \tabularnewline
40 & 0.024217 & 0.222 & 0.412444 \tabularnewline
41 & -0.026868 & -0.2462 & 0.403047 \tabularnewline
42 & -0.047696 & -0.4371 & 0.331565 \tabularnewline
43 & -0.044283 & -0.4059 & 0.342937 \tabularnewline
44 & -0.041527 & -0.3806 & 0.35223 \tabularnewline
45 & -0.081632 & -0.7482 & 0.228223 \tabularnewline
46 & -0.078173 & -0.7165 & 0.237845 \tabularnewline
47 & 0.074553 & 0.6833 & 0.248152 \tabularnewline
48 & -0.075622 & -0.6931 & 0.245084 \tabularnewline
\hline
\end{tabular}
%Source: https://freestatistics.org/blog/index.php?pk=243362&T=2

[TABLE]
[ROW][C]Partial Autocorrelation Function[/C][/ROW]
[ROW][C]Time lag k[/C][C]PACF(k)[/C][C]T-STAT[/C][C]P-value[/C][/ROW]
[ROW][C]1[/C][C]0.527579[/C][C]4.8353[/C][C]3e-06[/C][/ROW]
[ROW][C]2[/C][C]0.102133[/C][C]0.9361[/C][C]0.175963[/C][/ROW]
[ROW][C]3[/C][C]-0.105879[/C][C]-0.9704[/C][C]0.167318[/C][/ROW]
[ROW][C]4[/C][C]-0.013671[/C][C]-0.1253[/C][C]0.450293[/C][/ROW]
[ROW][C]5[/C][C]0.265075[/C][C]2.4295[/C][C]0.008626[/C][/ROW]
[ROW][C]6[/C][C]-0.168372[/C][C]-1.5432[/C][C]0.063276[/C][/ROW]
[ROW][C]7[/C][C]0.109102[/C][C]0.9999[/C][C]0.160106[/C][/ROW]
[ROW][C]8[/C][C]-0.255505[/C][C]-2.3417[/C][C]0.010781[/C][/ROW]
[ROW][C]9[/C][C]0.149094[/C][C]1.3665[/C][C]0.087719[/C][/ROW]
[ROW][C]10[/C][C]0.196432[/C][C]1.8003[/C][C]0.037699[/C][/ROW]
[ROW][C]11[/C][C]0.155664[/C][C]1.4267[/C][C]0.078689[/C][/ROW]
[ROW][C]12[/C][C]0.291955[/C][C]2.6758[/C][C]0.00448[/C][/ROW]
[ROW][C]13[/C][C]-0.376844[/C][C]-3.4538[/C][C]0.000434[/C][/ROW]
[ROW][C]14[/C][C]-0.114521[/C][C]-1.0496[/C][C]0.148455[/C][/ROW]
[ROW][C]15[/C][C]0.008652[/C][C]0.0793[/C][C]0.468494[/C][/ROW]
[ROW][C]16[/C][C]0.002761[/C][C]0.0253[/C][C]0.489935[/C][/ROW]
[ROW][C]17[/C][C]0.104265[/C][C]0.9556[/C][C]0.171007[/C][/ROW]
[ROW][C]18[/C][C]0.102861[/C][C]0.9427[/C][C]0.174261[/C][/ROW]
[ROW][C]19[/C][C]0.027007[/C][C]0.2475[/C][C]0.402553[/C][/ROW]
[ROW][C]20[/C][C]-0.000114[/C][C]-0.001[/C][C]0.499585[/C][/ROW]
[ROW][C]21[/C][C]-0.008641[/C][C]-0.0792[/C][C]0.468533[/C][/ROW]
[ROW][C]22[/C][C]-0.011362[/C][C]-0.1041[/C][C]0.458655[/C][/ROW]
[ROW][C]23[/C][C]0.09647[/C][C]0.8842[/C][C]0.189566[/C][/ROW]
[ROW][C]24[/C][C]0.078281[/C][C]0.7175[/C][C]0.237542[/C][/ROW]
[ROW][C]25[/C][C]-0.043234[/C][C]-0.3962[/C][C]0.346464[/C][/ROW]
[ROW][C]26[/C][C]-0.027401[/C][C]-0.2511[/C][C]0.40116[/C][/ROW]
[ROW][C]27[/C][C]-0.015903[/C][C]-0.1458[/C][C]0.442232[/C][/ROW]
[ROW][C]28[/C][C]-0.03132[/C][C]-0.2871[/C][C]0.387389[/C][/ROW]
[ROW][C]29[/C][C]-0.119276[/C][C]-1.0932[/C][C]0.13872[/C][/ROW]
[ROW][C]30[/C][C]-0.085753[/C][C]-0.7859[/C][C]0.217058[/C][/ROW]
[ROW][C]31[/C][C]0.006014[/C][C]0.0551[/C][C]0.478088[/C][/ROW]
[ROW][C]32[/C][C]0.082667[/C][C]0.7577[/C][C]0.225389[/C][/ROW]
[ROW][C]33[/C][C]0.038073[/C][C]0.3489[/C][C]0.364002[/C][/ROW]
[ROW][C]34[/C][C]-0.012041[/C][C]-0.1104[/C][C]0.456193[/C][/ROW]
[ROW][C]35[/C][C]-0.019568[/C][C]-0.1793[/C][C]0.429049[/C][/ROW]
[ROW][C]36[/C][C]0.009965[/C][C]0.0913[/C][C]0.463725[/C][/ROW]
[ROW][C]37[/C][C]-0.096162[/C][C]-0.8813[/C][C]0.190325[/C][/ROW]
[ROW][C]38[/C][C]-0.066955[/C][C]-0.6137[/C][C]0.270552[/C][/ROW]
[ROW][C]39[/C][C]0.03668[/C][C]0.3362[/C][C]0.368787[/C][/ROW]
[ROW][C]40[/C][C]0.024217[/C][C]0.222[/C][C]0.412444[/C][/ROW]
[ROW][C]41[/C][C]-0.026868[/C][C]-0.2462[/C][C]0.403047[/C][/ROW]
[ROW][C]42[/C][C]-0.047696[/C][C]-0.4371[/C][C]0.331565[/C][/ROW]
[ROW][C]43[/C][C]-0.044283[/C][C]-0.4059[/C][C]0.342937[/C][/ROW]
[ROW][C]44[/C][C]-0.041527[/C][C]-0.3806[/C][C]0.35223[/C][/ROW]
[ROW][C]45[/C][C]-0.081632[/C][C]-0.7482[/C][C]0.228223[/C][/ROW]
[ROW][C]46[/C][C]-0.078173[/C][C]-0.7165[/C][C]0.237845[/C][/ROW]
[ROW][C]47[/C][C]0.074553[/C][C]0.6833[/C][C]0.248152[/C][/ROW]
[ROW][C]48[/C][C]-0.075622[/C][C]-0.6931[/C][C]0.245084[/C][/ROW]
[/TABLE]
Source: https://freestatistics.org/blog/index.php?pk=243362&T=2

Globally Unique Identifier (entire table): ba.freestatistics.org/blog/index.php?pk=243362&T=2

As an alternative you can also use a QR Code:  

The GUIDs for individual cells are displayed in the table below:

Partial Autocorrelation Function
Time lag kPACF(k)T-STATP-value
10.5275794.83533e-06
20.1021330.93610.175963
3-0.105879-0.97040.167318
4-0.013671-0.12530.450293
50.2650752.42950.008626
6-0.168372-1.54320.063276
70.1091020.99990.160106
8-0.255505-2.34170.010781
90.1490941.36650.087719
100.1964321.80030.037699
110.1556641.42670.078689
120.2919552.67580.00448
13-0.376844-3.45380.000434
14-0.114521-1.04960.148455
150.0086520.07930.468494
160.0027610.02530.489935
170.1042650.95560.171007
180.1028610.94270.174261
190.0270070.24750.402553
20-0.000114-0.0010.499585
21-0.008641-0.07920.468533
22-0.011362-0.10410.458655
230.096470.88420.189566
240.0782810.71750.237542
25-0.043234-0.39620.346464
26-0.027401-0.25110.40116
27-0.015903-0.14580.442232
28-0.03132-0.28710.387389
29-0.119276-1.09320.13872
30-0.085753-0.78590.217058
310.0060140.05510.478088
320.0826670.75770.225389
330.0380730.34890.364002
34-0.012041-0.11040.456193
35-0.019568-0.17930.429049
360.0099650.09130.463725
37-0.096162-0.88130.190325
38-0.066955-0.61370.270552
390.036680.33620.368787
400.0242170.2220.412444
41-0.026868-0.24620.403047
42-0.047696-0.43710.331565
43-0.044283-0.40590.342937
44-0.041527-0.38060.35223
45-0.081632-0.74820.228223
46-0.078173-0.71650.237845
470.0745530.68330.248152
48-0.075622-0.69310.245084


Parameters (Session):
par1 = 48 ; par2 = 1 ; par3 = 0 ; par4 = 0 ; par5 = 12 ; par6 = White Noise ; par7 = 0.95 ;
Parameters (R input):
par1 = 48 ; par2 = 1 ; par3 = 0 ; par4 = 0 ; par5 = 12 ; par6 = White Noise ; par7 = 0.95 ; par8 = ;
R code (references can be found in the software module):
par8 <- ''
par7 <- '0.95'
par6 <- 'White Noise'
par5 <- '12'
par4 <- '0'
par3 <- '1'
par2 <- '1'
par1 <- '48'
if (par1 == 'Default') {
par1 = 10*log10(length(x))
} else {
par1 <- as.numeric(par1)
}
par2 <- as.numeric(par2)
par3 <- as.numeric(par3)
par4 <- as.numeric(par4)
par5 <- as.numeric(par5)
if (par6 == 'White Noise') par6 <- 'white' else par6 <- 'ma'
par7 <- as.numeric(par7)
if (par8 != '') par8 <- as.numeric(par8)
ox <- x
if (par8 == '') {
if (par2 == 0) {
x <- log(x)
} else {
x <- (x ^ par2 - 1) / par2
}
} else {
x <- log(x,base=par8)
}
if (par3 > 0) x <- diff(x,lag=1,difference=par3)
if (par4 > 0) x <- diff(x,lag=par5,difference=par4)
bitmap(file='picts.png')
op <- par(mfrow=c(2,1))
plot(ox,type='l',main='Original Time Series',xlab='time',ylab='value')
if (par8=='') {
mytitle <- paste('Working Time Series (lambda=',par2,', d=',par3,', D=',par4,')',sep='')
mysub <- paste('(lambda=',par2,', d=',par3,', D=',par4,', CI=', par7, ', CI type=',par6,')',sep='')
} else {
mytitle <- paste('Working Time Series (base=',par8,', d=',par3,', D=',par4,')',sep='')
mysub <- paste('(base=',par8,', d=',par3,', D=',par4,', CI=', par7, ', CI type=',par6,')',sep='')
}
plot(x,type='l', main=mytitle,xlab='time',ylab='value')
par(op)
dev.off()
bitmap(file='pic1.png')
racf <- acf(x, par1, main='Autocorrelation', xlab='time lag', ylab='ACF', ci.type=par6, ci=par7, sub=mysub)
dev.off()
bitmap(file='pic2.png')
rpacf <- pacf(x,par1,main='Partial Autocorrelation',xlab='lags',ylab='PACF',sub=mysub)
dev.off()
(myacf <- c(racf$acf))
(mypacf <- c(rpacf$acf))
lengthx <- length(x)
sqrtn <- sqrt(lengthx)
load(file='createtable')
a<-table.start()
a<-table.row.start(a)
a<-table.element(a,'Autocorrelation Function',4,TRUE)
a<-table.row.end(a)
a<-table.row.start(a)
a<-table.element(a,'Time lag k',header=TRUE)
a<-table.element(a,hyperlink('basics.htm','ACF(k)','click here for more information about the Autocorrelation Function'),header=TRUE)
a<-table.element(a,'T-STAT',header=TRUE)
a<-table.element(a,'P-value',header=TRUE)
a<-table.row.end(a)
for (i in 2:(par1+1)) {
a<-table.row.start(a)
a<-table.element(a,i-1,header=TRUE)
a<-table.element(a,round(myacf[i],6))
mytstat <- myacf[i]*sqrtn
a<-table.element(a,round(mytstat,4))
a<-table.element(a,round(1-pt(abs(mytstat),lengthx),6))
a<-table.row.end(a)
}
a<-table.end(a)
table.save(a,file='mytable.tab')
a<-table.start()
a<-table.row.start(a)
a<-table.element(a,'Partial Autocorrelation Function',4,TRUE)
a<-table.row.end(a)
a<-table.row.start(a)
a<-table.element(a,'Time lag k',header=TRUE)
a<-table.element(a,hyperlink('basics.htm','PACF(k)','click here for more information about the Partial Autocorrelation Function'),header=TRUE)
a<-table.element(a,'T-STAT',header=TRUE)
a<-table.element(a,'P-value',header=TRUE)
a<-table.row.end(a)
for (i in 1:par1) {
a<-table.row.start(a)
a<-table.element(a,i,header=TRUE)
a<-table.element(a,round(mypacf[i],6))
mytstat <- mypacf[i]*sqrtn
a<-table.element(a,round(mytstat,4))
a<-table.element(a,round(1-pt(abs(mytstat),lengthx),6))
a<-table.row.end(a)
}
a<-table.end(a)
table.save(a,file='mytable1.tab')