Free Statistics

of Irreproducible Research!

Author's title

Author*Unverified author*
R Software Modulerwasp_autocorrelation.wasp
Title produced by software(Partial) Autocorrelation Function
Date of computationFri, 17 Oct 2014 14:24:02 +0100
Cite this page as followsStatistical Computations at FreeStatistics.org, Office for Research Development and Education, URL https://freestatistics.org/blog/index.php?v=date/2014/Oct/17/t1413552256ac9ku51kiwyaw23.htm/, Retrieved Fri, 10 May 2024 21:41:55 +0000
Statistical Computations at FreeStatistics.org, Office for Research Development and Education, URL https://freestatistics.org/blog/index.php?pk=243288, Retrieved Fri, 10 May 2024 21:41:55 +0000
QR Codes:

Original text written by user:
IsPrivate?No (this computation is public)
User-defined keywords
Estimated Impact77
Family? (F = Feedback message, R = changed R code, M = changed R Module, P = changed Parameters, D = changed Data)
-       [(Partial) Autocorrelation Function] [] [2014-10-17 13:24:02] [dfd11b28041a8e54be4091fbe3743b64] [Current]
Feedback Forum

Post a new message
Dataseries X:
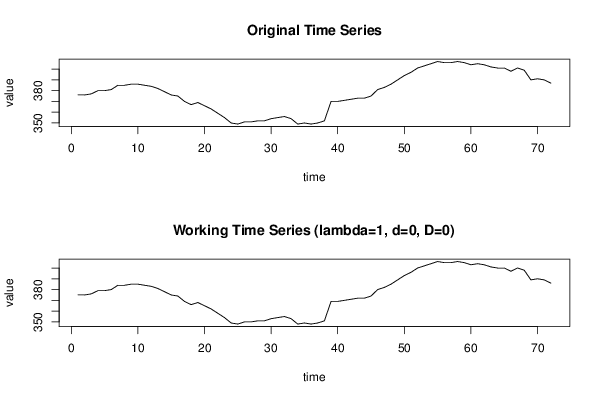
376
376
377
380
380
381
385
385
386
386
385
384
382
379
376
375
370
367
369
366
363
359
355
350
349
351
351
352
352
354
355
356
354
349
350
349
350
352
370
370
371
372
373
373
375
381
383
386
390
394
397
401
403
405
407
406
406
407
406
404
405
404
402
401
401
398
401
399
390
391
390
387


Summary of computational transaction
Raw Inputview raw input (R code)
Raw Outputview raw output of R engine
Computing time1 seconds
R Server'George Udny Yule' @ yule.wessa.net

\begin{tabular}{lllllllll}
\hline
Summary of computational transaction \tabularnewline
Raw Input & view raw input (R code)  \tabularnewline
Raw Output & view raw output of R engine  \tabularnewline
Computing time & 1 seconds \tabularnewline
R Server & 'George Udny Yule' @ yule.wessa.net \tabularnewline
\hline
\end{tabular}
%Source: https://freestatistics.org/blog/index.php?pk=243288&T=0

[TABLE]
[ROW][C]Summary of computational transaction[/C][/ROW]
[ROW][C]Raw Input[/C][C]view raw input (R code) [/C][/ROW]
[ROW][C]Raw Output[/C][C]view raw output of R engine [/C][/ROW]
[ROW][C]Computing time[/C][C]1 seconds[/C][/ROW]
[ROW][C]R Server[/C][C]'George Udny Yule' @ yule.wessa.net[/C][/ROW]
[/TABLE]
Source: https://freestatistics.org/blog/index.php?pk=243288&T=0

Globally Unique Identifier (entire table): ba.freestatistics.org/blog/index.php?pk=243288&T=0

As an alternative you can also use a QR Code:  

The GUIDs for individual cells are displayed in the table below:

Summary of computational transaction
Raw Inputview raw input (R code)
Raw Outputview raw output of R engine
Computing time1 seconds
R Server'George Udny Yule' @ yule.wessa.net


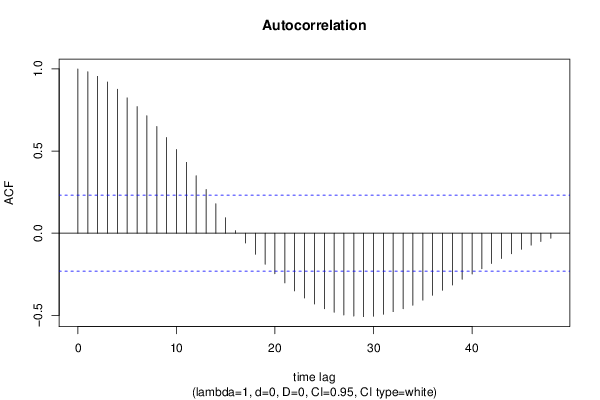
Autocorrelation Function
Time lag kACF(k)T-STATP-value
10.9826918.33840
20.9550468.10380
30.9200727.80710
40.8763327.43590
50.8237766.990
60.7708636.5410
70.7147456.06480
80.6499675.51520
90.5829424.94642e-06
100.5092384.3212.4e-05
110.4310123.65730.000241
120.3495932.96640.002043
130.2658582.25590.013558
140.1786631.5160.066948
150.0943270.80040.213058
160.0156040.13240.447516
17-0.059742-0.50690.306877
18-0.127999-1.08610.140528
19-0.18963-1.60910.055989
20-0.247486-2.10.019617
21-0.302843-2.56970.006124
22-0.351473-2.98240.001951
23-0.394387-3.34650.000652
24-0.431359-3.66020.000239
25-0.460524-3.90770.000104
26-0.482173-4.09145.5e-05
27-0.49805-4.22613.4e-05
28-0.505042-4.28542.8e-05
29-0.508417-4.31412.5e-05
30-0.50631-4.29622.7e-05
31-0.494185-4.19333.9e-05
32-0.477749-4.05386.3e-05
33-0.460238-3.90520.000105
34-0.438752-3.72290.000194
35-0.407869-3.46090.000455
36-0.378265-3.20970.000993
37-0.347982-2.95270.002125
38-0.315823-2.67980.004562
39-0.280766-2.38240.009922
40-0.248248-2.10650.019325
41-0.216367-1.83590.035248
42-0.184526-1.56580.060895
43-0.15484-1.31390.096532
44-0.125528-1.06510.145186
45-0.097798-0.82980.204686
46-0.073045-0.61980.268672
47-0.05135-0.43570.332171
48-0.031225-0.2650.3959

\begin{tabular}{lllllllll}
\hline
Autocorrelation Function \tabularnewline
Time lag k & ACF(k) & T-STAT & P-value \tabularnewline
1 & 0.982691 & 8.3384 & 0 \tabularnewline
2 & 0.955046 & 8.1038 & 0 \tabularnewline
3 & 0.920072 & 7.8071 & 0 \tabularnewline
4 & 0.876332 & 7.4359 & 0 \tabularnewline
5 & 0.823776 & 6.99 & 0 \tabularnewline
6 & 0.770863 & 6.541 & 0 \tabularnewline
7 & 0.714745 & 6.0648 & 0 \tabularnewline
8 & 0.649967 & 5.5152 & 0 \tabularnewline
9 & 0.582942 & 4.9464 & 2e-06 \tabularnewline
10 & 0.509238 & 4.321 & 2.4e-05 \tabularnewline
11 & 0.431012 & 3.6573 & 0.000241 \tabularnewline
12 & 0.349593 & 2.9664 & 0.002043 \tabularnewline
13 & 0.265858 & 2.2559 & 0.013558 \tabularnewline
14 & 0.178663 & 1.516 & 0.066948 \tabularnewline
15 & 0.094327 & 0.8004 & 0.213058 \tabularnewline
16 & 0.015604 & 0.1324 & 0.447516 \tabularnewline
17 & -0.059742 & -0.5069 & 0.306877 \tabularnewline
18 & -0.127999 & -1.0861 & 0.140528 \tabularnewline
19 & -0.18963 & -1.6091 & 0.055989 \tabularnewline
20 & -0.247486 & -2.1 & 0.019617 \tabularnewline
21 & -0.302843 & -2.5697 & 0.006124 \tabularnewline
22 & -0.351473 & -2.9824 & 0.001951 \tabularnewline
23 & -0.394387 & -3.3465 & 0.000652 \tabularnewline
24 & -0.431359 & -3.6602 & 0.000239 \tabularnewline
25 & -0.460524 & -3.9077 & 0.000104 \tabularnewline
26 & -0.482173 & -4.0914 & 5.5e-05 \tabularnewline
27 & -0.49805 & -4.2261 & 3.4e-05 \tabularnewline
28 & -0.505042 & -4.2854 & 2.8e-05 \tabularnewline
29 & -0.508417 & -4.3141 & 2.5e-05 \tabularnewline
30 & -0.50631 & -4.2962 & 2.7e-05 \tabularnewline
31 & -0.494185 & -4.1933 & 3.9e-05 \tabularnewline
32 & -0.477749 & -4.0538 & 6.3e-05 \tabularnewline
33 & -0.460238 & -3.9052 & 0.000105 \tabularnewline
34 & -0.438752 & -3.7229 & 0.000194 \tabularnewline
35 & -0.407869 & -3.4609 & 0.000455 \tabularnewline
36 & -0.378265 & -3.2097 & 0.000993 \tabularnewline
37 & -0.347982 & -2.9527 & 0.002125 \tabularnewline
38 & -0.315823 & -2.6798 & 0.004562 \tabularnewline
39 & -0.280766 & -2.3824 & 0.009922 \tabularnewline
40 & -0.248248 & -2.1065 & 0.019325 \tabularnewline
41 & -0.216367 & -1.8359 & 0.035248 \tabularnewline
42 & -0.184526 & -1.5658 & 0.060895 \tabularnewline
43 & -0.15484 & -1.3139 & 0.096532 \tabularnewline
44 & -0.125528 & -1.0651 & 0.145186 \tabularnewline
45 & -0.097798 & -0.8298 & 0.204686 \tabularnewline
46 & -0.073045 & -0.6198 & 0.268672 \tabularnewline
47 & -0.05135 & -0.4357 & 0.332171 \tabularnewline
48 & -0.031225 & -0.265 & 0.3959 \tabularnewline
\hline
\end{tabular}
%Source: https://freestatistics.org/blog/index.php?pk=243288&T=1

[TABLE]
[ROW][C]Autocorrelation Function[/C][/ROW]
[ROW][C]Time lag k[/C][C]ACF(k)[/C][C]T-STAT[/C][C]P-value[/C][/ROW]
[ROW][C]1[/C][C]0.982691[/C][C]8.3384[/C][C]0[/C][/ROW]
[ROW][C]2[/C][C]0.955046[/C][C]8.1038[/C][C]0[/C][/ROW]
[ROW][C]3[/C][C]0.920072[/C][C]7.8071[/C][C]0[/C][/ROW]
[ROW][C]4[/C][C]0.876332[/C][C]7.4359[/C][C]0[/C][/ROW]
[ROW][C]5[/C][C]0.823776[/C][C]6.99[/C][C]0[/C][/ROW]
[ROW][C]6[/C][C]0.770863[/C][C]6.541[/C][C]0[/C][/ROW]
[ROW][C]7[/C][C]0.714745[/C][C]6.0648[/C][C]0[/C][/ROW]
[ROW][C]8[/C][C]0.649967[/C][C]5.5152[/C][C]0[/C][/ROW]
[ROW][C]9[/C][C]0.582942[/C][C]4.9464[/C][C]2e-06[/C][/ROW]
[ROW][C]10[/C][C]0.509238[/C][C]4.321[/C][C]2.4e-05[/C][/ROW]
[ROW][C]11[/C][C]0.431012[/C][C]3.6573[/C][C]0.000241[/C][/ROW]
[ROW][C]12[/C][C]0.349593[/C][C]2.9664[/C][C]0.002043[/C][/ROW]
[ROW][C]13[/C][C]0.265858[/C][C]2.2559[/C][C]0.013558[/C][/ROW]
[ROW][C]14[/C][C]0.178663[/C][C]1.516[/C][C]0.066948[/C][/ROW]
[ROW][C]15[/C][C]0.094327[/C][C]0.8004[/C][C]0.213058[/C][/ROW]
[ROW][C]16[/C][C]0.015604[/C][C]0.1324[/C][C]0.447516[/C][/ROW]
[ROW][C]17[/C][C]-0.059742[/C][C]-0.5069[/C][C]0.306877[/C][/ROW]
[ROW][C]18[/C][C]-0.127999[/C][C]-1.0861[/C][C]0.140528[/C][/ROW]
[ROW][C]19[/C][C]-0.18963[/C][C]-1.6091[/C][C]0.055989[/C][/ROW]
[ROW][C]20[/C][C]-0.247486[/C][C]-2.1[/C][C]0.019617[/C][/ROW]
[ROW][C]21[/C][C]-0.302843[/C][C]-2.5697[/C][C]0.006124[/C][/ROW]
[ROW][C]22[/C][C]-0.351473[/C][C]-2.9824[/C][C]0.001951[/C][/ROW]
[ROW][C]23[/C][C]-0.394387[/C][C]-3.3465[/C][C]0.000652[/C][/ROW]
[ROW][C]24[/C][C]-0.431359[/C][C]-3.6602[/C][C]0.000239[/C][/ROW]
[ROW][C]25[/C][C]-0.460524[/C][C]-3.9077[/C][C]0.000104[/C][/ROW]
[ROW][C]26[/C][C]-0.482173[/C][C]-4.0914[/C][C]5.5e-05[/C][/ROW]
[ROW][C]27[/C][C]-0.49805[/C][C]-4.2261[/C][C]3.4e-05[/C][/ROW]
[ROW][C]28[/C][C]-0.505042[/C][C]-4.2854[/C][C]2.8e-05[/C][/ROW]
[ROW][C]29[/C][C]-0.508417[/C][C]-4.3141[/C][C]2.5e-05[/C][/ROW]
[ROW][C]30[/C][C]-0.50631[/C][C]-4.2962[/C][C]2.7e-05[/C][/ROW]
[ROW][C]31[/C][C]-0.494185[/C][C]-4.1933[/C][C]3.9e-05[/C][/ROW]
[ROW][C]32[/C][C]-0.477749[/C][C]-4.0538[/C][C]6.3e-05[/C][/ROW]
[ROW][C]33[/C][C]-0.460238[/C][C]-3.9052[/C][C]0.000105[/C][/ROW]
[ROW][C]34[/C][C]-0.438752[/C][C]-3.7229[/C][C]0.000194[/C][/ROW]
[ROW][C]35[/C][C]-0.407869[/C][C]-3.4609[/C][C]0.000455[/C][/ROW]
[ROW][C]36[/C][C]-0.378265[/C][C]-3.2097[/C][C]0.000993[/C][/ROW]
[ROW][C]37[/C][C]-0.347982[/C][C]-2.9527[/C][C]0.002125[/C][/ROW]
[ROW][C]38[/C][C]-0.315823[/C][C]-2.6798[/C][C]0.004562[/C][/ROW]
[ROW][C]39[/C][C]-0.280766[/C][C]-2.3824[/C][C]0.009922[/C][/ROW]
[ROW][C]40[/C][C]-0.248248[/C][C]-2.1065[/C][C]0.019325[/C][/ROW]
[ROW][C]41[/C][C]-0.216367[/C][C]-1.8359[/C][C]0.035248[/C][/ROW]
[ROW][C]42[/C][C]-0.184526[/C][C]-1.5658[/C][C]0.060895[/C][/ROW]
[ROW][C]43[/C][C]-0.15484[/C][C]-1.3139[/C][C]0.096532[/C][/ROW]
[ROW][C]44[/C][C]-0.125528[/C][C]-1.0651[/C][C]0.145186[/C][/ROW]
[ROW][C]45[/C][C]-0.097798[/C][C]-0.8298[/C][C]0.204686[/C][/ROW]
[ROW][C]46[/C][C]-0.073045[/C][C]-0.6198[/C][C]0.268672[/C][/ROW]
[ROW][C]47[/C][C]-0.05135[/C][C]-0.4357[/C][C]0.332171[/C][/ROW]
[ROW][C]48[/C][C]-0.031225[/C][C]-0.265[/C][C]0.3959[/C][/ROW]
[/TABLE]
Source: https://freestatistics.org/blog/index.php?pk=243288&T=1

Globally Unique Identifier (entire table): ba.freestatistics.org/blog/index.php?pk=243288&T=1

As an alternative you can also use a QR Code:  

The GUIDs for individual cells are displayed in the table below:

Autocorrelation Function
Time lag kACF(k)T-STATP-value
10.9826918.33840
20.9550468.10380
30.9200727.80710
40.8763327.43590
50.8237766.990
60.7708636.5410
70.7147456.06480
80.6499675.51520
90.5829424.94642e-06
100.5092384.3212.4e-05
110.4310123.65730.000241
120.3495932.96640.002043
130.2658582.25590.013558
140.1786631.5160.066948
150.0943270.80040.213058
160.0156040.13240.447516
17-0.059742-0.50690.306877
18-0.127999-1.08610.140528
19-0.18963-1.60910.055989
20-0.247486-2.10.019617
21-0.302843-2.56970.006124
22-0.351473-2.98240.001951
23-0.394387-3.34650.000652
24-0.431359-3.66020.000239
25-0.460524-3.90770.000104
26-0.482173-4.09145.5e-05
27-0.49805-4.22613.4e-05
28-0.505042-4.28542.8e-05
29-0.508417-4.31412.5e-05
30-0.50631-4.29622.7e-05
31-0.494185-4.19333.9e-05
32-0.477749-4.05386.3e-05
33-0.460238-3.90520.000105
34-0.438752-3.72290.000194
35-0.407869-3.46090.000455
36-0.378265-3.20970.000993
37-0.347982-2.95270.002125
38-0.315823-2.67980.004562
39-0.280766-2.38240.009922
40-0.248248-2.10650.019325
41-0.216367-1.83590.035248
42-0.184526-1.56580.060895
43-0.15484-1.31390.096532
44-0.125528-1.06510.145186
45-0.097798-0.82980.204686
46-0.073045-0.61980.268672
47-0.05135-0.43570.332171
48-0.031225-0.2650.3959


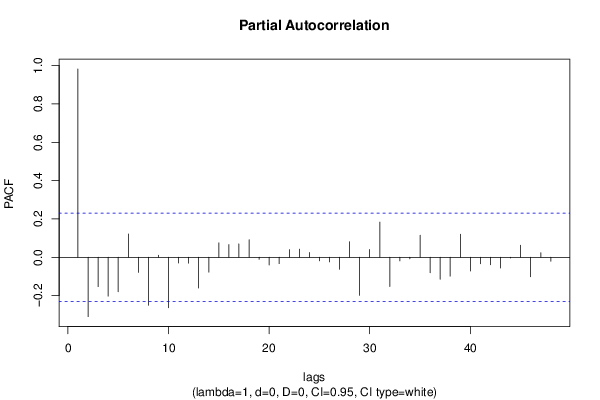
Partial Autocorrelation Function
Time lag kPACF(k)T-STATP-value
10.9826918.33840
2-0.309883-2.62940.005225
3-0.153215-1.30010.098861
4-0.202945-1.7220.044677
5-0.179796-1.52560.065743
60.1212791.02910.153442
7-0.078776-0.66840.252997
8-0.250472-2.12530.018496
90.0101940.08650.465655
10-0.263096-2.23240.014348
11-0.029642-0.25150.401065
12-0.030747-0.26090.39746
13-0.160794-1.36440.088348
14-0.077608-0.65850.25615
150.0752490.63850.262584
160.0659710.55980.288682
170.0697670.5920.277855
180.0918410.77930.219179
19-0.010881-0.09230.463346
20-0.040036-0.33970.36753
21-0.03321-0.28180.389453
220.039990.33930.367677
230.0423380.35930.360228
240.024860.21090.416762
25-0.018674-0.15850.437271
26-0.024148-0.20490.419114
27-0.062626-0.53140.29839
280.0811710.68880.246595
29-0.198773-1.68660.048
300.0408320.34650.364999
310.1832771.55520.062147
32-0.152881-1.29720.099346
33-0.019053-0.16170.436009
34-0.008248-0.070.472197
350.1150520.97630.166104
36-0.08073-0.6850.247768
37-0.114327-0.97010.167623
38-0.098361-0.83460.203345
390.1205661.0230.154857
40-0.071933-0.61040.271768
41-0.034286-0.29090.385972
42-0.039045-0.33130.370689
43-0.055842-0.47380.318525
44-0.004314-0.03660.485452
450.0628050.53290.297866
46-0.101994-0.86540.194834
470.0232670.19740.422025
48-0.020896-0.17730.429881

\begin{tabular}{lllllllll}
\hline
Partial Autocorrelation Function \tabularnewline
Time lag k & PACF(k) & T-STAT & P-value \tabularnewline
1 & 0.982691 & 8.3384 & 0 \tabularnewline
2 & -0.309883 & -2.6294 & 0.005225 \tabularnewline
3 & -0.153215 & -1.3001 & 0.098861 \tabularnewline
4 & -0.202945 & -1.722 & 0.044677 \tabularnewline
5 & -0.179796 & -1.5256 & 0.065743 \tabularnewline
6 & 0.121279 & 1.0291 & 0.153442 \tabularnewline
7 & -0.078776 & -0.6684 & 0.252997 \tabularnewline
8 & -0.250472 & -2.1253 & 0.018496 \tabularnewline
9 & 0.010194 & 0.0865 & 0.465655 \tabularnewline
10 & -0.263096 & -2.2324 & 0.014348 \tabularnewline
11 & -0.029642 & -0.2515 & 0.401065 \tabularnewline
12 & -0.030747 & -0.2609 & 0.39746 \tabularnewline
13 & -0.160794 & -1.3644 & 0.088348 \tabularnewline
14 & -0.077608 & -0.6585 & 0.25615 \tabularnewline
15 & 0.075249 & 0.6385 & 0.262584 \tabularnewline
16 & 0.065971 & 0.5598 & 0.288682 \tabularnewline
17 & 0.069767 & 0.592 & 0.277855 \tabularnewline
18 & 0.091841 & 0.7793 & 0.219179 \tabularnewline
19 & -0.010881 & -0.0923 & 0.463346 \tabularnewline
20 & -0.040036 & -0.3397 & 0.36753 \tabularnewline
21 & -0.03321 & -0.2818 & 0.389453 \tabularnewline
22 & 0.03999 & 0.3393 & 0.367677 \tabularnewline
23 & 0.042338 & 0.3593 & 0.360228 \tabularnewline
24 & 0.02486 & 0.2109 & 0.416762 \tabularnewline
25 & -0.018674 & -0.1585 & 0.437271 \tabularnewline
26 & -0.024148 & -0.2049 & 0.419114 \tabularnewline
27 & -0.062626 & -0.5314 & 0.29839 \tabularnewline
28 & 0.081171 & 0.6888 & 0.246595 \tabularnewline
29 & -0.198773 & -1.6866 & 0.048 \tabularnewline
30 & 0.040832 & 0.3465 & 0.364999 \tabularnewline
31 & 0.183277 & 1.5552 & 0.062147 \tabularnewline
32 & -0.152881 & -1.2972 & 0.099346 \tabularnewline
33 & -0.019053 & -0.1617 & 0.436009 \tabularnewline
34 & -0.008248 & -0.07 & 0.472197 \tabularnewline
35 & 0.115052 & 0.9763 & 0.166104 \tabularnewline
36 & -0.08073 & -0.685 & 0.247768 \tabularnewline
37 & -0.114327 & -0.9701 & 0.167623 \tabularnewline
38 & -0.098361 & -0.8346 & 0.203345 \tabularnewline
39 & 0.120566 & 1.023 & 0.154857 \tabularnewline
40 & -0.071933 & -0.6104 & 0.271768 \tabularnewline
41 & -0.034286 & -0.2909 & 0.385972 \tabularnewline
42 & -0.039045 & -0.3313 & 0.370689 \tabularnewline
43 & -0.055842 & -0.4738 & 0.318525 \tabularnewline
44 & -0.004314 & -0.0366 & 0.485452 \tabularnewline
45 & 0.062805 & 0.5329 & 0.297866 \tabularnewline
46 & -0.101994 & -0.8654 & 0.194834 \tabularnewline
47 & 0.023267 & 0.1974 & 0.422025 \tabularnewline
48 & -0.020896 & -0.1773 & 0.429881 \tabularnewline
\hline
\end{tabular}
%Source: https://freestatistics.org/blog/index.php?pk=243288&T=2

[TABLE]
[ROW][C]Partial Autocorrelation Function[/C][/ROW]
[ROW][C]Time lag k[/C][C]PACF(k)[/C][C]T-STAT[/C][C]P-value[/C][/ROW]
[ROW][C]1[/C][C]0.982691[/C][C]8.3384[/C][C]0[/C][/ROW]
[ROW][C]2[/C][C]-0.309883[/C][C]-2.6294[/C][C]0.005225[/C][/ROW]
[ROW][C]3[/C][C]-0.153215[/C][C]-1.3001[/C][C]0.098861[/C][/ROW]
[ROW][C]4[/C][C]-0.202945[/C][C]-1.722[/C][C]0.044677[/C][/ROW]
[ROW][C]5[/C][C]-0.179796[/C][C]-1.5256[/C][C]0.065743[/C][/ROW]
[ROW][C]6[/C][C]0.121279[/C][C]1.0291[/C][C]0.153442[/C][/ROW]
[ROW][C]7[/C][C]-0.078776[/C][C]-0.6684[/C][C]0.252997[/C][/ROW]
[ROW][C]8[/C][C]-0.250472[/C][C]-2.1253[/C][C]0.018496[/C][/ROW]
[ROW][C]9[/C][C]0.010194[/C][C]0.0865[/C][C]0.465655[/C][/ROW]
[ROW][C]10[/C][C]-0.263096[/C][C]-2.2324[/C][C]0.014348[/C][/ROW]
[ROW][C]11[/C][C]-0.029642[/C][C]-0.2515[/C][C]0.401065[/C][/ROW]
[ROW][C]12[/C][C]-0.030747[/C][C]-0.2609[/C][C]0.39746[/C][/ROW]
[ROW][C]13[/C][C]-0.160794[/C][C]-1.3644[/C][C]0.088348[/C][/ROW]
[ROW][C]14[/C][C]-0.077608[/C][C]-0.6585[/C][C]0.25615[/C][/ROW]
[ROW][C]15[/C][C]0.075249[/C][C]0.6385[/C][C]0.262584[/C][/ROW]
[ROW][C]16[/C][C]0.065971[/C][C]0.5598[/C][C]0.288682[/C][/ROW]
[ROW][C]17[/C][C]0.069767[/C][C]0.592[/C][C]0.277855[/C][/ROW]
[ROW][C]18[/C][C]0.091841[/C][C]0.7793[/C][C]0.219179[/C][/ROW]
[ROW][C]19[/C][C]-0.010881[/C][C]-0.0923[/C][C]0.463346[/C][/ROW]
[ROW][C]20[/C][C]-0.040036[/C][C]-0.3397[/C][C]0.36753[/C][/ROW]
[ROW][C]21[/C][C]-0.03321[/C][C]-0.2818[/C][C]0.389453[/C][/ROW]
[ROW][C]22[/C][C]0.03999[/C][C]0.3393[/C][C]0.367677[/C][/ROW]
[ROW][C]23[/C][C]0.042338[/C][C]0.3593[/C][C]0.360228[/C][/ROW]
[ROW][C]24[/C][C]0.02486[/C][C]0.2109[/C][C]0.416762[/C][/ROW]
[ROW][C]25[/C][C]-0.018674[/C][C]-0.1585[/C][C]0.437271[/C][/ROW]
[ROW][C]26[/C][C]-0.024148[/C][C]-0.2049[/C][C]0.419114[/C][/ROW]
[ROW][C]27[/C][C]-0.062626[/C][C]-0.5314[/C][C]0.29839[/C][/ROW]
[ROW][C]28[/C][C]0.081171[/C][C]0.6888[/C][C]0.246595[/C][/ROW]
[ROW][C]29[/C][C]-0.198773[/C][C]-1.6866[/C][C]0.048[/C][/ROW]
[ROW][C]30[/C][C]0.040832[/C][C]0.3465[/C][C]0.364999[/C][/ROW]
[ROW][C]31[/C][C]0.183277[/C][C]1.5552[/C][C]0.062147[/C][/ROW]
[ROW][C]32[/C][C]-0.152881[/C][C]-1.2972[/C][C]0.099346[/C][/ROW]
[ROW][C]33[/C][C]-0.019053[/C][C]-0.1617[/C][C]0.436009[/C][/ROW]
[ROW][C]34[/C][C]-0.008248[/C][C]-0.07[/C][C]0.472197[/C][/ROW]
[ROW][C]35[/C][C]0.115052[/C][C]0.9763[/C][C]0.166104[/C][/ROW]
[ROW][C]36[/C][C]-0.08073[/C][C]-0.685[/C][C]0.247768[/C][/ROW]
[ROW][C]37[/C][C]-0.114327[/C][C]-0.9701[/C][C]0.167623[/C][/ROW]
[ROW][C]38[/C][C]-0.098361[/C][C]-0.8346[/C][C]0.203345[/C][/ROW]
[ROW][C]39[/C][C]0.120566[/C][C]1.023[/C][C]0.154857[/C][/ROW]
[ROW][C]40[/C][C]-0.071933[/C][C]-0.6104[/C][C]0.271768[/C][/ROW]
[ROW][C]41[/C][C]-0.034286[/C][C]-0.2909[/C][C]0.385972[/C][/ROW]
[ROW][C]42[/C][C]-0.039045[/C][C]-0.3313[/C][C]0.370689[/C][/ROW]
[ROW][C]43[/C][C]-0.055842[/C][C]-0.4738[/C][C]0.318525[/C][/ROW]
[ROW][C]44[/C][C]-0.004314[/C][C]-0.0366[/C][C]0.485452[/C][/ROW]
[ROW][C]45[/C][C]0.062805[/C][C]0.5329[/C][C]0.297866[/C][/ROW]
[ROW][C]46[/C][C]-0.101994[/C][C]-0.8654[/C][C]0.194834[/C][/ROW]
[ROW][C]47[/C][C]0.023267[/C][C]0.1974[/C][C]0.422025[/C][/ROW]
[ROW][C]48[/C][C]-0.020896[/C][C]-0.1773[/C][C]0.429881[/C][/ROW]
[/TABLE]
Source: https://freestatistics.org/blog/index.php?pk=243288&T=2

Globally Unique Identifier (entire table): ba.freestatistics.org/blog/index.php?pk=243288&T=2

As an alternative you can also use a QR Code:  

The GUIDs for individual cells are displayed in the table below:

Partial Autocorrelation Function
Time lag kPACF(k)T-STATP-value
10.9826918.33840
2-0.309883-2.62940.005225
3-0.153215-1.30010.098861
4-0.202945-1.7220.044677
5-0.179796-1.52560.065743
60.1212791.02910.153442
7-0.078776-0.66840.252997
8-0.250472-2.12530.018496
90.0101940.08650.465655
10-0.263096-2.23240.014348
11-0.029642-0.25150.401065
12-0.030747-0.26090.39746
13-0.160794-1.36440.088348
14-0.077608-0.65850.25615
150.0752490.63850.262584
160.0659710.55980.288682
170.0697670.5920.277855
180.0918410.77930.219179
19-0.010881-0.09230.463346
20-0.040036-0.33970.36753
21-0.03321-0.28180.389453
220.039990.33930.367677
230.0423380.35930.360228
240.024860.21090.416762
25-0.018674-0.15850.437271
26-0.024148-0.20490.419114
27-0.062626-0.53140.29839
280.0811710.68880.246595
29-0.198773-1.68660.048
300.0408320.34650.364999
310.1832771.55520.062147
32-0.152881-1.29720.099346
33-0.019053-0.16170.436009
34-0.008248-0.070.472197
350.1150520.97630.166104
36-0.08073-0.6850.247768
37-0.114327-0.97010.167623
38-0.098361-0.83460.203345
390.1205661.0230.154857
40-0.071933-0.61040.271768
41-0.034286-0.29090.385972
42-0.039045-0.33130.370689
43-0.055842-0.47380.318525
44-0.004314-0.03660.485452
450.0628050.53290.297866
46-0.101994-0.86540.194834
470.0232670.19740.422025
48-0.020896-0.17730.429881


Parameters (Session):
par1 = 48 ; par2 = 1 ; par3 = 0 ; par4 = 0 ; par5 = 12 ; par6 = White Noise ; par7 = 0.95 ;
Parameters (R input):
par1 = 48 ; par2 = 1 ; par3 = 0 ; par4 = 0 ; par5 = 12 ; par6 = White Noise ; par7 = 0.95 ; par8 = ;
R code (references can be found in the software module):
par8 <- ''
par7 <- '0.95'
par6 <- 'White Noise'
par5 <- '12'
par4 <- '0'
par3 <- '0'
par2 <- '1'
par1 <- '48'
if (par1 == 'Default') {
par1 = 10*log10(length(x))
} else {
par1 <- as.numeric(par1)
}
par2 <- as.numeric(par2)
par3 <- as.numeric(par3)
par4 <- as.numeric(par4)
par5 <- as.numeric(par5)
if (par6 == 'White Noise') par6 <- 'white' else par6 <- 'ma'
par7 <- as.numeric(par7)
if (par8 != '') par8 <- as.numeric(par8)
ox <- x
if (par8 == '') {
if (par2 == 0) {
x <- log(x)
} else {
x <- (x ^ par2 - 1) / par2
}
} else {
x <- log(x,base=par8)
}
if (par3 > 0) x <- diff(x,lag=1,difference=par3)
if (par4 > 0) x <- diff(x,lag=par5,difference=par4)
bitmap(file='picts.png')
op <- par(mfrow=c(2,1))
plot(ox,type='l',main='Original Time Series',xlab='time',ylab='value')
if (par8=='') {
mytitle <- paste('Working Time Series (lambda=',par2,', d=',par3,', D=',par4,')',sep='')
mysub <- paste('(lambda=',par2,', d=',par3,', D=',par4,', CI=', par7, ', CI type=',par6,')',sep='')
} else {
mytitle <- paste('Working Time Series (base=',par8,', d=',par3,', D=',par4,')',sep='')
mysub <- paste('(base=',par8,', d=',par3,', D=',par4,', CI=', par7, ', CI type=',par6,')',sep='')
}
plot(x,type='l', main=mytitle,xlab='time',ylab='value')
par(op)
dev.off()
bitmap(file='pic1.png')
racf <- acf(x, par1, main='Autocorrelation', xlab='time lag', ylab='ACF', ci.type=par6, ci=par7, sub=mysub)
dev.off()
bitmap(file='pic2.png')
rpacf <- pacf(x,par1,main='Partial Autocorrelation',xlab='lags',ylab='PACF',sub=mysub)
dev.off()
(myacf <- c(racf$acf))
(mypacf <- c(rpacf$acf))
lengthx <- length(x)
sqrtn <- sqrt(lengthx)
load(file='createtable')
a<-table.start()
a<-table.row.start(a)
a<-table.element(a,'Autocorrelation Function',4,TRUE)
a<-table.row.end(a)
a<-table.row.start(a)
a<-table.element(a,'Time lag k',header=TRUE)
a<-table.element(a,hyperlink('basics.htm','ACF(k)','click here for more information about the Autocorrelation Function'),header=TRUE)
a<-table.element(a,'T-STAT',header=TRUE)
a<-table.element(a,'P-value',header=TRUE)
a<-table.row.end(a)
for (i in 2:(par1+1)) {
a<-table.row.start(a)
a<-table.element(a,i-1,header=TRUE)
a<-table.element(a,round(myacf[i],6))
mytstat <- myacf[i]*sqrtn
a<-table.element(a,round(mytstat,4))
a<-table.element(a,round(1-pt(abs(mytstat),lengthx),6))
a<-table.row.end(a)
}
a<-table.end(a)
table.save(a,file='mytable.tab')
a<-table.start()
a<-table.row.start(a)
a<-table.element(a,'Partial Autocorrelation Function',4,TRUE)
a<-table.row.end(a)
a<-table.row.start(a)
a<-table.element(a,'Time lag k',header=TRUE)
a<-table.element(a,hyperlink('basics.htm','PACF(k)','click here for more information about the Partial Autocorrelation Function'),header=TRUE)
a<-table.element(a,'T-STAT',header=TRUE)
a<-table.element(a,'P-value',header=TRUE)
a<-table.row.end(a)
for (i in 1:par1) {
a<-table.row.start(a)
a<-table.element(a,i,header=TRUE)
a<-table.element(a,round(mypacf[i],6))
mytstat <- mypacf[i]*sqrtn
a<-table.element(a,round(mytstat,4))
a<-table.element(a,round(1-pt(abs(mytstat),lengthx),6))
a<-table.row.end(a)
}
a<-table.end(a)
table.save(a,file='mytable1.tab')