Free Statistics

of Irreproducible Research!

Author's title

Author*Unverified author*
R Software Modulerwasp_autocorrelation.wasp
Title produced by software(Partial) Autocorrelation Function
Date of computationFri, 17 Oct 2014 14:15:24 +0100
Cite this page as followsStatistical Computations at FreeStatistics.org, Office for Research Development and Education, URL https://freestatistics.org/blog/index.php?v=date/2014/Oct/17/t1413551759x2hru3x0oe2wr06.htm/, Retrieved Fri, 10 May 2024 14:05:49 +0000
Statistical Computations at FreeStatistics.org, Office for Research Development and Education, URL https://freestatistics.org/blog/index.php?pk=243278, Retrieved Fri, 10 May 2024 14:05:49 +0000
QR Codes:

Original text written by user:
IsPrivate?No (this computation is public)
User-defined keywords
Estimated Impact63
Family? (F = Feedback message, R = changed R code, M = changed R Module, P = changed Parameters, D = changed Data)
-       [(Partial) Autocorrelation Function] [] [2014-10-17 13:15:24] [d4b037465b17855a5e62fa4428b30753] [Current]
Feedback Forum

Post a new message
Dataseries X:
1,464
1,474
1,479
1,517
1,575
1,627
1,613
1,558
1,545
1,406
1,269
1,191
1,231
1,276
1,281
1,312
1,363
1,419
1,374
1,422
1,378
1,38
1,409
1,398
1,445
1,452
1,506
1,531
1,524
1,52
1,499
1,491
1,496
1,493
1,507
1,569
1,593
1,597
1,633
1,686
1,683
1,646
1,658
1,636
1,67
1,634
1,618
1,622
1,688
1,723
1,776
1,809
1,754
1,714
1,733
1,783
1,818
1,81
1,764
1,73
1,742
1,785
1,769
1,743
1,721
1,73
1,753
1,764
1,758
1,7
1,678
1,688


Summary of computational transaction
Raw Inputview raw input (R code)
Raw Outputview raw output of R engine
Computing time1 seconds
R Server'Herman Ole Andreas Wold' @ wold.wessa.net

\begin{tabular}{lllllllll}
\hline
Summary of computational transaction \tabularnewline
Raw Input & view raw input (R code)  \tabularnewline
Raw Output & view raw output of R engine  \tabularnewline
Computing time & 1 seconds \tabularnewline
R Server & 'Herman Ole Andreas Wold' @ wold.wessa.net \tabularnewline
\hline
\end{tabular}
%Source: https://freestatistics.org/blog/index.php?pk=243278&T=0

[TABLE]
[ROW][C]Summary of computational transaction[/C][/ROW]
[ROW][C]Raw Input[/C][C]view raw input (R code) [/C][/ROW]
[ROW][C]Raw Output[/C][C]view raw output of R engine [/C][/ROW]
[ROW][C]Computing time[/C][C]1 seconds[/C][/ROW]
[ROW][C]R Server[/C][C]'Herman Ole Andreas Wold' @ wold.wessa.net[/C][/ROW]
[/TABLE]
Source: https://freestatistics.org/blog/index.php?pk=243278&T=0

Globally Unique Identifier (entire table): ba.freestatistics.org/blog/index.php?pk=243278&T=0

As an alternative you can also use a QR Code:  

The GUIDs for individual cells are displayed in the table below:

Summary of computational transaction
Raw Inputview raw input (R code)
Raw Outputview raw output of R engine
Computing time1 seconds
R Server'Herman Ole Andreas Wold' @ wold.wessa.net


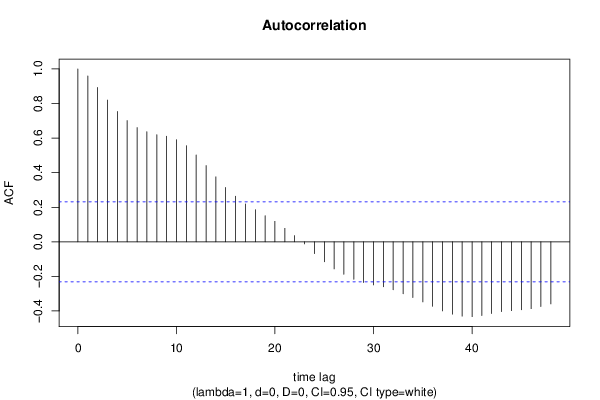
Autocorrelation Function
Time lag kACF(k)T-STATP-value
10.9595828.14230
20.8929127.57660
30.8196736.95520
40.7541736.39940
50.7010975.9490
60.6608245.60730
70.6369675.40480
80.6190475.25281e-06
90.6103525.1791e-06
100.5907155.01242e-06
110.5560074.71796e-06
120.502764.26613e-05
130.4407713.74010.000183
140.3758833.18950.001056
150.3143222.66710.004722
160.2634262.23520.014252
170.2192751.86060.033441
180.1853071.57240.060124
190.150551.27750.102772
200.1182381.00330.159542
210.0781070.66280.254801
220.0358780.30440.380838
23-0.011997-0.10180.4596
24-0.068019-0.57720.282814
25-0.115392-0.97910.165395
26-0.156337-1.32660.094423
27-0.187429-1.59040.058064
28-0.21637-1.8360.035246
29-0.23483-1.99260.025049
30-0.249015-2.1130.019036
31-0.25943-2.20130.015459
32-0.276979-2.35020.010752
33-0.300568-2.55040.006444
34-0.322431-2.73590.003914
35-0.347352-2.94740.002158
36-0.373094-3.16580.001134
37-0.39943-3.38930.00057
38-0.418368-3.550.000342
39-0.429894-3.64780.000249
40-0.432741-3.67190.00023
41-0.42637-3.61790.000274
42-0.414692-3.51880.000378
43-0.403543-3.42420.000511
44-0.397958-3.37680.000593
45-0.393266-3.3370.000671
46-0.386533-3.27980.000801
47-0.374122-3.17450.001104
48-0.358933-3.04560.001621

\begin{tabular}{lllllllll}
\hline
Autocorrelation Function \tabularnewline
Time lag k & ACF(k) & T-STAT & P-value \tabularnewline
1 & 0.959582 & 8.1423 & 0 \tabularnewline
2 & 0.892912 & 7.5766 & 0 \tabularnewline
3 & 0.819673 & 6.9552 & 0 \tabularnewline
4 & 0.754173 & 6.3994 & 0 \tabularnewline
5 & 0.701097 & 5.949 & 0 \tabularnewline
6 & 0.660824 & 5.6073 & 0 \tabularnewline
7 & 0.636967 & 5.4048 & 0 \tabularnewline
8 & 0.619047 & 5.2528 & 1e-06 \tabularnewline
9 & 0.610352 & 5.179 & 1e-06 \tabularnewline
10 & 0.590715 & 5.0124 & 2e-06 \tabularnewline
11 & 0.556007 & 4.7179 & 6e-06 \tabularnewline
12 & 0.50276 & 4.2661 & 3e-05 \tabularnewline
13 & 0.440771 & 3.7401 & 0.000183 \tabularnewline
14 & 0.375883 & 3.1895 & 0.001056 \tabularnewline
15 & 0.314322 & 2.6671 & 0.004722 \tabularnewline
16 & 0.263426 & 2.2352 & 0.014252 \tabularnewline
17 & 0.219275 & 1.8606 & 0.033441 \tabularnewline
18 & 0.185307 & 1.5724 & 0.060124 \tabularnewline
19 & 0.15055 & 1.2775 & 0.102772 \tabularnewline
20 & 0.118238 & 1.0033 & 0.159542 \tabularnewline
21 & 0.078107 & 0.6628 & 0.254801 \tabularnewline
22 & 0.035878 & 0.3044 & 0.380838 \tabularnewline
23 & -0.011997 & -0.1018 & 0.4596 \tabularnewline
24 & -0.068019 & -0.5772 & 0.282814 \tabularnewline
25 & -0.115392 & -0.9791 & 0.165395 \tabularnewline
26 & -0.156337 & -1.3266 & 0.094423 \tabularnewline
27 & -0.187429 & -1.5904 & 0.058064 \tabularnewline
28 & -0.21637 & -1.836 & 0.035246 \tabularnewline
29 & -0.23483 & -1.9926 & 0.025049 \tabularnewline
30 & -0.249015 & -2.113 & 0.019036 \tabularnewline
31 & -0.25943 & -2.2013 & 0.015459 \tabularnewline
32 & -0.276979 & -2.3502 & 0.010752 \tabularnewline
33 & -0.300568 & -2.5504 & 0.006444 \tabularnewline
34 & -0.322431 & -2.7359 & 0.003914 \tabularnewline
35 & -0.347352 & -2.9474 & 0.002158 \tabularnewline
36 & -0.373094 & -3.1658 & 0.001134 \tabularnewline
37 & -0.39943 & -3.3893 & 0.00057 \tabularnewline
38 & -0.418368 & -3.55 & 0.000342 \tabularnewline
39 & -0.429894 & -3.6478 & 0.000249 \tabularnewline
40 & -0.432741 & -3.6719 & 0.00023 \tabularnewline
41 & -0.42637 & -3.6179 & 0.000274 \tabularnewline
42 & -0.414692 & -3.5188 & 0.000378 \tabularnewline
43 & -0.403543 & -3.4242 & 0.000511 \tabularnewline
44 & -0.397958 & -3.3768 & 0.000593 \tabularnewline
45 & -0.393266 & -3.337 & 0.000671 \tabularnewline
46 & -0.386533 & -3.2798 & 0.000801 \tabularnewline
47 & -0.374122 & -3.1745 & 0.001104 \tabularnewline
48 & -0.358933 & -3.0456 & 0.001621 \tabularnewline
\hline
\end{tabular}
%Source: https://freestatistics.org/blog/index.php?pk=243278&T=1

[TABLE]
[ROW][C]Autocorrelation Function[/C][/ROW]
[ROW][C]Time lag k[/C][C]ACF(k)[/C][C]T-STAT[/C][C]P-value[/C][/ROW]
[ROW][C]1[/C][C]0.959582[/C][C]8.1423[/C][C]0[/C][/ROW]
[ROW][C]2[/C][C]0.892912[/C][C]7.5766[/C][C]0[/C][/ROW]
[ROW][C]3[/C][C]0.819673[/C][C]6.9552[/C][C]0[/C][/ROW]
[ROW][C]4[/C][C]0.754173[/C][C]6.3994[/C][C]0[/C][/ROW]
[ROW][C]5[/C][C]0.701097[/C][C]5.949[/C][C]0[/C][/ROW]
[ROW][C]6[/C][C]0.660824[/C][C]5.6073[/C][C]0[/C][/ROW]
[ROW][C]7[/C][C]0.636967[/C][C]5.4048[/C][C]0[/C][/ROW]
[ROW][C]8[/C][C]0.619047[/C][C]5.2528[/C][C]1e-06[/C][/ROW]
[ROW][C]9[/C][C]0.610352[/C][C]5.179[/C][C]1e-06[/C][/ROW]
[ROW][C]10[/C][C]0.590715[/C][C]5.0124[/C][C]2e-06[/C][/ROW]
[ROW][C]11[/C][C]0.556007[/C][C]4.7179[/C][C]6e-06[/C][/ROW]
[ROW][C]12[/C][C]0.50276[/C][C]4.2661[/C][C]3e-05[/C][/ROW]
[ROW][C]13[/C][C]0.440771[/C][C]3.7401[/C][C]0.000183[/C][/ROW]
[ROW][C]14[/C][C]0.375883[/C][C]3.1895[/C][C]0.001056[/C][/ROW]
[ROW][C]15[/C][C]0.314322[/C][C]2.6671[/C][C]0.004722[/C][/ROW]
[ROW][C]16[/C][C]0.263426[/C][C]2.2352[/C][C]0.014252[/C][/ROW]
[ROW][C]17[/C][C]0.219275[/C][C]1.8606[/C][C]0.033441[/C][/ROW]
[ROW][C]18[/C][C]0.185307[/C][C]1.5724[/C][C]0.060124[/C][/ROW]
[ROW][C]19[/C][C]0.15055[/C][C]1.2775[/C][C]0.102772[/C][/ROW]
[ROW][C]20[/C][C]0.118238[/C][C]1.0033[/C][C]0.159542[/C][/ROW]
[ROW][C]21[/C][C]0.078107[/C][C]0.6628[/C][C]0.254801[/C][/ROW]
[ROW][C]22[/C][C]0.035878[/C][C]0.3044[/C][C]0.380838[/C][/ROW]
[ROW][C]23[/C][C]-0.011997[/C][C]-0.1018[/C][C]0.4596[/C][/ROW]
[ROW][C]24[/C][C]-0.068019[/C][C]-0.5772[/C][C]0.282814[/C][/ROW]
[ROW][C]25[/C][C]-0.115392[/C][C]-0.9791[/C][C]0.165395[/C][/ROW]
[ROW][C]26[/C][C]-0.156337[/C][C]-1.3266[/C][C]0.094423[/C][/ROW]
[ROW][C]27[/C][C]-0.187429[/C][C]-1.5904[/C][C]0.058064[/C][/ROW]
[ROW][C]28[/C][C]-0.21637[/C][C]-1.836[/C][C]0.035246[/C][/ROW]
[ROW][C]29[/C][C]-0.23483[/C][C]-1.9926[/C][C]0.025049[/C][/ROW]
[ROW][C]30[/C][C]-0.249015[/C][C]-2.113[/C][C]0.019036[/C][/ROW]
[ROW][C]31[/C][C]-0.25943[/C][C]-2.2013[/C][C]0.015459[/C][/ROW]
[ROW][C]32[/C][C]-0.276979[/C][C]-2.3502[/C][C]0.010752[/C][/ROW]
[ROW][C]33[/C][C]-0.300568[/C][C]-2.5504[/C][C]0.006444[/C][/ROW]
[ROW][C]34[/C][C]-0.322431[/C][C]-2.7359[/C][C]0.003914[/C][/ROW]
[ROW][C]35[/C][C]-0.347352[/C][C]-2.9474[/C][C]0.002158[/C][/ROW]
[ROW][C]36[/C][C]-0.373094[/C][C]-3.1658[/C][C]0.001134[/C][/ROW]
[ROW][C]37[/C][C]-0.39943[/C][C]-3.3893[/C][C]0.00057[/C][/ROW]
[ROW][C]38[/C][C]-0.418368[/C][C]-3.55[/C][C]0.000342[/C][/ROW]
[ROW][C]39[/C][C]-0.429894[/C][C]-3.6478[/C][C]0.000249[/C][/ROW]
[ROW][C]40[/C][C]-0.432741[/C][C]-3.6719[/C][C]0.00023[/C][/ROW]
[ROW][C]41[/C][C]-0.42637[/C][C]-3.6179[/C][C]0.000274[/C][/ROW]
[ROW][C]42[/C][C]-0.414692[/C][C]-3.5188[/C][C]0.000378[/C][/ROW]
[ROW][C]43[/C][C]-0.403543[/C][C]-3.4242[/C][C]0.000511[/C][/ROW]
[ROW][C]44[/C][C]-0.397958[/C][C]-3.3768[/C][C]0.000593[/C][/ROW]
[ROW][C]45[/C][C]-0.393266[/C][C]-3.337[/C][C]0.000671[/C][/ROW]
[ROW][C]46[/C][C]-0.386533[/C][C]-3.2798[/C][C]0.000801[/C][/ROW]
[ROW][C]47[/C][C]-0.374122[/C][C]-3.1745[/C][C]0.001104[/C][/ROW]
[ROW][C]48[/C][C]-0.358933[/C][C]-3.0456[/C][C]0.001621[/C][/ROW]
[/TABLE]
Source: https://freestatistics.org/blog/index.php?pk=243278&T=1

Globally Unique Identifier (entire table): ba.freestatistics.org/blog/index.php?pk=243278&T=1

As an alternative you can also use a QR Code:  

The GUIDs for individual cells are displayed in the table below:

Autocorrelation Function
Time lag kACF(k)T-STATP-value
10.9595828.14230
20.8929127.57660
30.8196736.95520
40.7541736.39940
50.7010975.9490
60.6608245.60730
70.6369675.40480
80.6190475.25281e-06
90.6103525.1791e-06
100.5907155.01242e-06
110.5560074.71796e-06
120.502764.26613e-05
130.4407713.74010.000183
140.3758833.18950.001056
150.3143222.66710.004722
160.2634262.23520.014252
170.2192751.86060.033441
180.1853071.57240.060124
190.150551.27750.102772
200.1182381.00330.159542
210.0781070.66280.254801
220.0358780.30440.380838
23-0.011997-0.10180.4596
24-0.068019-0.57720.282814
25-0.115392-0.97910.165395
26-0.156337-1.32660.094423
27-0.187429-1.59040.058064
28-0.21637-1.8360.035246
29-0.23483-1.99260.025049
30-0.249015-2.1130.019036
31-0.25943-2.20130.015459
32-0.276979-2.35020.010752
33-0.300568-2.55040.006444
34-0.322431-2.73590.003914
35-0.347352-2.94740.002158
36-0.373094-3.16580.001134
37-0.39943-3.38930.00057
38-0.418368-3.550.000342
39-0.429894-3.64780.000249
40-0.432741-3.67190.00023
41-0.42637-3.61790.000274
42-0.414692-3.51880.000378
43-0.403543-3.42420.000511
44-0.397958-3.37680.000593
45-0.393266-3.3370.000671
46-0.386533-3.27980.000801
47-0.374122-3.17450.001104
48-0.358933-3.04560.001621


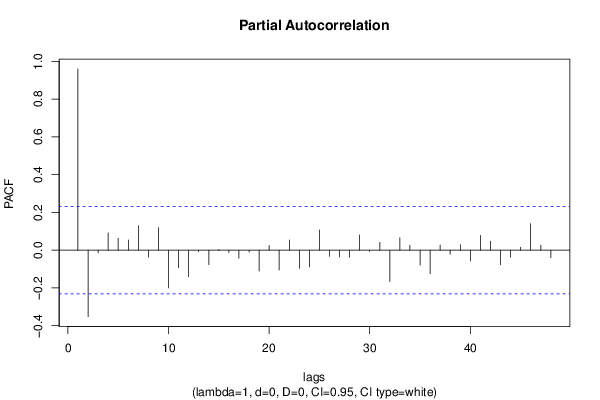
Partial Autocorrelation Function
Time lag kPACF(k)T-STATP-value
10.9595828.14230
2-0.352085-2.98750.001922
3-0.013964-0.11850.453005
40.0912920.77460.220545
50.0629760.53440.297366
60.05390.45740.324397
70.1291561.09590.138381
8-0.037079-0.31460.376979
90.1195241.01420.156943
10-0.19992-1.69640.047067
11-0.092769-0.78720.216882
12-0.140296-1.19040.11889
13-0.008235-0.06990.472241
14-0.076514-0.64920.259123
150.0038640.03280.486966
16-0.01245-0.10560.45808
17-0.043181-0.36640.35757
18-0.010108-0.08580.465944
19-0.110458-0.93730.175876
200.0250450.21250.416153
21-0.104962-0.89060.188046
220.0538670.45710.324497
23-0.096525-0.8190.207733
24-0.089117-0.75620.226004
250.1071190.90890.183209
26-0.033026-0.28020.390052
27-0.035525-0.30140.381975
28-0.037109-0.31490.376882
290.080350.68180.248778
30-0.007553-0.06410.474539
310.0412140.34970.363789
32-0.166134-1.40970.081467
330.0656140.55680.289711
340.0257040.21810.413981
35-0.078316-0.66450.254237
36-0.12429-1.05460.147559
370.0271070.230.409369
38-0.021728-0.18440.42712
390.0286460.24310.404321
40-0.057525-0.48810.313475
410.0781660.66330.254642
420.0473720.4020.34445
43-0.07712-0.65440.257476
44-0.037752-0.32030.374819
450.0156480.13280.447371
460.1396851.18530.119905
470.0257170.21820.413938
48-0.040463-0.34330.366172

\begin{tabular}{lllllllll}
\hline
Partial Autocorrelation Function \tabularnewline
Time lag k & PACF(k) & T-STAT & P-value \tabularnewline
1 & 0.959582 & 8.1423 & 0 \tabularnewline
2 & -0.352085 & -2.9875 & 0.001922 \tabularnewline
3 & -0.013964 & -0.1185 & 0.453005 \tabularnewline
4 & 0.091292 & 0.7746 & 0.220545 \tabularnewline
5 & 0.062976 & 0.5344 & 0.297366 \tabularnewline
6 & 0.0539 & 0.4574 & 0.324397 \tabularnewline
7 & 0.129156 & 1.0959 & 0.138381 \tabularnewline
8 & -0.037079 & -0.3146 & 0.376979 \tabularnewline
9 & 0.119524 & 1.0142 & 0.156943 \tabularnewline
10 & -0.19992 & -1.6964 & 0.047067 \tabularnewline
11 & -0.092769 & -0.7872 & 0.216882 \tabularnewline
12 & -0.140296 & -1.1904 & 0.11889 \tabularnewline
13 & -0.008235 & -0.0699 & 0.472241 \tabularnewline
14 & -0.076514 & -0.6492 & 0.259123 \tabularnewline
15 & 0.003864 & 0.0328 & 0.486966 \tabularnewline
16 & -0.01245 & -0.1056 & 0.45808 \tabularnewline
17 & -0.043181 & -0.3664 & 0.35757 \tabularnewline
18 & -0.010108 & -0.0858 & 0.465944 \tabularnewline
19 & -0.110458 & -0.9373 & 0.175876 \tabularnewline
20 & 0.025045 & 0.2125 & 0.416153 \tabularnewline
21 & -0.104962 & -0.8906 & 0.188046 \tabularnewline
22 & 0.053867 & 0.4571 & 0.324497 \tabularnewline
23 & -0.096525 & -0.819 & 0.207733 \tabularnewline
24 & -0.089117 & -0.7562 & 0.226004 \tabularnewline
25 & 0.107119 & 0.9089 & 0.183209 \tabularnewline
26 & -0.033026 & -0.2802 & 0.390052 \tabularnewline
27 & -0.035525 & -0.3014 & 0.381975 \tabularnewline
28 & -0.037109 & -0.3149 & 0.376882 \tabularnewline
29 & 0.08035 & 0.6818 & 0.248778 \tabularnewline
30 & -0.007553 & -0.0641 & 0.474539 \tabularnewline
31 & 0.041214 & 0.3497 & 0.363789 \tabularnewline
32 & -0.166134 & -1.4097 & 0.081467 \tabularnewline
33 & 0.065614 & 0.5568 & 0.289711 \tabularnewline
34 & 0.025704 & 0.2181 & 0.413981 \tabularnewline
35 & -0.078316 & -0.6645 & 0.254237 \tabularnewline
36 & -0.12429 & -1.0546 & 0.147559 \tabularnewline
37 & 0.027107 & 0.23 & 0.409369 \tabularnewline
38 & -0.021728 & -0.1844 & 0.42712 \tabularnewline
39 & 0.028646 & 0.2431 & 0.404321 \tabularnewline
40 & -0.057525 & -0.4881 & 0.313475 \tabularnewline
41 & 0.078166 & 0.6633 & 0.254642 \tabularnewline
42 & 0.047372 & 0.402 & 0.34445 \tabularnewline
43 & -0.07712 & -0.6544 & 0.257476 \tabularnewline
44 & -0.037752 & -0.3203 & 0.374819 \tabularnewline
45 & 0.015648 & 0.1328 & 0.447371 \tabularnewline
46 & 0.139685 & 1.1853 & 0.119905 \tabularnewline
47 & 0.025717 & 0.2182 & 0.413938 \tabularnewline
48 & -0.040463 & -0.3433 & 0.366172 \tabularnewline
\hline
\end{tabular}
%Source: https://freestatistics.org/blog/index.php?pk=243278&T=2

[TABLE]
[ROW][C]Partial Autocorrelation Function[/C][/ROW]
[ROW][C]Time lag k[/C][C]PACF(k)[/C][C]T-STAT[/C][C]P-value[/C][/ROW]
[ROW][C]1[/C][C]0.959582[/C][C]8.1423[/C][C]0[/C][/ROW]
[ROW][C]2[/C][C]-0.352085[/C][C]-2.9875[/C][C]0.001922[/C][/ROW]
[ROW][C]3[/C][C]-0.013964[/C][C]-0.1185[/C][C]0.453005[/C][/ROW]
[ROW][C]4[/C][C]0.091292[/C][C]0.7746[/C][C]0.220545[/C][/ROW]
[ROW][C]5[/C][C]0.062976[/C][C]0.5344[/C][C]0.297366[/C][/ROW]
[ROW][C]6[/C][C]0.0539[/C][C]0.4574[/C][C]0.324397[/C][/ROW]
[ROW][C]7[/C][C]0.129156[/C][C]1.0959[/C][C]0.138381[/C][/ROW]
[ROW][C]8[/C][C]-0.037079[/C][C]-0.3146[/C][C]0.376979[/C][/ROW]
[ROW][C]9[/C][C]0.119524[/C][C]1.0142[/C][C]0.156943[/C][/ROW]
[ROW][C]10[/C][C]-0.19992[/C][C]-1.6964[/C][C]0.047067[/C][/ROW]
[ROW][C]11[/C][C]-0.092769[/C][C]-0.7872[/C][C]0.216882[/C][/ROW]
[ROW][C]12[/C][C]-0.140296[/C][C]-1.1904[/C][C]0.11889[/C][/ROW]
[ROW][C]13[/C][C]-0.008235[/C][C]-0.0699[/C][C]0.472241[/C][/ROW]
[ROW][C]14[/C][C]-0.076514[/C][C]-0.6492[/C][C]0.259123[/C][/ROW]
[ROW][C]15[/C][C]0.003864[/C][C]0.0328[/C][C]0.486966[/C][/ROW]
[ROW][C]16[/C][C]-0.01245[/C][C]-0.1056[/C][C]0.45808[/C][/ROW]
[ROW][C]17[/C][C]-0.043181[/C][C]-0.3664[/C][C]0.35757[/C][/ROW]
[ROW][C]18[/C][C]-0.010108[/C][C]-0.0858[/C][C]0.465944[/C][/ROW]
[ROW][C]19[/C][C]-0.110458[/C][C]-0.9373[/C][C]0.175876[/C][/ROW]
[ROW][C]20[/C][C]0.025045[/C][C]0.2125[/C][C]0.416153[/C][/ROW]
[ROW][C]21[/C][C]-0.104962[/C][C]-0.8906[/C][C]0.188046[/C][/ROW]
[ROW][C]22[/C][C]0.053867[/C][C]0.4571[/C][C]0.324497[/C][/ROW]
[ROW][C]23[/C][C]-0.096525[/C][C]-0.819[/C][C]0.207733[/C][/ROW]
[ROW][C]24[/C][C]-0.089117[/C][C]-0.7562[/C][C]0.226004[/C][/ROW]
[ROW][C]25[/C][C]0.107119[/C][C]0.9089[/C][C]0.183209[/C][/ROW]
[ROW][C]26[/C][C]-0.033026[/C][C]-0.2802[/C][C]0.390052[/C][/ROW]
[ROW][C]27[/C][C]-0.035525[/C][C]-0.3014[/C][C]0.381975[/C][/ROW]
[ROW][C]28[/C][C]-0.037109[/C][C]-0.3149[/C][C]0.376882[/C][/ROW]
[ROW][C]29[/C][C]0.08035[/C][C]0.6818[/C][C]0.248778[/C][/ROW]
[ROW][C]30[/C][C]-0.007553[/C][C]-0.0641[/C][C]0.474539[/C][/ROW]
[ROW][C]31[/C][C]0.041214[/C][C]0.3497[/C][C]0.363789[/C][/ROW]
[ROW][C]32[/C][C]-0.166134[/C][C]-1.4097[/C][C]0.081467[/C][/ROW]
[ROW][C]33[/C][C]0.065614[/C][C]0.5568[/C][C]0.289711[/C][/ROW]
[ROW][C]34[/C][C]0.025704[/C][C]0.2181[/C][C]0.413981[/C][/ROW]
[ROW][C]35[/C][C]-0.078316[/C][C]-0.6645[/C][C]0.254237[/C][/ROW]
[ROW][C]36[/C][C]-0.12429[/C][C]-1.0546[/C][C]0.147559[/C][/ROW]
[ROW][C]37[/C][C]0.027107[/C][C]0.23[/C][C]0.409369[/C][/ROW]
[ROW][C]38[/C][C]-0.021728[/C][C]-0.1844[/C][C]0.42712[/C][/ROW]
[ROW][C]39[/C][C]0.028646[/C][C]0.2431[/C][C]0.404321[/C][/ROW]
[ROW][C]40[/C][C]-0.057525[/C][C]-0.4881[/C][C]0.313475[/C][/ROW]
[ROW][C]41[/C][C]0.078166[/C][C]0.6633[/C][C]0.254642[/C][/ROW]
[ROW][C]42[/C][C]0.047372[/C][C]0.402[/C][C]0.34445[/C][/ROW]
[ROW][C]43[/C][C]-0.07712[/C][C]-0.6544[/C][C]0.257476[/C][/ROW]
[ROW][C]44[/C][C]-0.037752[/C][C]-0.3203[/C][C]0.374819[/C][/ROW]
[ROW][C]45[/C][C]0.015648[/C][C]0.1328[/C][C]0.447371[/C][/ROW]
[ROW][C]46[/C][C]0.139685[/C][C]1.1853[/C][C]0.119905[/C][/ROW]
[ROW][C]47[/C][C]0.025717[/C][C]0.2182[/C][C]0.413938[/C][/ROW]
[ROW][C]48[/C][C]-0.040463[/C][C]-0.3433[/C][C]0.366172[/C][/ROW]
[/TABLE]
Source: https://freestatistics.org/blog/index.php?pk=243278&T=2

Globally Unique Identifier (entire table): ba.freestatistics.org/blog/index.php?pk=243278&T=2

As an alternative you can also use a QR Code:  

The GUIDs for individual cells are displayed in the table below:

Partial Autocorrelation Function
Time lag kPACF(k)T-STATP-value
10.9595828.14230
2-0.352085-2.98750.001922
3-0.013964-0.11850.453005
40.0912920.77460.220545
50.0629760.53440.297366
60.05390.45740.324397
70.1291561.09590.138381
8-0.037079-0.31460.376979
90.1195241.01420.156943
10-0.19992-1.69640.047067
11-0.092769-0.78720.216882
12-0.140296-1.19040.11889
13-0.008235-0.06990.472241
14-0.076514-0.64920.259123
150.0038640.03280.486966
16-0.01245-0.10560.45808
17-0.043181-0.36640.35757
18-0.010108-0.08580.465944
19-0.110458-0.93730.175876
200.0250450.21250.416153
21-0.104962-0.89060.188046
220.0538670.45710.324497
23-0.096525-0.8190.207733
24-0.089117-0.75620.226004
250.1071190.90890.183209
26-0.033026-0.28020.390052
27-0.035525-0.30140.381975
28-0.037109-0.31490.376882
290.080350.68180.248778
30-0.007553-0.06410.474539
310.0412140.34970.363789
32-0.166134-1.40970.081467
330.0656140.55680.289711
340.0257040.21810.413981
35-0.078316-0.66450.254237
36-0.12429-1.05460.147559
370.0271070.230.409369
38-0.021728-0.18440.42712
390.0286460.24310.404321
40-0.057525-0.48810.313475
410.0781660.66330.254642
420.0473720.4020.34445
43-0.07712-0.65440.257476
44-0.037752-0.32030.374819
450.0156480.13280.447371
460.1396851.18530.119905
470.0257170.21820.413938
48-0.040463-0.34330.366172


Parameters (Session):
par1 = 48 ; par2 = 1 ; par3 = 0 ; par4 = 0 ; par5 = 12 ; par6 = White Noise ; par7 = 0.95 ;
Parameters (R input):
par1 = 48 ; par2 = 1 ; par3 = 0 ; par4 = 0 ; par5 = 12 ; par6 = White Noise ; par7 = 0.95 ; par8 = ;
R code (references can be found in the software module):
par8 <- ''
par7 <- '0.95'
par6 <- 'White Noise'
par5 <- '12'
par4 <- '0'
par3 <- '1'
par2 <- '1'
par1 <- '48'
if (par1 == 'Default') {
par1 = 10*log10(length(x))
} else {
par1 <- as.numeric(par1)
}
par2 <- as.numeric(par2)
par3 <- as.numeric(par3)
par4 <- as.numeric(par4)
par5 <- as.numeric(par5)
if (par6 == 'White Noise') par6 <- 'white' else par6 <- 'ma'
par7 <- as.numeric(par7)
if (par8 != '') par8 <- as.numeric(par8)
ox <- x
if (par8 == '') {
if (par2 == 0) {
x <- log(x)
} else {
x <- (x ^ par2 - 1) / par2
}
} else {
x <- log(x,base=par8)
}
if (par3 > 0) x <- diff(x,lag=1,difference=par3)
if (par4 > 0) x <- diff(x,lag=par5,difference=par4)
bitmap(file='picts.png')
op <- par(mfrow=c(2,1))
plot(ox,type='l',main='Original Time Series',xlab='time',ylab='value')
if (par8=='') {
mytitle <- paste('Working Time Series (lambda=',par2,', d=',par3,', D=',par4,')',sep='')
mysub <- paste('(lambda=',par2,', d=',par3,', D=',par4,', CI=', par7, ', CI type=',par6,')',sep='')
} else {
mytitle <- paste('Working Time Series (base=',par8,', d=',par3,', D=',par4,')',sep='')
mysub <- paste('(base=',par8,', d=',par3,', D=',par4,', CI=', par7, ', CI type=',par6,')',sep='')
}
plot(x,type='l', main=mytitle,xlab='time',ylab='value')
par(op)
dev.off()
bitmap(file='pic1.png')
racf <- acf(x, par1, main='Autocorrelation', xlab='time lag', ylab='ACF', ci.type=par6, ci=par7, sub=mysub)
dev.off()
bitmap(file='pic2.png')
rpacf <- pacf(x,par1,main='Partial Autocorrelation',xlab='lags',ylab='PACF',sub=mysub)
dev.off()
(myacf <- c(racf$acf))
(mypacf <- c(rpacf$acf))
lengthx <- length(x)
sqrtn <- sqrt(lengthx)
load(file='createtable')
a<-table.start()
a<-table.row.start(a)
a<-table.element(a,'Autocorrelation Function',4,TRUE)
a<-table.row.end(a)
a<-table.row.start(a)
a<-table.element(a,'Time lag k',header=TRUE)
a<-table.element(a,hyperlink('basics.htm','ACF(k)','click here for more information about the Autocorrelation Function'),header=TRUE)
a<-table.element(a,'T-STAT',header=TRUE)
a<-table.element(a,'P-value',header=TRUE)
a<-table.row.end(a)
for (i in 2:(par1+1)) {
a<-table.row.start(a)
a<-table.element(a,i-1,header=TRUE)
a<-table.element(a,round(myacf[i],6))
mytstat <- myacf[i]*sqrtn
a<-table.element(a,round(mytstat,4))
a<-table.element(a,round(1-pt(abs(mytstat),lengthx),6))
a<-table.row.end(a)
}
a<-table.end(a)
table.save(a,file='mytable.tab')
a<-table.start()
a<-table.row.start(a)
a<-table.element(a,'Partial Autocorrelation Function',4,TRUE)
a<-table.row.end(a)
a<-table.row.start(a)
a<-table.element(a,'Time lag k',header=TRUE)
a<-table.element(a,hyperlink('basics.htm','PACF(k)','click here for more information about the Partial Autocorrelation Function'),header=TRUE)
a<-table.element(a,'T-STAT',header=TRUE)
a<-table.element(a,'P-value',header=TRUE)
a<-table.row.end(a)
for (i in 1:par1) {
a<-table.row.start(a)
a<-table.element(a,i,header=TRUE)
a<-table.element(a,round(mypacf[i],6))
mytstat <- mypacf[i]*sqrtn
a<-table.element(a,round(mytstat,4))
a<-table.element(a,round(1-pt(abs(mytstat),lengthx),6))
a<-table.row.end(a)
}
a<-table.end(a)
table.save(a,file='mytable1.tab')