Free Statistics

of Irreproducible Research!

Author's title

Author*Unverified author*
R Software Modulerwasp_autocorrelation.wasp
Title produced by software(Partial) Autocorrelation Function
Date of computationFri, 17 Oct 2014 13:08:48 +0100
Cite this page as followsStatistical Computations at FreeStatistics.org, Office for Research Development and Education, URL https://freestatistics.org/blog/index.php?v=date/2014/Oct/17/t1413547819md1mhsn4oh1wva1.htm/, Retrieved Fri, 10 May 2024 11:40:55 +0000
Statistical Computations at FreeStatistics.org, Office for Research Development and Education, URL https://freestatistics.org/blog/index.php?pk=243246, Retrieved Fri, 10 May 2024 11:40:55 +0000
QR Codes:

Original text written by user:
IsPrivate?No (this computation is public)
User-defined keywords
Estimated Impact74
Family? (F = Feedback message, R = changed R code, M = changed R Module, P = changed Parameters, D = changed Data)
-       [(Partial) Autocorrelation Function] [] [2014-10-17 12:08:48] [f1a1c306ccf782003dcf1365fad9efec] [Current]
- RM      [(Partial) Autocorrelation Function] [] [2014-12-16 15:22:27] [b5b39717209e06ff52ecfc643c6cbf41]
- R PD    [(Partial) Autocorrelation Function] [] [2014-12-16 15:32:00] [b5b39717209e06ff52ecfc643c6cbf41]
-   PD    [(Partial) Autocorrelation Function] [] [2014-12-16 15:42:41] [b5b39717209e06ff52ecfc643c6cbf41]
Feedback Forum

Post a new message
Dataseries X:
1850,07
1841,55
1845
1844,01
1842,67
1842,67
1842,67
1842,9
1840,37
1841,59
1844,33
1844,33
1844,33
1845,39
1861,84
1862,85
1869,46
1870,8
1870,8
1871,52
1875,52
1880,38
1885,05
1886,42
1886,42
1891,65
1903,11
1905,29
1904,26
1905,37
1905,37
1905,12
1908,62
1915,08
1916,36
1916,68
1916,24
1922,05
1922,63
1922,47
1920,64
1920,66
1920,66
1921,19
1921,44
1921,73
1921,81
1921,81
1921,81
1921,48
1917,07
1912,64
1901,15
1898,12
1900,02
1900,02
1900,82
1901,9
1902,19
1901,84
1903,73
1889,7
1891,27
1894,48
1894,27
1893,98
1893,98
1895,62
1901,72
1905,4
1898,14
1898,09


Summary of computational transaction
Raw Inputview raw input (R code)
Raw Outputview raw output of R engine
Computing time2 seconds
R Server'Gwilym Jenkins' @ jenkins.wessa.net

\begin{tabular}{lllllllll}
\hline
Summary of computational transaction \tabularnewline
Raw Input & view raw input (R code)  \tabularnewline
Raw Output & view raw output of R engine  \tabularnewline
Computing time & 2 seconds \tabularnewline
R Server & 'Gwilym Jenkins' @ jenkins.wessa.net \tabularnewline
\hline
\end{tabular}
%Source: https://freestatistics.org/blog/index.php?pk=243246&T=0

[TABLE]
[ROW][C]Summary of computational transaction[/C][/ROW]
[ROW][C]Raw Input[/C][C]view raw input (R code) [/C][/ROW]
[ROW][C]Raw Output[/C][C]view raw output of R engine [/C][/ROW]
[ROW][C]Computing time[/C][C]2 seconds[/C][/ROW]
[ROW][C]R Server[/C][C]'Gwilym Jenkins' @ jenkins.wessa.net[/C][/ROW]
[/TABLE]
Source: https://freestatistics.org/blog/index.php?pk=243246&T=0

Globally Unique Identifier (entire table): ba.freestatistics.org/blog/index.php?pk=243246&T=0

As an alternative you can also use a QR Code:  

The GUIDs for individual cells are displayed in the table below:

Summary of computational transaction
Raw Inputview raw input (R code)
Raw Outputview raw output of R engine
Computing time2 seconds
R Server'Gwilym Jenkins' @ jenkins.wessa.net


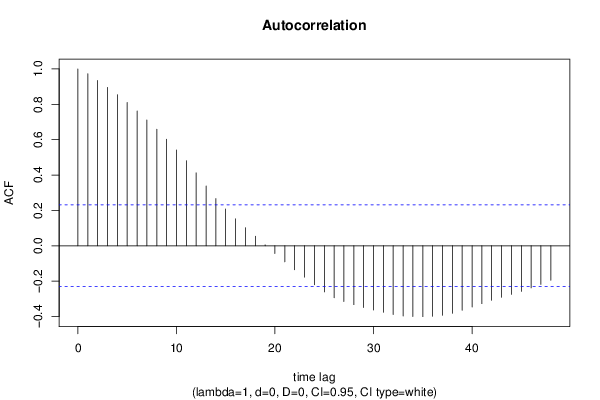
Autocorrelation Function
Time lag kACF(k)T-STATP-value
10.9727588.25410
20.9345677.93010
30.8956867.60010
40.8545867.25140
50.809916.87230
60.7621486.4670
70.7112286.0350
80.6586735.5890
90.6024535.1121e-06
100.5416134.59579e-06
110.4805684.07785.8e-05
120.4125273.50040.000401
130.3384032.87140.002682
140.2667062.26310.013324
150.2081921.76660.040769
160.1524581.29360.099961
170.1026050.87060.193423
180.054010.45830.324062
190.005360.04550.481924
20-0.043445-0.36860.356737
21-0.090642-0.76910.222169
22-0.135414-1.1490.127174
23-0.177161-1.50330.068573
24-0.219925-1.86610.033048
25-0.26048-2.21020.015133
26-0.293887-2.49370.00747
27-0.314908-2.67210.004658
28-0.332705-2.82310.003073
29-0.349057-2.96180.00207
30-0.362511-3.0760.001483
31-0.375501-3.18620.001066
32-0.38817-3.29370.000768
33-0.396676-3.36590.000613
34-0.399308-3.38820.000572
35-0.400517-3.39850.000554
36-0.398338-3.380.000587
37-0.392722-3.33240.000681
38-0.380956-3.23250.000926
39-0.364655-3.09420.001405
40-0.345716-2.93350.002246
41-0.32712-2.77570.003507
42-0.308223-2.61540.005426
43-0.291003-2.46920.007956
44-0.274634-2.33030.011297
45-0.257572-2.18560.01605
46-0.237916-2.01880.023617
47-0.217942-1.84930.03426
48-0.194434-1.64980.051667

\begin{tabular}{lllllllll}
\hline
Autocorrelation Function \tabularnewline
Time lag k & ACF(k) & T-STAT & P-value \tabularnewline
1 & 0.972758 & 8.2541 & 0 \tabularnewline
2 & 0.934567 & 7.9301 & 0 \tabularnewline
3 & 0.895686 & 7.6001 & 0 \tabularnewline
4 & 0.854586 & 7.2514 & 0 \tabularnewline
5 & 0.80991 & 6.8723 & 0 \tabularnewline
6 & 0.762148 & 6.467 & 0 \tabularnewline
7 & 0.711228 & 6.035 & 0 \tabularnewline
8 & 0.658673 & 5.589 & 0 \tabularnewline
9 & 0.602453 & 5.112 & 1e-06 \tabularnewline
10 & 0.541613 & 4.5957 & 9e-06 \tabularnewline
11 & 0.480568 & 4.0778 & 5.8e-05 \tabularnewline
12 & 0.412527 & 3.5004 & 0.000401 \tabularnewline
13 & 0.338403 & 2.8714 & 0.002682 \tabularnewline
14 & 0.266706 & 2.2631 & 0.013324 \tabularnewline
15 & 0.208192 & 1.7666 & 0.040769 \tabularnewline
16 & 0.152458 & 1.2936 & 0.099961 \tabularnewline
17 & 0.102605 & 0.8706 & 0.193423 \tabularnewline
18 & 0.05401 & 0.4583 & 0.324062 \tabularnewline
19 & 0.00536 & 0.0455 & 0.481924 \tabularnewline
20 & -0.043445 & -0.3686 & 0.356737 \tabularnewline
21 & -0.090642 & -0.7691 & 0.222169 \tabularnewline
22 & -0.135414 & -1.149 & 0.127174 \tabularnewline
23 & -0.177161 & -1.5033 & 0.068573 \tabularnewline
24 & -0.219925 & -1.8661 & 0.033048 \tabularnewline
25 & -0.26048 & -2.2102 & 0.015133 \tabularnewline
26 & -0.293887 & -2.4937 & 0.00747 \tabularnewline
27 & -0.314908 & -2.6721 & 0.004658 \tabularnewline
28 & -0.332705 & -2.8231 & 0.003073 \tabularnewline
29 & -0.349057 & -2.9618 & 0.00207 \tabularnewline
30 & -0.362511 & -3.076 & 0.001483 \tabularnewline
31 & -0.375501 & -3.1862 & 0.001066 \tabularnewline
32 & -0.38817 & -3.2937 & 0.000768 \tabularnewline
33 & -0.396676 & -3.3659 & 0.000613 \tabularnewline
34 & -0.399308 & -3.3882 & 0.000572 \tabularnewline
35 & -0.400517 & -3.3985 & 0.000554 \tabularnewline
36 & -0.398338 & -3.38 & 0.000587 \tabularnewline
37 & -0.392722 & -3.3324 & 0.000681 \tabularnewline
38 & -0.380956 & -3.2325 & 0.000926 \tabularnewline
39 & -0.364655 & -3.0942 & 0.001405 \tabularnewline
40 & -0.345716 & -2.9335 & 0.002246 \tabularnewline
41 & -0.32712 & -2.7757 & 0.003507 \tabularnewline
42 & -0.308223 & -2.6154 & 0.005426 \tabularnewline
43 & -0.291003 & -2.4692 & 0.007956 \tabularnewline
44 & -0.274634 & -2.3303 & 0.011297 \tabularnewline
45 & -0.257572 & -2.1856 & 0.01605 \tabularnewline
46 & -0.237916 & -2.0188 & 0.023617 \tabularnewline
47 & -0.217942 & -1.8493 & 0.03426 \tabularnewline
48 & -0.194434 & -1.6498 & 0.051667 \tabularnewline
\hline
\end{tabular}
%Source: https://freestatistics.org/blog/index.php?pk=243246&T=1

[TABLE]
[ROW][C]Autocorrelation Function[/C][/ROW]
[ROW][C]Time lag k[/C][C]ACF(k)[/C][C]T-STAT[/C][C]P-value[/C][/ROW]
[ROW][C]1[/C][C]0.972758[/C][C]8.2541[/C][C]0[/C][/ROW]
[ROW][C]2[/C][C]0.934567[/C][C]7.9301[/C][C]0[/C][/ROW]
[ROW][C]3[/C][C]0.895686[/C][C]7.6001[/C][C]0[/C][/ROW]
[ROW][C]4[/C][C]0.854586[/C][C]7.2514[/C][C]0[/C][/ROW]
[ROW][C]5[/C][C]0.80991[/C][C]6.8723[/C][C]0[/C][/ROW]
[ROW][C]6[/C][C]0.762148[/C][C]6.467[/C][C]0[/C][/ROW]
[ROW][C]7[/C][C]0.711228[/C][C]6.035[/C][C]0[/C][/ROW]
[ROW][C]8[/C][C]0.658673[/C][C]5.589[/C][C]0[/C][/ROW]
[ROW][C]9[/C][C]0.602453[/C][C]5.112[/C][C]1e-06[/C][/ROW]
[ROW][C]10[/C][C]0.541613[/C][C]4.5957[/C][C]9e-06[/C][/ROW]
[ROW][C]11[/C][C]0.480568[/C][C]4.0778[/C][C]5.8e-05[/C][/ROW]
[ROW][C]12[/C][C]0.412527[/C][C]3.5004[/C][C]0.000401[/C][/ROW]
[ROW][C]13[/C][C]0.338403[/C][C]2.8714[/C][C]0.002682[/C][/ROW]
[ROW][C]14[/C][C]0.266706[/C][C]2.2631[/C][C]0.013324[/C][/ROW]
[ROW][C]15[/C][C]0.208192[/C][C]1.7666[/C][C]0.040769[/C][/ROW]
[ROW][C]16[/C][C]0.152458[/C][C]1.2936[/C][C]0.099961[/C][/ROW]
[ROW][C]17[/C][C]0.102605[/C][C]0.8706[/C][C]0.193423[/C][/ROW]
[ROW][C]18[/C][C]0.05401[/C][C]0.4583[/C][C]0.324062[/C][/ROW]
[ROW][C]19[/C][C]0.00536[/C][C]0.0455[/C][C]0.481924[/C][/ROW]
[ROW][C]20[/C][C]-0.043445[/C][C]-0.3686[/C][C]0.356737[/C][/ROW]
[ROW][C]21[/C][C]-0.090642[/C][C]-0.7691[/C][C]0.222169[/C][/ROW]
[ROW][C]22[/C][C]-0.135414[/C][C]-1.149[/C][C]0.127174[/C][/ROW]
[ROW][C]23[/C][C]-0.177161[/C][C]-1.5033[/C][C]0.068573[/C][/ROW]
[ROW][C]24[/C][C]-0.219925[/C][C]-1.8661[/C][C]0.033048[/C][/ROW]
[ROW][C]25[/C][C]-0.26048[/C][C]-2.2102[/C][C]0.015133[/C][/ROW]
[ROW][C]26[/C][C]-0.293887[/C][C]-2.4937[/C][C]0.00747[/C][/ROW]
[ROW][C]27[/C][C]-0.314908[/C][C]-2.6721[/C][C]0.004658[/C][/ROW]
[ROW][C]28[/C][C]-0.332705[/C][C]-2.8231[/C][C]0.003073[/C][/ROW]
[ROW][C]29[/C][C]-0.349057[/C][C]-2.9618[/C][C]0.00207[/C][/ROW]
[ROW][C]30[/C][C]-0.362511[/C][C]-3.076[/C][C]0.001483[/C][/ROW]
[ROW][C]31[/C][C]-0.375501[/C][C]-3.1862[/C][C]0.001066[/C][/ROW]
[ROW][C]32[/C][C]-0.38817[/C][C]-3.2937[/C][C]0.000768[/C][/ROW]
[ROW][C]33[/C][C]-0.396676[/C][C]-3.3659[/C][C]0.000613[/C][/ROW]
[ROW][C]34[/C][C]-0.399308[/C][C]-3.3882[/C][C]0.000572[/C][/ROW]
[ROW][C]35[/C][C]-0.400517[/C][C]-3.3985[/C][C]0.000554[/C][/ROW]
[ROW][C]36[/C][C]-0.398338[/C][C]-3.38[/C][C]0.000587[/C][/ROW]
[ROW][C]37[/C][C]-0.392722[/C][C]-3.3324[/C][C]0.000681[/C][/ROW]
[ROW][C]38[/C][C]-0.380956[/C][C]-3.2325[/C][C]0.000926[/C][/ROW]
[ROW][C]39[/C][C]-0.364655[/C][C]-3.0942[/C][C]0.001405[/C][/ROW]
[ROW][C]40[/C][C]-0.345716[/C][C]-2.9335[/C][C]0.002246[/C][/ROW]
[ROW][C]41[/C][C]-0.32712[/C][C]-2.7757[/C][C]0.003507[/C][/ROW]
[ROW][C]42[/C][C]-0.308223[/C][C]-2.6154[/C][C]0.005426[/C][/ROW]
[ROW][C]43[/C][C]-0.291003[/C][C]-2.4692[/C][C]0.007956[/C][/ROW]
[ROW][C]44[/C][C]-0.274634[/C][C]-2.3303[/C][C]0.011297[/C][/ROW]
[ROW][C]45[/C][C]-0.257572[/C][C]-2.1856[/C][C]0.01605[/C][/ROW]
[ROW][C]46[/C][C]-0.237916[/C][C]-2.0188[/C][C]0.023617[/C][/ROW]
[ROW][C]47[/C][C]-0.217942[/C][C]-1.8493[/C][C]0.03426[/C][/ROW]
[ROW][C]48[/C][C]-0.194434[/C][C]-1.6498[/C][C]0.051667[/C][/ROW]
[/TABLE]
Source: https://freestatistics.org/blog/index.php?pk=243246&T=1

Globally Unique Identifier (entire table): ba.freestatistics.org/blog/index.php?pk=243246&T=1

As an alternative you can also use a QR Code:  

The GUIDs for individual cells are displayed in the table below:

Autocorrelation Function
Time lag kACF(k)T-STATP-value
10.9727588.25410
20.9345677.93010
30.8956867.60010
40.8545867.25140
50.809916.87230
60.7621486.4670
70.7112286.0350
80.6586735.5890
90.6024535.1121e-06
100.5416134.59579e-06
110.4805684.07785.8e-05
120.4125273.50040.000401
130.3384032.87140.002682
140.2667062.26310.013324
150.2081921.76660.040769
160.1524581.29360.099961
170.1026050.87060.193423
180.054010.45830.324062
190.005360.04550.481924
20-0.043445-0.36860.356737
21-0.090642-0.76910.222169
22-0.135414-1.1490.127174
23-0.177161-1.50330.068573
24-0.219925-1.86610.033048
25-0.26048-2.21020.015133
26-0.293887-2.49370.00747
27-0.314908-2.67210.004658
28-0.332705-2.82310.003073
29-0.349057-2.96180.00207
30-0.362511-3.0760.001483
31-0.375501-3.18620.001066
32-0.38817-3.29370.000768
33-0.396676-3.36590.000613
34-0.399308-3.38820.000572
35-0.400517-3.39850.000554
36-0.398338-3.380.000587
37-0.392722-3.33240.000681
38-0.380956-3.23250.000926
39-0.364655-3.09420.001405
40-0.345716-2.93350.002246
41-0.32712-2.77570.003507
42-0.308223-2.61540.005426
43-0.291003-2.46920.007956
44-0.274634-2.33030.011297
45-0.257572-2.18560.01605
46-0.237916-2.01880.023617
47-0.217942-1.84930.03426
48-0.194434-1.64980.051667


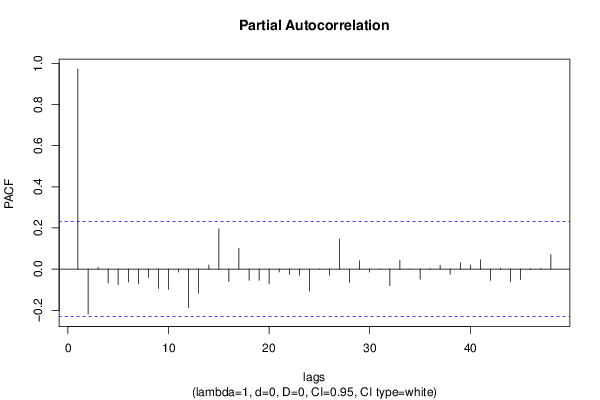
Partial Autocorrelation Function
Time lag kPACF(k)T-STATP-value
10.9727588.25410
2-0.21755-1.8460.034503
30.0083030.07050.472014
4-0.067139-0.56970.28533
5-0.074675-0.63360.264162
6-0.062532-0.53060.298662
7-0.071548-0.60710.272844
8-0.0405-0.34370.366054
9-0.094029-0.79790.213786
10-0.097758-0.82950.204781
11-0.013855-0.11760.45337
12-0.186742-1.58460.058724
13-0.116618-0.98950.162856
140.0200240.16990.432779
150.1958721.6620.050428
16-0.060273-0.51140.305306
170.1017840.86370.19532
18-0.053874-0.45710.324474
19-0.054092-0.4590.323813
20-0.071619-0.60770.272647
21-0.01372-0.11640.453822
22-0.025078-0.21280.416043
23-0.029962-0.25420.40002
24-0.106247-0.90150.185154
250.0003440.00290.498839
26-0.029503-0.25030.401517
270.1458781.23780.109904
28-0.064457-0.54690.293057
290.0415060.35220.362864
30-0.014244-0.12090.452069
31-0.000285-0.00240.499039
32-0.079659-0.67590.250627
330.0426140.36160.359357
340.0006080.00520.497949
35-0.049073-0.41640.339179
360.0026510.02250.491057
370.0183310.15550.438416
38-0.024506-0.20790.417931
390.0309550.26270.396781
400.0204010.17310.431527
410.0456020.38690.349968
42-0.054792-0.46490.321694
430.0046180.03920.484426
44-0.060661-0.51470.304161
45-0.050176-0.42580.335778
46-0.002417-0.02050.491848
470.0031270.02650.489453
480.070450.59780.275929

\begin{tabular}{lllllllll}
\hline
Partial Autocorrelation Function \tabularnewline
Time lag k & PACF(k) & T-STAT & P-value \tabularnewline
1 & 0.972758 & 8.2541 & 0 \tabularnewline
2 & -0.21755 & -1.846 & 0.034503 \tabularnewline
3 & 0.008303 & 0.0705 & 0.472014 \tabularnewline
4 & -0.067139 & -0.5697 & 0.28533 \tabularnewline
5 & -0.074675 & -0.6336 & 0.264162 \tabularnewline
6 & -0.062532 & -0.5306 & 0.298662 \tabularnewline
7 & -0.071548 & -0.6071 & 0.272844 \tabularnewline
8 & -0.0405 & -0.3437 & 0.366054 \tabularnewline
9 & -0.094029 & -0.7979 & 0.213786 \tabularnewline
10 & -0.097758 & -0.8295 & 0.204781 \tabularnewline
11 & -0.013855 & -0.1176 & 0.45337 \tabularnewline
12 & -0.186742 & -1.5846 & 0.058724 \tabularnewline
13 & -0.116618 & -0.9895 & 0.162856 \tabularnewline
14 & 0.020024 & 0.1699 & 0.432779 \tabularnewline
15 & 0.195872 & 1.662 & 0.050428 \tabularnewline
16 & -0.060273 & -0.5114 & 0.305306 \tabularnewline
17 & 0.101784 & 0.8637 & 0.19532 \tabularnewline
18 & -0.053874 & -0.4571 & 0.324474 \tabularnewline
19 & -0.054092 & -0.459 & 0.323813 \tabularnewline
20 & -0.071619 & -0.6077 & 0.272647 \tabularnewline
21 & -0.01372 & -0.1164 & 0.453822 \tabularnewline
22 & -0.025078 & -0.2128 & 0.416043 \tabularnewline
23 & -0.029962 & -0.2542 & 0.40002 \tabularnewline
24 & -0.106247 & -0.9015 & 0.185154 \tabularnewline
25 & 0.000344 & 0.0029 & 0.498839 \tabularnewline
26 & -0.029503 & -0.2503 & 0.401517 \tabularnewline
27 & 0.145878 & 1.2378 & 0.109904 \tabularnewline
28 & -0.064457 & -0.5469 & 0.293057 \tabularnewline
29 & 0.041506 & 0.3522 & 0.362864 \tabularnewline
30 & -0.014244 & -0.1209 & 0.452069 \tabularnewline
31 & -0.000285 & -0.0024 & 0.499039 \tabularnewline
32 & -0.079659 & -0.6759 & 0.250627 \tabularnewline
33 & 0.042614 & 0.3616 & 0.359357 \tabularnewline
34 & 0.000608 & 0.0052 & 0.497949 \tabularnewline
35 & -0.049073 & -0.4164 & 0.339179 \tabularnewline
36 & 0.002651 & 0.0225 & 0.491057 \tabularnewline
37 & 0.018331 & 0.1555 & 0.438416 \tabularnewline
38 & -0.024506 & -0.2079 & 0.417931 \tabularnewline
39 & 0.030955 & 0.2627 & 0.396781 \tabularnewline
40 & 0.020401 & 0.1731 & 0.431527 \tabularnewline
41 & 0.045602 & 0.3869 & 0.349968 \tabularnewline
42 & -0.054792 & -0.4649 & 0.321694 \tabularnewline
43 & 0.004618 & 0.0392 & 0.484426 \tabularnewline
44 & -0.060661 & -0.5147 & 0.304161 \tabularnewline
45 & -0.050176 & -0.4258 & 0.335778 \tabularnewline
46 & -0.002417 & -0.0205 & 0.491848 \tabularnewline
47 & 0.003127 & 0.0265 & 0.489453 \tabularnewline
48 & 0.07045 & 0.5978 & 0.275929 \tabularnewline
\hline
\end{tabular}
%Source: https://freestatistics.org/blog/index.php?pk=243246&T=2

[TABLE]
[ROW][C]Partial Autocorrelation Function[/C][/ROW]
[ROW][C]Time lag k[/C][C]PACF(k)[/C][C]T-STAT[/C][C]P-value[/C][/ROW]
[ROW][C]1[/C][C]0.972758[/C][C]8.2541[/C][C]0[/C][/ROW]
[ROW][C]2[/C][C]-0.21755[/C][C]-1.846[/C][C]0.034503[/C][/ROW]
[ROW][C]3[/C][C]0.008303[/C][C]0.0705[/C][C]0.472014[/C][/ROW]
[ROW][C]4[/C][C]-0.067139[/C][C]-0.5697[/C][C]0.28533[/C][/ROW]
[ROW][C]5[/C][C]-0.074675[/C][C]-0.6336[/C][C]0.264162[/C][/ROW]
[ROW][C]6[/C][C]-0.062532[/C][C]-0.5306[/C][C]0.298662[/C][/ROW]
[ROW][C]7[/C][C]-0.071548[/C][C]-0.6071[/C][C]0.272844[/C][/ROW]
[ROW][C]8[/C][C]-0.0405[/C][C]-0.3437[/C][C]0.366054[/C][/ROW]
[ROW][C]9[/C][C]-0.094029[/C][C]-0.7979[/C][C]0.213786[/C][/ROW]
[ROW][C]10[/C][C]-0.097758[/C][C]-0.8295[/C][C]0.204781[/C][/ROW]
[ROW][C]11[/C][C]-0.013855[/C][C]-0.1176[/C][C]0.45337[/C][/ROW]
[ROW][C]12[/C][C]-0.186742[/C][C]-1.5846[/C][C]0.058724[/C][/ROW]
[ROW][C]13[/C][C]-0.116618[/C][C]-0.9895[/C][C]0.162856[/C][/ROW]
[ROW][C]14[/C][C]0.020024[/C][C]0.1699[/C][C]0.432779[/C][/ROW]
[ROW][C]15[/C][C]0.195872[/C][C]1.662[/C][C]0.050428[/C][/ROW]
[ROW][C]16[/C][C]-0.060273[/C][C]-0.5114[/C][C]0.305306[/C][/ROW]
[ROW][C]17[/C][C]0.101784[/C][C]0.8637[/C][C]0.19532[/C][/ROW]
[ROW][C]18[/C][C]-0.053874[/C][C]-0.4571[/C][C]0.324474[/C][/ROW]
[ROW][C]19[/C][C]-0.054092[/C][C]-0.459[/C][C]0.323813[/C][/ROW]
[ROW][C]20[/C][C]-0.071619[/C][C]-0.6077[/C][C]0.272647[/C][/ROW]
[ROW][C]21[/C][C]-0.01372[/C][C]-0.1164[/C][C]0.453822[/C][/ROW]
[ROW][C]22[/C][C]-0.025078[/C][C]-0.2128[/C][C]0.416043[/C][/ROW]
[ROW][C]23[/C][C]-0.029962[/C][C]-0.2542[/C][C]0.40002[/C][/ROW]
[ROW][C]24[/C][C]-0.106247[/C][C]-0.9015[/C][C]0.185154[/C][/ROW]
[ROW][C]25[/C][C]0.000344[/C][C]0.0029[/C][C]0.498839[/C][/ROW]
[ROW][C]26[/C][C]-0.029503[/C][C]-0.2503[/C][C]0.401517[/C][/ROW]
[ROW][C]27[/C][C]0.145878[/C][C]1.2378[/C][C]0.109904[/C][/ROW]
[ROW][C]28[/C][C]-0.064457[/C][C]-0.5469[/C][C]0.293057[/C][/ROW]
[ROW][C]29[/C][C]0.041506[/C][C]0.3522[/C][C]0.362864[/C][/ROW]
[ROW][C]30[/C][C]-0.014244[/C][C]-0.1209[/C][C]0.452069[/C][/ROW]
[ROW][C]31[/C][C]-0.000285[/C][C]-0.0024[/C][C]0.499039[/C][/ROW]
[ROW][C]32[/C][C]-0.079659[/C][C]-0.6759[/C][C]0.250627[/C][/ROW]
[ROW][C]33[/C][C]0.042614[/C][C]0.3616[/C][C]0.359357[/C][/ROW]
[ROW][C]34[/C][C]0.000608[/C][C]0.0052[/C][C]0.497949[/C][/ROW]
[ROW][C]35[/C][C]-0.049073[/C][C]-0.4164[/C][C]0.339179[/C][/ROW]
[ROW][C]36[/C][C]0.002651[/C][C]0.0225[/C][C]0.491057[/C][/ROW]
[ROW][C]37[/C][C]0.018331[/C][C]0.1555[/C][C]0.438416[/C][/ROW]
[ROW][C]38[/C][C]-0.024506[/C][C]-0.2079[/C][C]0.417931[/C][/ROW]
[ROW][C]39[/C][C]0.030955[/C][C]0.2627[/C][C]0.396781[/C][/ROW]
[ROW][C]40[/C][C]0.020401[/C][C]0.1731[/C][C]0.431527[/C][/ROW]
[ROW][C]41[/C][C]0.045602[/C][C]0.3869[/C][C]0.349968[/C][/ROW]
[ROW][C]42[/C][C]-0.054792[/C][C]-0.4649[/C][C]0.321694[/C][/ROW]
[ROW][C]43[/C][C]0.004618[/C][C]0.0392[/C][C]0.484426[/C][/ROW]
[ROW][C]44[/C][C]-0.060661[/C][C]-0.5147[/C][C]0.304161[/C][/ROW]
[ROW][C]45[/C][C]-0.050176[/C][C]-0.4258[/C][C]0.335778[/C][/ROW]
[ROW][C]46[/C][C]-0.002417[/C][C]-0.0205[/C][C]0.491848[/C][/ROW]
[ROW][C]47[/C][C]0.003127[/C][C]0.0265[/C][C]0.489453[/C][/ROW]
[ROW][C]48[/C][C]0.07045[/C][C]0.5978[/C][C]0.275929[/C][/ROW]
[/TABLE]
Source: https://freestatistics.org/blog/index.php?pk=243246&T=2

Globally Unique Identifier (entire table): ba.freestatistics.org/blog/index.php?pk=243246&T=2

As an alternative you can also use a QR Code:  

The GUIDs for individual cells are displayed in the table below:

Partial Autocorrelation Function
Time lag kPACF(k)T-STATP-value
10.9727588.25410
2-0.21755-1.8460.034503
30.0083030.07050.472014
4-0.067139-0.56970.28533
5-0.074675-0.63360.264162
6-0.062532-0.53060.298662
7-0.071548-0.60710.272844
8-0.0405-0.34370.366054
9-0.094029-0.79790.213786
10-0.097758-0.82950.204781
11-0.013855-0.11760.45337
12-0.186742-1.58460.058724
13-0.116618-0.98950.162856
140.0200240.16990.432779
150.1958721.6620.050428
16-0.060273-0.51140.305306
170.1017840.86370.19532
18-0.053874-0.45710.324474
19-0.054092-0.4590.323813
20-0.071619-0.60770.272647
21-0.01372-0.11640.453822
22-0.025078-0.21280.416043
23-0.029962-0.25420.40002
24-0.106247-0.90150.185154
250.0003440.00290.498839
26-0.029503-0.25030.401517
270.1458781.23780.109904
28-0.064457-0.54690.293057
290.0415060.35220.362864
30-0.014244-0.12090.452069
31-0.000285-0.00240.499039
32-0.079659-0.67590.250627
330.0426140.36160.359357
340.0006080.00520.497949
35-0.049073-0.41640.339179
360.0026510.02250.491057
370.0183310.15550.438416
38-0.024506-0.20790.417931
390.0309550.26270.396781
400.0204010.17310.431527
410.0456020.38690.349968
42-0.054792-0.46490.321694
430.0046180.03920.484426
44-0.060661-0.51470.304161
45-0.050176-0.42580.335778
46-0.002417-0.02050.491848
470.0031270.02650.489453
480.070450.59780.275929


Parameters (Session):
par1 = 48 ; par2 = 1 ; par3 = 0 ; par4 = 0 ; par5 = 12 ; par6 = White Noise ; par7 = 0.95 ;
Parameters (R input):
par1 = 48 ; par2 = 1 ; par3 = 0 ; par4 = 0 ; par5 = 12 ; par6 = White Noise ; par7 = 0.95 ; par8 = ;
R code (references can be found in the software module):
if (par1 == 'Default') {
par1 = 10*log10(length(x))
} else {
par1 <- as.numeric(par1)
}
par2 <- as.numeric(par2)
par3 <- as.numeric(par3)
par4 <- as.numeric(par4)
par5 <- as.numeric(par5)
if (par6 == 'White Noise') par6 <- 'white' else par6 <- 'ma'
par7 <- as.numeric(par7)
if (par8 != '') par8 <- as.numeric(par8)
ox <- x
if (par8 == '') {
if (par2 == 0) {
x <- log(x)
} else {
x <- (x ^ par2 - 1) / par2
}
} else {
x <- log(x,base=par8)
}
if (par3 > 0) x <- diff(x,lag=1,difference=par3)
if (par4 > 0) x <- diff(x,lag=par5,difference=par4)
bitmap(file='picts.png')
op <- par(mfrow=c(2,1))
plot(ox,type='l',main='Original Time Series',xlab='time',ylab='value')
if (par8=='') {
mytitle <- paste('Working Time Series (lambda=',par2,', d=',par3,', D=',par4,')',sep='')
mysub <- paste('(lambda=',par2,', d=',par3,', D=',par4,', CI=', par7, ', CI type=',par6,')',sep='')
} else {
mytitle <- paste('Working Time Series (base=',par8,', d=',par3,', D=',par4,')',sep='')
mysub <- paste('(base=',par8,', d=',par3,', D=',par4,', CI=', par7, ', CI type=',par6,')',sep='')
}
plot(x,type='l', main=mytitle,xlab='time',ylab='value')
par(op)
dev.off()
bitmap(file='pic1.png')
racf <- acf(x, par1, main='Autocorrelation', xlab='time lag', ylab='ACF', ci.type=par6, ci=par7, sub=mysub)
dev.off()
bitmap(file='pic2.png')
rpacf <- pacf(x,par1,main='Partial Autocorrelation',xlab='lags',ylab='PACF',sub=mysub)
dev.off()
(myacf <- c(racf$acf))
(mypacf <- c(rpacf$acf))
lengthx <- length(x)
sqrtn <- sqrt(lengthx)
load(file='createtable')
a<-table.start()
a<-table.row.start(a)
a<-table.element(a,'Autocorrelation Function',4,TRUE)
a<-table.row.end(a)
a<-table.row.start(a)
a<-table.element(a,'Time lag k',header=TRUE)
a<-table.element(a,hyperlink('basics.htm','ACF(k)','click here for more information about the Autocorrelation Function'),header=TRUE)
a<-table.element(a,'T-STAT',header=TRUE)
a<-table.element(a,'P-value',header=TRUE)
a<-table.row.end(a)
for (i in 2:(par1+1)) {
a<-table.row.start(a)
a<-table.element(a,i-1,header=TRUE)
a<-table.element(a,round(myacf[i],6))
mytstat <- myacf[i]*sqrtn
a<-table.element(a,round(mytstat,4))
a<-table.element(a,round(1-pt(abs(mytstat),lengthx),6))
a<-table.row.end(a)
}
a<-table.end(a)
table.save(a,file='mytable.tab')
a<-table.start()
a<-table.row.start(a)
a<-table.element(a,'Partial Autocorrelation Function',4,TRUE)
a<-table.row.end(a)
a<-table.row.start(a)
a<-table.element(a,'Time lag k',header=TRUE)
a<-table.element(a,hyperlink('basics.htm','PACF(k)','click here for more information about the Partial Autocorrelation Function'),header=TRUE)
a<-table.element(a,'T-STAT',header=TRUE)
a<-table.element(a,'P-value',header=TRUE)
a<-table.row.end(a)
for (i in 1:par1) {
a<-table.row.start(a)
a<-table.element(a,i,header=TRUE)
a<-table.element(a,round(mypacf[i],6))
mytstat <- mypacf[i]*sqrtn
a<-table.element(a,round(mytstat,4))
a<-table.element(a,round(1-pt(abs(mytstat),lengthx),6))
a<-table.row.end(a)
}
a<-table.end(a)
table.save(a,file='mytable1.tab')