Free Statistics

of Irreproducible Research!

Author's title

Author*Unverified author*
R Software Modulerwasp_autocorrelation.wasp
Title produced by software(Partial) Autocorrelation Function
Date of computationFri, 17 Oct 2014 11:45:08 +0100
Cite this page as followsStatistical Computations at FreeStatistics.org, Office for Research Development and Education, URL https://freestatistics.org/blog/index.php?v=date/2014/Oct/17/t1413542744f2rqlopev4904wm.htm/, Retrieved Fri, 10 May 2024 15:17:06 +0000
Statistical Computations at FreeStatistics.org, Office for Research Development and Education, URL https://freestatistics.org/blog/index.php?pk=243216, Retrieved Fri, 10 May 2024 15:17:06 +0000
QR Codes:

Original text written by user:
IsPrivate?No (this computation is public)
User-defined keywords
Estimated Impact92
Family? (F = Feedback message, R = changed R code, M = changed R Module, P = changed Parameters, D = changed Data)
-       [(Partial) Autocorrelation Function] [] [2014-10-17 10:45:08] [56e8cb9ede54fa5ca6b1344bd59af70d] [Current]
Feedback Forum

Post a new message
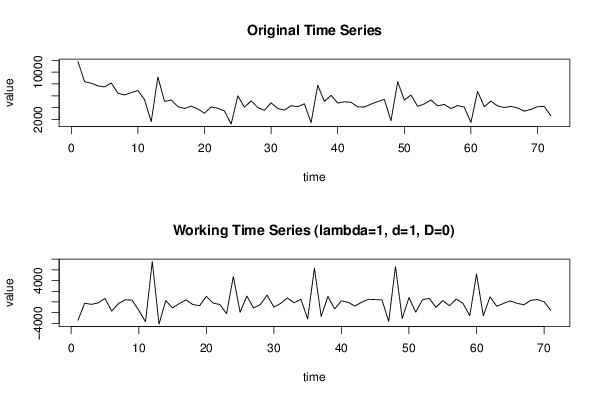
Dataseries X:
11798
8378
8131
7676
7505
8168
6455
6141
6554
6888
5339
1624
9187
5047
5289
4169
3862
4253
3768
3066
4108
3890
3420
1221
5984
4064
5151
4027
3530
4819
3855
3584
4322
4154
4656
1464
7780
5060
6084
4778
4989
4903
4142
4101
4595
5034
5407
1782
8395
5291
6116
4210
4621
5299
4293
4542
3831
4360
4088
1508
6743
4159
5105
4283
4019
4206
3948
3407
3701
4159
4208
2622


Summary of computational transaction
Raw Inputview raw input (R code)
Raw Outputview raw output of R engine
Computing time2 seconds
R Server'Sir Maurice George Kendall' @ kendall.wessa.net

\begin{tabular}{lllllllll}
\hline
Summary of computational transaction \tabularnewline
Raw Input & view raw input (R code)  \tabularnewline
Raw Output & view raw output of R engine  \tabularnewline
Computing time & 2 seconds \tabularnewline
R Server & 'Sir Maurice George Kendall' @ kendall.wessa.net \tabularnewline
\hline
\end{tabular}
%Source: https://freestatistics.org/blog/index.php?pk=243216&T=0

[TABLE]
[ROW][C]Summary of computational transaction[/C][/ROW]
[ROW][C]Raw Input[/C][C]view raw input (R code) [/C][/ROW]
[ROW][C]Raw Output[/C][C]view raw output of R engine [/C][/ROW]
[ROW][C]Computing time[/C][C]2 seconds[/C][/ROW]
[ROW][C]R Server[/C][C]'Sir Maurice George Kendall' @ kendall.wessa.net[/C][/ROW]
[/TABLE]
Source: https://freestatistics.org/blog/index.php?pk=243216&T=0

Globally Unique Identifier (entire table): ba.freestatistics.org/blog/index.php?pk=243216&T=0

As an alternative you can also use a QR Code:  

The GUIDs for individual cells are displayed in the table below:

Summary of computational transaction
Raw Inputview raw input (R code)
Raw Outputview raw output of R engine
Computing time2 seconds
R Server'Sir Maurice George Kendall' @ kendall.wessa.net


Autocorrelation Function
Time lag kACF(k)T-STATP-value
1-0.624444-5.26171e-06
20.2132391.79680.038311
3-0.111182-0.93680.176008
40.0658810.55510.290277
50.1007160.84870.199464
6-0.183629-1.54730.06312
70.082780.69750.243877
80.0558490.47060.319688
9-0.079486-0.66980.25259
100.2164851.82410.03617
11-0.565182-4.76235e-06
120.7398586.23420
13-0.463217-3.90310.000107
140.196361.65460.051214
15-0.124378-1.0480.149089
160.0678850.5720.284563
170.0734270.61870.269045
18-0.144312-1.2160.114008
190.0542630.45720.324453
200.0283740.23910.405866
21-0.052786-0.44480.328916
220.1693641.42710.078969
23-0.454928-3.83330.000135
240.5728884.82724e-06
25-0.362446-3.0540.001589
260.1394951.17540.121879
27-0.104883-0.88380.189904
280.0704040.59320.277456
290.0296920.25020.401582
30-0.10729-0.9040.184515
310.061850.52120.301938
32-0.005383-0.04540.481975
33-0.022193-0.1870.426096
340.1207041.01710.156286
35-0.34776-2.93030.002276
360.4015623.38360.000584
37-0.232929-1.96270.0268
380.077120.64980.258952
39-0.070367-0.59290.277559
400.0518170.43660.331856
410.0417980.35220.362866
42-0.090945-0.76630.223013
430.0483780.40760.342382
44-0.023327-0.19660.422367
450.008870.07470.470316
460.066970.56430.287163
47-0.225983-1.90420.030471
480.2365171.99290.025057

\begin{tabular}{lllllllll}
\hline
Autocorrelation Function \tabularnewline
Time lag k & ACF(k) & T-STAT & P-value \tabularnewline
1 & -0.624444 & -5.2617 & 1e-06 \tabularnewline
2 & 0.213239 & 1.7968 & 0.038311 \tabularnewline
3 & -0.111182 & -0.9368 & 0.176008 \tabularnewline
4 & 0.065881 & 0.5551 & 0.290277 \tabularnewline
5 & 0.100716 & 0.8487 & 0.199464 \tabularnewline
6 & -0.183629 & -1.5473 & 0.06312 \tabularnewline
7 & 0.08278 & 0.6975 & 0.243877 \tabularnewline
8 & 0.055849 & 0.4706 & 0.319688 \tabularnewline
9 & -0.079486 & -0.6698 & 0.25259 \tabularnewline
10 & 0.216485 & 1.8241 & 0.03617 \tabularnewline
11 & -0.565182 & -4.7623 & 5e-06 \tabularnewline
12 & 0.739858 & 6.2342 & 0 \tabularnewline
13 & -0.463217 & -3.9031 & 0.000107 \tabularnewline
14 & 0.19636 & 1.6546 & 0.051214 \tabularnewline
15 & -0.124378 & -1.048 & 0.149089 \tabularnewline
16 & 0.067885 & 0.572 & 0.284563 \tabularnewline
17 & 0.073427 & 0.6187 & 0.269045 \tabularnewline
18 & -0.144312 & -1.216 & 0.114008 \tabularnewline
19 & 0.054263 & 0.4572 & 0.324453 \tabularnewline
20 & 0.028374 & 0.2391 & 0.405866 \tabularnewline
21 & -0.052786 & -0.4448 & 0.328916 \tabularnewline
22 & 0.169364 & 1.4271 & 0.078969 \tabularnewline
23 & -0.454928 & -3.8333 & 0.000135 \tabularnewline
24 & 0.572888 & 4.8272 & 4e-06 \tabularnewline
25 & -0.362446 & -3.054 & 0.001589 \tabularnewline
26 & 0.139495 & 1.1754 & 0.121879 \tabularnewline
27 & -0.104883 & -0.8838 & 0.189904 \tabularnewline
28 & 0.070404 & 0.5932 & 0.277456 \tabularnewline
29 & 0.029692 & 0.2502 & 0.401582 \tabularnewline
30 & -0.10729 & -0.904 & 0.184515 \tabularnewline
31 & 0.06185 & 0.5212 & 0.301938 \tabularnewline
32 & -0.005383 & -0.0454 & 0.481975 \tabularnewline
33 & -0.022193 & -0.187 & 0.426096 \tabularnewline
34 & 0.120704 & 1.0171 & 0.156286 \tabularnewline
35 & -0.34776 & -2.9303 & 0.002276 \tabularnewline
36 & 0.401562 & 3.3836 & 0.000584 \tabularnewline
37 & -0.232929 & -1.9627 & 0.0268 \tabularnewline
38 & 0.07712 & 0.6498 & 0.258952 \tabularnewline
39 & -0.070367 & -0.5929 & 0.277559 \tabularnewline
40 & 0.051817 & 0.4366 & 0.331856 \tabularnewline
41 & 0.041798 & 0.3522 & 0.362866 \tabularnewline
42 & -0.090945 & -0.7663 & 0.223013 \tabularnewline
43 & 0.048378 & 0.4076 & 0.342382 \tabularnewline
44 & -0.023327 & -0.1966 & 0.422367 \tabularnewline
45 & 0.00887 & 0.0747 & 0.470316 \tabularnewline
46 & 0.06697 & 0.5643 & 0.287163 \tabularnewline
47 & -0.225983 & -1.9042 & 0.030471 \tabularnewline
48 & 0.236517 & 1.9929 & 0.025057 \tabularnewline
\hline
\end{tabular}
%Source: https://freestatistics.org/blog/index.php?pk=243216&T=1

[TABLE]
[ROW][C]Autocorrelation Function[/C][/ROW]
[ROW][C]Time lag k[/C][C]ACF(k)[/C][C]T-STAT[/C][C]P-value[/C][/ROW]
[ROW][C]1[/C][C]-0.624444[/C][C]-5.2617[/C][C]1e-06[/C][/ROW]
[ROW][C]2[/C][C]0.213239[/C][C]1.7968[/C][C]0.038311[/C][/ROW]
[ROW][C]3[/C][C]-0.111182[/C][C]-0.9368[/C][C]0.176008[/C][/ROW]
[ROW][C]4[/C][C]0.065881[/C][C]0.5551[/C][C]0.290277[/C][/ROW]
[ROW][C]5[/C][C]0.100716[/C][C]0.8487[/C][C]0.199464[/C][/ROW]
[ROW][C]6[/C][C]-0.183629[/C][C]-1.5473[/C][C]0.06312[/C][/ROW]
[ROW][C]7[/C][C]0.08278[/C][C]0.6975[/C][C]0.243877[/C][/ROW]
[ROW][C]8[/C][C]0.055849[/C][C]0.4706[/C][C]0.319688[/C][/ROW]
[ROW][C]9[/C][C]-0.079486[/C][C]-0.6698[/C][C]0.25259[/C][/ROW]
[ROW][C]10[/C][C]0.216485[/C][C]1.8241[/C][C]0.03617[/C][/ROW]
[ROW][C]11[/C][C]-0.565182[/C][C]-4.7623[/C][C]5e-06[/C][/ROW]
[ROW][C]12[/C][C]0.739858[/C][C]6.2342[/C][C]0[/C][/ROW]
[ROW][C]13[/C][C]-0.463217[/C][C]-3.9031[/C][C]0.000107[/C][/ROW]
[ROW][C]14[/C][C]0.19636[/C][C]1.6546[/C][C]0.051214[/C][/ROW]
[ROW][C]15[/C][C]-0.124378[/C][C]-1.048[/C][C]0.149089[/C][/ROW]
[ROW][C]16[/C][C]0.067885[/C][C]0.572[/C][C]0.284563[/C][/ROW]
[ROW][C]17[/C][C]0.073427[/C][C]0.6187[/C][C]0.269045[/C][/ROW]
[ROW][C]18[/C][C]-0.144312[/C][C]-1.216[/C][C]0.114008[/C][/ROW]
[ROW][C]19[/C][C]0.054263[/C][C]0.4572[/C][C]0.324453[/C][/ROW]
[ROW][C]20[/C][C]0.028374[/C][C]0.2391[/C][C]0.405866[/C][/ROW]
[ROW][C]21[/C][C]-0.052786[/C][C]-0.4448[/C][C]0.328916[/C][/ROW]
[ROW][C]22[/C][C]0.169364[/C][C]1.4271[/C][C]0.078969[/C][/ROW]
[ROW][C]23[/C][C]-0.454928[/C][C]-3.8333[/C][C]0.000135[/C][/ROW]
[ROW][C]24[/C][C]0.572888[/C][C]4.8272[/C][C]4e-06[/C][/ROW]
[ROW][C]25[/C][C]-0.362446[/C][C]-3.054[/C][C]0.001589[/C][/ROW]
[ROW][C]26[/C][C]0.139495[/C][C]1.1754[/C][C]0.121879[/C][/ROW]
[ROW][C]27[/C][C]-0.104883[/C][C]-0.8838[/C][C]0.189904[/C][/ROW]
[ROW][C]28[/C][C]0.070404[/C][C]0.5932[/C][C]0.277456[/C][/ROW]
[ROW][C]29[/C][C]0.029692[/C][C]0.2502[/C][C]0.401582[/C][/ROW]
[ROW][C]30[/C][C]-0.10729[/C][C]-0.904[/C][C]0.184515[/C][/ROW]
[ROW][C]31[/C][C]0.06185[/C][C]0.5212[/C][C]0.301938[/C][/ROW]
[ROW][C]32[/C][C]-0.005383[/C][C]-0.0454[/C][C]0.481975[/C][/ROW]
[ROW][C]33[/C][C]-0.022193[/C][C]-0.187[/C][C]0.426096[/C][/ROW]
[ROW][C]34[/C][C]0.120704[/C][C]1.0171[/C][C]0.156286[/C][/ROW]
[ROW][C]35[/C][C]-0.34776[/C][C]-2.9303[/C][C]0.002276[/C][/ROW]
[ROW][C]36[/C][C]0.401562[/C][C]3.3836[/C][C]0.000584[/C][/ROW]
[ROW][C]37[/C][C]-0.232929[/C][C]-1.9627[/C][C]0.0268[/C][/ROW]
[ROW][C]38[/C][C]0.07712[/C][C]0.6498[/C][C]0.258952[/C][/ROW]
[ROW][C]39[/C][C]-0.070367[/C][C]-0.5929[/C][C]0.277559[/C][/ROW]
[ROW][C]40[/C][C]0.051817[/C][C]0.4366[/C][C]0.331856[/C][/ROW]
[ROW][C]41[/C][C]0.041798[/C][C]0.3522[/C][C]0.362866[/C][/ROW]
[ROW][C]42[/C][C]-0.090945[/C][C]-0.7663[/C][C]0.223013[/C][/ROW]
[ROW][C]43[/C][C]0.048378[/C][C]0.4076[/C][C]0.342382[/C][/ROW]
[ROW][C]44[/C][C]-0.023327[/C][C]-0.1966[/C][C]0.422367[/C][/ROW]
[ROW][C]45[/C][C]0.00887[/C][C]0.0747[/C][C]0.470316[/C][/ROW]
[ROW][C]46[/C][C]0.06697[/C][C]0.5643[/C][C]0.287163[/C][/ROW]
[ROW][C]47[/C][C]-0.225983[/C][C]-1.9042[/C][C]0.030471[/C][/ROW]
[ROW][C]48[/C][C]0.236517[/C][C]1.9929[/C][C]0.025057[/C][/ROW]
[/TABLE]
Source: https://freestatistics.org/blog/index.php?pk=243216&T=1

Globally Unique Identifier (entire table): ba.freestatistics.org/blog/index.php?pk=243216&T=1

As an alternative you can also use a QR Code:  

The GUIDs for individual cells are displayed in the table below:

Autocorrelation Function
Time lag kACF(k)T-STATP-value
1-0.624444-5.26171e-06
20.2132391.79680.038311
3-0.111182-0.93680.176008
40.0658810.55510.290277
50.1007160.84870.199464
6-0.183629-1.54730.06312
70.082780.69750.243877
80.0558490.47060.319688
9-0.079486-0.66980.25259
100.2164851.82410.03617
11-0.565182-4.76235e-06
120.7398586.23420
13-0.463217-3.90310.000107
140.196361.65460.051214
15-0.124378-1.0480.149089
160.0678850.5720.284563
170.0734270.61870.269045
18-0.144312-1.2160.114008
190.0542630.45720.324453
200.0283740.23910.405866
21-0.052786-0.44480.328916
220.1693641.42710.078969
23-0.454928-3.83330.000135
240.5728884.82724e-06
25-0.362446-3.0540.001589
260.1394951.17540.121879
27-0.104883-0.88380.189904
280.0704040.59320.277456
290.0296920.25020.401582
30-0.10729-0.9040.184515
310.061850.52120.301938
32-0.005383-0.04540.481975
33-0.022193-0.1870.426096
340.1207041.01710.156286
35-0.34776-2.93030.002276
360.4015623.38360.000584
37-0.232929-1.96270.0268
380.077120.64980.258952
39-0.070367-0.59290.277559
400.0518170.43660.331856
410.0417980.35220.362866
42-0.090945-0.76630.223013
430.0483780.40760.342382
44-0.023327-0.19660.422367
450.008870.07470.470316
460.066970.56430.287163
47-0.225983-1.90420.030471
480.2365171.99290.025057


Partial Autocorrelation Function
Time lag kPACF(k)T-STATP-value
1-0.624444-5.26171e-06
2-0.289625-2.44040.008584
3-0.215274-1.81390.036957
4-0.124365-1.04790.149115
50.1772641.49370.069848
60.0245640.2070.418308
7-0.075979-0.64020.262047
80.0910270.7670.222809
90.0072180.06080.475836
100.3243062.73270.003961
11-0.485197-4.08835.6e-05
120.2986312.51630.00706
130.1496271.26080.105758
140.0682650.57520.283484
150.0362150.30520.380572
160.0708610.59710.276175
17-0.043846-0.36950.356446
18-0.026449-0.22290.41214
19-0.025648-0.21610.41476
20-0.058551-0.49340.311641
21-0.016543-0.13940.444766
22-0.131485-1.10790.13582
23-0.094858-0.79930.213396
240.0326090.27480.392145
250.0449190.37850.353096
26-0.088676-0.74720.228706
27-0.033683-0.28380.388687
280.0007180.0060.497595
29-0.083374-0.70250.242326
30-0.070238-0.59180.277919
310.0406250.34230.366563
32-0.007174-0.06040.475984
33-0.001317-0.01110.495587
34-0.026652-0.22460.411479
350.0193420.1630.435499
36-0.087147-0.73430.232587
370.0023850.02010.492012
38-0.050225-0.42320.336714
390.0119270.10050.460116
40-0.03617-0.30480.380714
410.0426260.35920.360265
420.0639970.53920.295701
430.0312530.26330.396525
44-0.025211-0.21240.416189
45-0.016361-0.13790.445372
46-0.074468-0.62750.26618
47-0.007791-0.06570.47392
48-0.101596-0.85610.19742

\begin{tabular}{lllllllll}
\hline
Partial Autocorrelation Function \tabularnewline
Time lag k & PACF(k) & T-STAT & P-value \tabularnewline
1 & -0.624444 & -5.2617 & 1e-06 \tabularnewline
2 & -0.289625 & -2.4404 & 0.008584 \tabularnewline
3 & -0.215274 & -1.8139 & 0.036957 \tabularnewline
4 & -0.124365 & -1.0479 & 0.149115 \tabularnewline
5 & 0.177264 & 1.4937 & 0.069848 \tabularnewline
6 & 0.024564 & 0.207 & 0.418308 \tabularnewline
7 & -0.075979 & -0.6402 & 0.262047 \tabularnewline
8 & 0.091027 & 0.767 & 0.222809 \tabularnewline
9 & 0.007218 & 0.0608 & 0.475836 \tabularnewline
10 & 0.324306 & 2.7327 & 0.003961 \tabularnewline
11 & -0.485197 & -4.0883 & 5.6e-05 \tabularnewline
12 & 0.298631 & 2.5163 & 0.00706 \tabularnewline
13 & 0.149627 & 1.2608 & 0.105758 \tabularnewline
14 & 0.068265 & 0.5752 & 0.283484 \tabularnewline
15 & 0.036215 & 0.3052 & 0.380572 \tabularnewline
16 & 0.070861 & 0.5971 & 0.276175 \tabularnewline
17 & -0.043846 & -0.3695 & 0.356446 \tabularnewline
18 & -0.026449 & -0.2229 & 0.41214 \tabularnewline
19 & -0.025648 & -0.2161 & 0.41476 \tabularnewline
20 & -0.058551 & -0.4934 & 0.311641 \tabularnewline
21 & -0.016543 & -0.1394 & 0.444766 \tabularnewline
22 & -0.131485 & -1.1079 & 0.13582 \tabularnewline
23 & -0.094858 & -0.7993 & 0.213396 \tabularnewline
24 & 0.032609 & 0.2748 & 0.392145 \tabularnewline
25 & 0.044919 & 0.3785 & 0.353096 \tabularnewline
26 & -0.088676 & -0.7472 & 0.228706 \tabularnewline
27 & -0.033683 & -0.2838 & 0.388687 \tabularnewline
28 & 0.000718 & 0.006 & 0.497595 \tabularnewline
29 & -0.083374 & -0.7025 & 0.242326 \tabularnewline
30 & -0.070238 & -0.5918 & 0.277919 \tabularnewline
31 & 0.040625 & 0.3423 & 0.366563 \tabularnewline
32 & -0.007174 & -0.0604 & 0.475984 \tabularnewline
33 & -0.001317 & -0.0111 & 0.495587 \tabularnewline
34 & -0.026652 & -0.2246 & 0.411479 \tabularnewline
35 & 0.019342 & 0.163 & 0.435499 \tabularnewline
36 & -0.087147 & -0.7343 & 0.232587 \tabularnewline
37 & 0.002385 & 0.0201 & 0.492012 \tabularnewline
38 & -0.050225 & -0.4232 & 0.336714 \tabularnewline
39 & 0.011927 & 0.1005 & 0.460116 \tabularnewline
40 & -0.03617 & -0.3048 & 0.380714 \tabularnewline
41 & 0.042626 & 0.3592 & 0.360265 \tabularnewline
42 & 0.063997 & 0.5392 & 0.295701 \tabularnewline
43 & 0.031253 & 0.2633 & 0.396525 \tabularnewline
44 & -0.025211 & -0.2124 & 0.416189 \tabularnewline
45 & -0.016361 & -0.1379 & 0.445372 \tabularnewline
46 & -0.074468 & -0.6275 & 0.26618 \tabularnewline
47 & -0.007791 & -0.0657 & 0.47392 \tabularnewline
48 & -0.101596 & -0.8561 & 0.19742 \tabularnewline
\hline
\end{tabular}
%Source: https://freestatistics.org/blog/index.php?pk=243216&T=2

[TABLE]
[ROW][C]Partial Autocorrelation Function[/C][/ROW]
[ROW][C]Time lag k[/C][C]PACF(k)[/C][C]T-STAT[/C][C]P-value[/C][/ROW]
[ROW][C]1[/C][C]-0.624444[/C][C]-5.2617[/C][C]1e-06[/C][/ROW]
[ROW][C]2[/C][C]-0.289625[/C][C]-2.4404[/C][C]0.008584[/C][/ROW]
[ROW][C]3[/C][C]-0.215274[/C][C]-1.8139[/C][C]0.036957[/C][/ROW]
[ROW][C]4[/C][C]-0.124365[/C][C]-1.0479[/C][C]0.149115[/C][/ROW]
[ROW][C]5[/C][C]0.177264[/C][C]1.4937[/C][C]0.069848[/C][/ROW]
[ROW][C]6[/C][C]0.024564[/C][C]0.207[/C][C]0.418308[/C][/ROW]
[ROW][C]7[/C][C]-0.075979[/C][C]-0.6402[/C][C]0.262047[/C][/ROW]
[ROW][C]8[/C][C]0.091027[/C][C]0.767[/C][C]0.222809[/C][/ROW]
[ROW][C]9[/C][C]0.007218[/C][C]0.0608[/C][C]0.475836[/C][/ROW]
[ROW][C]10[/C][C]0.324306[/C][C]2.7327[/C][C]0.003961[/C][/ROW]
[ROW][C]11[/C][C]-0.485197[/C][C]-4.0883[/C][C]5.6e-05[/C][/ROW]
[ROW][C]12[/C][C]0.298631[/C][C]2.5163[/C][C]0.00706[/C][/ROW]
[ROW][C]13[/C][C]0.149627[/C][C]1.2608[/C][C]0.105758[/C][/ROW]
[ROW][C]14[/C][C]0.068265[/C][C]0.5752[/C][C]0.283484[/C][/ROW]
[ROW][C]15[/C][C]0.036215[/C][C]0.3052[/C][C]0.380572[/C][/ROW]
[ROW][C]16[/C][C]0.070861[/C][C]0.5971[/C][C]0.276175[/C][/ROW]
[ROW][C]17[/C][C]-0.043846[/C][C]-0.3695[/C][C]0.356446[/C][/ROW]
[ROW][C]18[/C][C]-0.026449[/C][C]-0.2229[/C][C]0.41214[/C][/ROW]
[ROW][C]19[/C][C]-0.025648[/C][C]-0.2161[/C][C]0.41476[/C][/ROW]
[ROW][C]20[/C][C]-0.058551[/C][C]-0.4934[/C][C]0.311641[/C][/ROW]
[ROW][C]21[/C][C]-0.016543[/C][C]-0.1394[/C][C]0.444766[/C][/ROW]
[ROW][C]22[/C][C]-0.131485[/C][C]-1.1079[/C][C]0.13582[/C][/ROW]
[ROW][C]23[/C][C]-0.094858[/C][C]-0.7993[/C][C]0.213396[/C][/ROW]
[ROW][C]24[/C][C]0.032609[/C][C]0.2748[/C][C]0.392145[/C][/ROW]
[ROW][C]25[/C][C]0.044919[/C][C]0.3785[/C][C]0.353096[/C][/ROW]
[ROW][C]26[/C][C]-0.088676[/C][C]-0.7472[/C][C]0.228706[/C][/ROW]
[ROW][C]27[/C][C]-0.033683[/C][C]-0.2838[/C][C]0.388687[/C][/ROW]
[ROW][C]28[/C][C]0.000718[/C][C]0.006[/C][C]0.497595[/C][/ROW]
[ROW][C]29[/C][C]-0.083374[/C][C]-0.7025[/C][C]0.242326[/C][/ROW]
[ROW][C]30[/C][C]-0.070238[/C][C]-0.5918[/C][C]0.277919[/C][/ROW]
[ROW][C]31[/C][C]0.040625[/C][C]0.3423[/C][C]0.366563[/C][/ROW]
[ROW][C]32[/C][C]-0.007174[/C][C]-0.0604[/C][C]0.475984[/C][/ROW]
[ROW][C]33[/C][C]-0.001317[/C][C]-0.0111[/C][C]0.495587[/C][/ROW]
[ROW][C]34[/C][C]-0.026652[/C][C]-0.2246[/C][C]0.411479[/C][/ROW]
[ROW][C]35[/C][C]0.019342[/C][C]0.163[/C][C]0.435499[/C][/ROW]
[ROW][C]36[/C][C]-0.087147[/C][C]-0.7343[/C][C]0.232587[/C][/ROW]
[ROW][C]37[/C][C]0.002385[/C][C]0.0201[/C][C]0.492012[/C][/ROW]
[ROW][C]38[/C][C]-0.050225[/C][C]-0.4232[/C][C]0.336714[/C][/ROW]
[ROW][C]39[/C][C]0.011927[/C][C]0.1005[/C][C]0.460116[/C][/ROW]
[ROW][C]40[/C][C]-0.03617[/C][C]-0.3048[/C][C]0.380714[/C][/ROW]
[ROW][C]41[/C][C]0.042626[/C][C]0.3592[/C][C]0.360265[/C][/ROW]
[ROW][C]42[/C][C]0.063997[/C][C]0.5392[/C][C]0.295701[/C][/ROW]
[ROW][C]43[/C][C]0.031253[/C][C]0.2633[/C][C]0.396525[/C][/ROW]
[ROW][C]44[/C][C]-0.025211[/C][C]-0.2124[/C][C]0.416189[/C][/ROW]
[ROW][C]45[/C][C]-0.016361[/C][C]-0.1379[/C][C]0.445372[/C][/ROW]
[ROW][C]46[/C][C]-0.074468[/C][C]-0.6275[/C][C]0.26618[/C][/ROW]
[ROW][C]47[/C][C]-0.007791[/C][C]-0.0657[/C][C]0.47392[/C][/ROW]
[ROW][C]48[/C][C]-0.101596[/C][C]-0.8561[/C][C]0.19742[/C][/ROW]
[/TABLE]
Source: https://freestatistics.org/blog/index.php?pk=243216&T=2

Globally Unique Identifier (entire table): ba.freestatistics.org/blog/index.php?pk=243216&T=2

As an alternative you can also use a QR Code:  

The GUIDs for individual cells are displayed in the table below:

Partial Autocorrelation Function
Time lag kPACF(k)T-STATP-value
1-0.624444-5.26171e-06
2-0.289625-2.44040.008584
3-0.215274-1.81390.036957
4-0.124365-1.04790.149115
50.1772641.49370.069848
60.0245640.2070.418308
7-0.075979-0.64020.262047
80.0910270.7670.222809
90.0072180.06080.475836
100.3243062.73270.003961
11-0.485197-4.08835.6e-05
120.2986312.51630.00706
130.1496271.26080.105758
140.0682650.57520.283484
150.0362150.30520.380572
160.0708610.59710.276175
17-0.043846-0.36950.356446
18-0.026449-0.22290.41214
19-0.025648-0.21610.41476
20-0.058551-0.49340.311641
21-0.016543-0.13940.444766
22-0.131485-1.10790.13582
23-0.094858-0.79930.213396
240.0326090.27480.392145
250.0449190.37850.353096
26-0.088676-0.74720.228706
27-0.033683-0.28380.388687
280.0007180.0060.497595
29-0.083374-0.70250.242326
30-0.070238-0.59180.277919
310.0406250.34230.366563
32-0.007174-0.06040.475984
33-0.001317-0.01110.495587
34-0.026652-0.22460.411479
350.0193420.1630.435499
36-0.087147-0.73430.232587
370.0023850.02010.492012
38-0.050225-0.42320.336714
390.0119270.10050.460116
40-0.03617-0.30480.380714
410.0426260.35920.360265
420.0639970.53920.295701
430.0312530.26330.396525
44-0.025211-0.21240.416189
45-0.016361-0.13790.445372
46-0.074468-0.62750.26618
47-0.007791-0.06570.47392
48-0.101596-0.85610.19742


Parameters (Session):
par1 = 48 ; par2 = 1 ; par3 = 1 ; par4 = 0 ; par5 = 12 ; par6 = White Noise ; par7 = 0.95 ;
Parameters (R input):
par1 = 48 ; par2 = 1 ; par3 = 1 ; par4 = 0 ; par5 = 12 ; par6 = White Noise ; par7 = 0.95 ; par8 = ;
R code (references can be found in the software module):
par8 <- ''
par7 <- '0.95'
par6 <- 'White Noise'
par5 <- '12'
par4 <- '0'
par3 <- '0'
par2 <- '1'
par1 <- '48'
if (par1 == 'Default') {
par1 = 10*log10(length(x))
} else {
par1 <- as.numeric(par1)
}
par2 <- as.numeric(par2)
par3 <- as.numeric(par3)
par4 <- as.numeric(par4)
par5 <- as.numeric(par5)
if (par6 == 'White Noise') par6 <- 'white' else par6 <- 'ma'
par7 <- as.numeric(par7)
if (par8 != '') par8 <- as.numeric(par8)
ox <- x
if (par8 == '') {
if (par2 == 0) {
x <- log(x)
} else {
x <- (x ^ par2 - 1) / par2
}
} else {
x <- log(x,base=par8)
}
if (par3 > 0) x <- diff(x,lag=1,difference=par3)
if (par4 > 0) x <- diff(x,lag=par5,difference=par4)
bitmap(file='picts.png')
op <- par(mfrow=c(2,1))
plot(ox,type='l',main='Original Time Series',xlab='time',ylab='value')
if (par8=='') {
mytitle <- paste('Working Time Series (lambda=',par2,', d=',par3,', D=',par4,')',sep='')
mysub <- paste('(lambda=',par2,', d=',par3,', D=',par4,', CI=', par7, ', CI type=',par6,')',sep='')
} else {
mytitle <- paste('Working Time Series (base=',par8,', d=',par3,', D=',par4,')',sep='')
mysub <- paste('(base=',par8,', d=',par3,', D=',par4,', CI=', par7, ', CI type=',par6,')',sep='')
}
plot(x,type='l', main=mytitle,xlab='time',ylab='value')
par(op)
dev.off()
bitmap(file='pic1.png')
racf <- acf(x, par1, main='Autocorrelation', xlab='time lag', ylab='ACF', ci.type=par6, ci=par7, sub=mysub)
dev.off()
bitmap(file='pic2.png')
rpacf <- pacf(x,par1,main='Partial Autocorrelation',xlab='lags',ylab='PACF',sub=mysub)
dev.off()
(myacf <- c(racf$acf))
(mypacf <- c(rpacf$acf))
lengthx <- length(x)
sqrtn <- sqrt(lengthx)
load(file='createtable')
a<-table.start()
a<-table.row.start(a)
a<-table.element(a,'Autocorrelation Function',4,TRUE)
a<-table.row.end(a)
a<-table.row.start(a)
a<-table.element(a,'Time lag k',header=TRUE)
a<-table.element(a,hyperlink('basics.htm','ACF(k)','click here for more information about the Autocorrelation Function'),header=TRUE)
a<-table.element(a,'T-STAT',header=TRUE)
a<-table.element(a,'P-value',header=TRUE)
a<-table.row.end(a)
for (i in 2:(par1+1)) {
a<-table.row.start(a)
a<-table.element(a,i-1,header=TRUE)
a<-table.element(a,round(myacf[i],6))
mytstat <- myacf[i]*sqrtn
a<-table.element(a,round(mytstat,4))
a<-table.element(a,round(1-pt(abs(mytstat),lengthx),6))
a<-table.row.end(a)
}
a<-table.end(a)
table.save(a,file='mytable.tab')
a<-table.start()
a<-table.row.start(a)
a<-table.element(a,'Partial Autocorrelation Function',4,TRUE)
a<-table.row.end(a)
a<-table.row.start(a)
a<-table.element(a,'Time lag k',header=TRUE)
a<-table.element(a,hyperlink('basics.htm','PACF(k)','click here for more information about the Partial Autocorrelation Function'),header=TRUE)
a<-table.element(a,'T-STAT',header=TRUE)
a<-table.element(a,'P-value',header=TRUE)
a<-table.row.end(a)
for (i in 1:par1) {
a<-table.row.start(a)
a<-table.element(a,i,header=TRUE)
a<-table.element(a,round(mypacf[i],6))
mytstat <- mypacf[i]*sqrtn
a<-table.element(a,round(mytstat,4))
a<-table.element(a,round(1-pt(abs(mytstat),lengthx),6))
a<-table.row.end(a)
}
a<-table.end(a)
table.save(a,file='mytable1.tab')