Free Statistics

of Irreproducible Research!

Author's title

Author*Unverified author*
R Software Modulerwasp_autocorrelation.wasp
Title produced by software(Partial) Autocorrelation Function
Date of computationFri, 17 Oct 2014 09:34:58 +0100
Cite this page as followsStatistical Computations at FreeStatistics.org, Office for Research Development and Education, URL https://freestatistics.org/blog/index.php?v=date/2014/Oct/17/t1413534907gm9afzstfh4zjq1.htm/, Retrieved Fri, 10 May 2024 18:03:01 +0000
Statistical Computations at FreeStatistics.org, Office for Research Development and Education, URL https://freestatistics.org/blog/index.php?pk=243183, Retrieved Fri, 10 May 2024 18:03:01 +0000
QR Codes:

Original text written by user:
IsPrivate?No (this computation is public)
User-defined keywordsEline Van Loon
Estimated Impact99
Family? (F = Feedback message, R = changed R code, M = changed R Module, P = changed Parameters, D = changed Data)
-       [(Partial) Autocorrelation Function] [] [2014-10-17 08:34:58] [9adebd9d8505f0d6c7bd6ecbde218cd8] [Current]
Feedback Forum

Post a new message
Dataseries X:
22943
21413
20631
19775
17506
20688
32631
34062
29159
25871
23719
25638
27596
28006
27662
26655
25213
28434
40388
42758
37956
33490
31578
34766
32324
32046
29565
28284
26366
27530
39728
41528
36458
32301
28985
29118
29249
28036
26326
24942
23280
23969
35948
37639
34327
30133
27549
27990
30437
30464
28471
26882
25806
26465
36416
42870
40489
36645
33841
33496
34504
34699
33322
32160
30173
30782
43062
46223
45191
40671
37251
36870


Summary of computational transaction
Raw Inputview raw input (R code)
Raw Outputview raw output of R engine
Computing time2 seconds
R Server'Gwilym Jenkins' @ jenkins.wessa.net

\begin{tabular}{lllllllll}
\hline
Summary of computational transaction \tabularnewline
Raw Input & view raw input (R code)  \tabularnewline
Raw Output & view raw output of R engine  \tabularnewline
Computing time & 2 seconds \tabularnewline
R Server & 'Gwilym Jenkins' @ jenkins.wessa.net \tabularnewline
\hline
\end{tabular}
%Source: https://freestatistics.org/blog/index.php?pk=243183&T=0

[TABLE]
[ROW][C]Summary of computational transaction[/C][/ROW]
[ROW][C]Raw Input[/C][C]view raw input (R code) [/C][/ROW]
[ROW][C]Raw Output[/C][C]view raw output of R engine [/C][/ROW]
[ROW][C]Computing time[/C][C]2 seconds[/C][/ROW]
[ROW][C]R Server[/C][C]'Gwilym Jenkins' @ jenkins.wessa.net[/C][/ROW]
[/TABLE]
Source: https://freestatistics.org/blog/index.php?pk=243183&T=0

Globally Unique Identifier (entire table): ba.freestatistics.org/blog/index.php?pk=243183&T=0

As an alternative you can also use a QR Code:  

The GUIDs for individual cells are displayed in the table below:

Summary of computational transaction
Raw Inputview raw input (R code)
Raw Outputview raw output of R engine
Computing time2 seconds
R Server'Gwilym Jenkins' @ jenkins.wessa.net


Autocorrelation Function
Time lag kACF(k)T-STATP-value
10.7697856.53180
20.3950673.35230.00064
30.1468481.2460.108394
40.0730280.61970.268717
50.0957320.81230.209644
60.0962490.81670.208398
70.0664140.56350.287408
8-0.010743-0.09120.463811
9-0.030091-0.25530.399599
100.0951410.80730.211077
110.3418332.90060.002469
120.4934294.18693.9e-05
130.3190372.70710.004235
140.0083170.07060.471967
15-0.207802-1.76330.04105
16-0.275424-2.3370.011111
17-0.258467-2.19320.015763
18-0.240334-2.03930.022545
19-0.231722-1.96620.026564
20-0.26268-2.22890.014471
21-0.251603-2.13490.018086
22-0.132336-1.12290.132604
230.0976350.82850.205075
240.2894962.45650.008222
250.214621.82110.036373
260.0088180.07480.47028
27-0.14626-1.24110.109306
28-0.192138-1.63030.053698
29-0.164862-1.39890.083068
30-0.129913-1.10240.13699
31-0.087565-0.7430.229945
32-0.077008-0.65340.257778
33-0.050795-0.4310.333876
340.046320.3930.347725
350.2265591.92240.029255
360.3777493.20530.001006
370.3333522.82860.003026
380.174531.48090.071493
390.0370590.31450.377043
40-0.021947-0.18620.426394
41-0.027812-0.2360.407056
42-0.025112-0.21310.415933
430.000380.00320.498719
44-0.009785-0.0830.46703
45-0.016522-0.14020.44445
460.0198860.16870.433238
470.111310.94450.174037
480.1965041.66740.049891

\begin{tabular}{lllllllll}
\hline
Autocorrelation Function \tabularnewline
Time lag k & ACF(k) & T-STAT & P-value \tabularnewline
1 & 0.769785 & 6.5318 & 0 \tabularnewline
2 & 0.395067 & 3.3523 & 0.00064 \tabularnewline
3 & 0.146848 & 1.246 & 0.108394 \tabularnewline
4 & 0.073028 & 0.6197 & 0.268717 \tabularnewline
5 & 0.095732 & 0.8123 & 0.209644 \tabularnewline
6 & 0.096249 & 0.8167 & 0.208398 \tabularnewline
7 & 0.066414 & 0.5635 & 0.287408 \tabularnewline
8 & -0.010743 & -0.0912 & 0.463811 \tabularnewline
9 & -0.030091 & -0.2553 & 0.399599 \tabularnewline
10 & 0.095141 & 0.8073 & 0.211077 \tabularnewline
11 & 0.341833 & 2.9006 & 0.002469 \tabularnewline
12 & 0.493429 & 4.1869 & 3.9e-05 \tabularnewline
13 & 0.319037 & 2.7071 & 0.004235 \tabularnewline
14 & 0.008317 & 0.0706 & 0.471967 \tabularnewline
15 & -0.207802 & -1.7633 & 0.04105 \tabularnewline
16 & -0.275424 & -2.337 & 0.011111 \tabularnewline
17 & -0.258467 & -2.1932 & 0.015763 \tabularnewline
18 & -0.240334 & -2.0393 & 0.022545 \tabularnewline
19 & -0.231722 & -1.9662 & 0.026564 \tabularnewline
20 & -0.26268 & -2.2289 & 0.014471 \tabularnewline
21 & -0.251603 & -2.1349 & 0.018086 \tabularnewline
22 & -0.132336 & -1.1229 & 0.132604 \tabularnewline
23 & 0.097635 & 0.8285 & 0.205075 \tabularnewline
24 & 0.289496 & 2.4565 & 0.008222 \tabularnewline
25 & 0.21462 & 1.8211 & 0.036373 \tabularnewline
26 & 0.008818 & 0.0748 & 0.47028 \tabularnewline
27 & -0.14626 & -1.2411 & 0.109306 \tabularnewline
28 & -0.192138 & -1.6303 & 0.053698 \tabularnewline
29 & -0.164862 & -1.3989 & 0.083068 \tabularnewline
30 & -0.129913 & -1.1024 & 0.13699 \tabularnewline
31 & -0.087565 & -0.743 & 0.229945 \tabularnewline
32 & -0.077008 & -0.6534 & 0.257778 \tabularnewline
33 & -0.050795 & -0.431 & 0.333876 \tabularnewline
34 & 0.04632 & 0.393 & 0.347725 \tabularnewline
35 & 0.226559 & 1.9224 & 0.029255 \tabularnewline
36 & 0.377749 & 3.2053 & 0.001006 \tabularnewline
37 & 0.333352 & 2.8286 & 0.003026 \tabularnewline
38 & 0.17453 & 1.4809 & 0.071493 \tabularnewline
39 & 0.037059 & 0.3145 & 0.377043 \tabularnewline
40 & -0.021947 & -0.1862 & 0.426394 \tabularnewline
41 & -0.027812 & -0.236 & 0.407056 \tabularnewline
42 & -0.025112 & -0.2131 & 0.415933 \tabularnewline
43 & 0.00038 & 0.0032 & 0.498719 \tabularnewline
44 & -0.009785 & -0.083 & 0.46703 \tabularnewline
45 & -0.016522 & -0.1402 & 0.44445 \tabularnewline
46 & 0.019886 & 0.1687 & 0.433238 \tabularnewline
47 & 0.11131 & 0.9445 & 0.174037 \tabularnewline
48 & 0.196504 & 1.6674 & 0.049891 \tabularnewline
\hline
\end{tabular}
%Source: https://freestatistics.org/blog/index.php?pk=243183&T=1

[TABLE]
[ROW][C]Autocorrelation Function[/C][/ROW]
[ROW][C]Time lag k[/C][C]ACF(k)[/C][C]T-STAT[/C][C]P-value[/C][/ROW]
[ROW][C]1[/C][C]0.769785[/C][C]6.5318[/C][C]0[/C][/ROW]
[ROW][C]2[/C][C]0.395067[/C][C]3.3523[/C][C]0.00064[/C][/ROW]
[ROW][C]3[/C][C]0.146848[/C][C]1.246[/C][C]0.108394[/C][/ROW]
[ROW][C]4[/C][C]0.073028[/C][C]0.6197[/C][C]0.268717[/C][/ROW]
[ROW][C]5[/C][C]0.095732[/C][C]0.8123[/C][C]0.209644[/C][/ROW]
[ROW][C]6[/C][C]0.096249[/C][C]0.8167[/C][C]0.208398[/C][/ROW]
[ROW][C]7[/C][C]0.066414[/C][C]0.5635[/C][C]0.287408[/C][/ROW]
[ROW][C]8[/C][C]-0.010743[/C][C]-0.0912[/C][C]0.463811[/C][/ROW]
[ROW][C]9[/C][C]-0.030091[/C][C]-0.2553[/C][C]0.399599[/C][/ROW]
[ROW][C]10[/C][C]0.095141[/C][C]0.8073[/C][C]0.211077[/C][/ROW]
[ROW][C]11[/C][C]0.341833[/C][C]2.9006[/C][C]0.002469[/C][/ROW]
[ROW][C]12[/C][C]0.493429[/C][C]4.1869[/C][C]3.9e-05[/C][/ROW]
[ROW][C]13[/C][C]0.319037[/C][C]2.7071[/C][C]0.004235[/C][/ROW]
[ROW][C]14[/C][C]0.008317[/C][C]0.0706[/C][C]0.471967[/C][/ROW]
[ROW][C]15[/C][C]-0.207802[/C][C]-1.7633[/C][C]0.04105[/C][/ROW]
[ROW][C]16[/C][C]-0.275424[/C][C]-2.337[/C][C]0.011111[/C][/ROW]
[ROW][C]17[/C][C]-0.258467[/C][C]-2.1932[/C][C]0.015763[/C][/ROW]
[ROW][C]18[/C][C]-0.240334[/C][C]-2.0393[/C][C]0.022545[/C][/ROW]
[ROW][C]19[/C][C]-0.231722[/C][C]-1.9662[/C][C]0.026564[/C][/ROW]
[ROW][C]20[/C][C]-0.26268[/C][C]-2.2289[/C][C]0.014471[/C][/ROW]
[ROW][C]21[/C][C]-0.251603[/C][C]-2.1349[/C][C]0.018086[/C][/ROW]
[ROW][C]22[/C][C]-0.132336[/C][C]-1.1229[/C][C]0.132604[/C][/ROW]
[ROW][C]23[/C][C]0.097635[/C][C]0.8285[/C][C]0.205075[/C][/ROW]
[ROW][C]24[/C][C]0.289496[/C][C]2.4565[/C][C]0.008222[/C][/ROW]
[ROW][C]25[/C][C]0.21462[/C][C]1.8211[/C][C]0.036373[/C][/ROW]
[ROW][C]26[/C][C]0.008818[/C][C]0.0748[/C][C]0.47028[/C][/ROW]
[ROW][C]27[/C][C]-0.14626[/C][C]-1.2411[/C][C]0.109306[/C][/ROW]
[ROW][C]28[/C][C]-0.192138[/C][C]-1.6303[/C][C]0.053698[/C][/ROW]
[ROW][C]29[/C][C]-0.164862[/C][C]-1.3989[/C][C]0.083068[/C][/ROW]
[ROW][C]30[/C][C]-0.129913[/C][C]-1.1024[/C][C]0.13699[/C][/ROW]
[ROW][C]31[/C][C]-0.087565[/C][C]-0.743[/C][C]0.229945[/C][/ROW]
[ROW][C]32[/C][C]-0.077008[/C][C]-0.6534[/C][C]0.257778[/C][/ROW]
[ROW][C]33[/C][C]-0.050795[/C][C]-0.431[/C][C]0.333876[/C][/ROW]
[ROW][C]34[/C][C]0.04632[/C][C]0.393[/C][C]0.347725[/C][/ROW]
[ROW][C]35[/C][C]0.226559[/C][C]1.9224[/C][C]0.029255[/C][/ROW]
[ROW][C]36[/C][C]0.377749[/C][C]3.2053[/C][C]0.001006[/C][/ROW]
[ROW][C]37[/C][C]0.333352[/C][C]2.8286[/C][C]0.003026[/C][/ROW]
[ROW][C]38[/C][C]0.17453[/C][C]1.4809[/C][C]0.071493[/C][/ROW]
[ROW][C]39[/C][C]0.037059[/C][C]0.3145[/C][C]0.377043[/C][/ROW]
[ROW][C]40[/C][C]-0.021947[/C][C]-0.1862[/C][C]0.426394[/C][/ROW]
[ROW][C]41[/C][C]-0.027812[/C][C]-0.236[/C][C]0.407056[/C][/ROW]
[ROW][C]42[/C][C]-0.025112[/C][C]-0.2131[/C][C]0.415933[/C][/ROW]
[ROW][C]43[/C][C]0.00038[/C][C]0.0032[/C][C]0.498719[/C][/ROW]
[ROW][C]44[/C][C]-0.009785[/C][C]-0.083[/C][C]0.46703[/C][/ROW]
[ROW][C]45[/C][C]-0.016522[/C][C]-0.1402[/C][C]0.44445[/C][/ROW]
[ROW][C]46[/C][C]0.019886[/C][C]0.1687[/C][C]0.433238[/C][/ROW]
[ROW][C]47[/C][C]0.11131[/C][C]0.9445[/C][C]0.174037[/C][/ROW]
[ROW][C]48[/C][C]0.196504[/C][C]1.6674[/C][C]0.049891[/C][/ROW]
[/TABLE]
Source: https://freestatistics.org/blog/index.php?pk=243183&T=1

Globally Unique Identifier (entire table): ba.freestatistics.org/blog/index.php?pk=243183&T=1

As an alternative you can also use a QR Code:  

The GUIDs for individual cells are displayed in the table below:

Autocorrelation Function
Time lag kACF(k)T-STATP-value
10.7697856.53180
20.3950673.35230.00064
30.1468481.2460.108394
40.0730280.61970.268717
50.0957320.81230.209644
60.0962490.81670.208398
70.0664140.56350.287408
8-0.010743-0.09120.463811
9-0.030091-0.25530.399599
100.0951410.80730.211077
110.3418332.90060.002469
120.4934294.18693.9e-05
130.3190372.70710.004235
140.0083170.07060.471967
15-0.207802-1.76330.04105
16-0.275424-2.3370.011111
17-0.258467-2.19320.015763
18-0.240334-2.03930.022545
19-0.231722-1.96620.026564
20-0.26268-2.22890.014471
21-0.251603-2.13490.018086
22-0.132336-1.12290.132604
230.0976350.82850.205075
240.2894962.45650.008222
250.214621.82110.036373
260.0088180.07480.47028
27-0.14626-1.24110.109306
28-0.192138-1.63030.053698
29-0.164862-1.39890.083068
30-0.129913-1.10240.13699
31-0.087565-0.7430.229945
32-0.077008-0.65340.257778
33-0.050795-0.4310.333876
340.046320.3930.347725
350.2265591.92240.029255
360.3777493.20530.001006
370.3333522.82860.003026
380.174531.48090.071493
390.0370590.31450.377043
40-0.021947-0.18620.426394
41-0.027812-0.2360.407056
42-0.025112-0.21310.415933
430.000380.00320.498719
44-0.009785-0.0830.46703
45-0.016522-0.14020.44445
460.0198860.16870.433238
470.111310.94450.174037
480.1965041.66740.049891


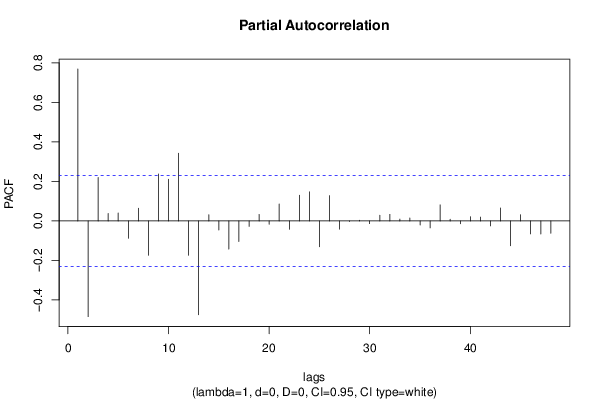
Partial Autocorrelation Function
Time lag kPACF(k)T-STATP-value
10.7697856.53180
2-0.484752-4.11335.1e-05
30.2196571.86390.03321
40.0376140.31920.375264
50.0402140.34120.366964
6-0.087367-0.74130.230452
70.0644220.54660.29316
8-0.173671-1.47360.072468
90.2377592.01750.023688
100.2115611.79520.038413
110.3431492.91170.002391
12-0.173802-1.47480.072319
13-0.47476-4.02856.9e-05
140.0312230.26490.395907
15-0.045741-0.38810.349534
16-0.142622-1.21020.115083
17-0.10401-0.88260.190208
18-0.027474-0.23310.408162
190.0331170.2810.389757
20-0.017135-0.14540.442403
210.0855050.72550.235237
22-0.04214-0.35760.360855
230.1298171.10150.137167
240.1471321.24850.107955
25-0.13103-1.11180.134955
260.1283121.08880.139945
27-0.041551-0.35260.36272
28-0.00247-0.0210.491667
290.0035390.030.488062
30-0.013535-0.11490.454442
310.0287910.24430.403846
320.0332460.28210.389339
330.0093520.07940.468484
340.0147830.12540.450262
35-0.020625-0.1750.430782
36-0.035288-0.29940.382737
370.0813290.69010.246175
380.0089220.07570.469932
39-0.014139-0.120.45242
400.0214490.1820.428048
410.0194380.16490.434727
42-0.024929-0.21150.416535
430.0652650.55380.290718
44-0.126051-1.06960.144191
450.0310040.26310.396621
46-0.065621-0.55680.289691
47-0.065846-0.55870.289043
48-0.062321-0.52880.29928

\begin{tabular}{lllllllll}
\hline
Partial Autocorrelation Function \tabularnewline
Time lag k & PACF(k) & T-STAT & P-value \tabularnewline
1 & 0.769785 & 6.5318 & 0 \tabularnewline
2 & -0.484752 & -4.1133 & 5.1e-05 \tabularnewline
3 & 0.219657 & 1.8639 & 0.03321 \tabularnewline
4 & 0.037614 & 0.3192 & 0.375264 \tabularnewline
5 & 0.040214 & 0.3412 & 0.366964 \tabularnewline
6 & -0.087367 & -0.7413 & 0.230452 \tabularnewline
7 & 0.064422 & 0.5466 & 0.29316 \tabularnewline
8 & -0.173671 & -1.4736 & 0.072468 \tabularnewline
9 & 0.237759 & 2.0175 & 0.023688 \tabularnewline
10 & 0.211561 & 1.7952 & 0.038413 \tabularnewline
11 & 0.343149 & 2.9117 & 0.002391 \tabularnewline
12 & -0.173802 & -1.4748 & 0.072319 \tabularnewline
13 & -0.47476 & -4.0285 & 6.9e-05 \tabularnewline
14 & 0.031223 & 0.2649 & 0.395907 \tabularnewline
15 & -0.045741 & -0.3881 & 0.349534 \tabularnewline
16 & -0.142622 & -1.2102 & 0.115083 \tabularnewline
17 & -0.10401 & -0.8826 & 0.190208 \tabularnewline
18 & -0.027474 & -0.2331 & 0.408162 \tabularnewline
19 & 0.033117 & 0.281 & 0.389757 \tabularnewline
20 & -0.017135 & -0.1454 & 0.442403 \tabularnewline
21 & 0.085505 & 0.7255 & 0.235237 \tabularnewline
22 & -0.04214 & -0.3576 & 0.360855 \tabularnewline
23 & 0.129817 & 1.1015 & 0.137167 \tabularnewline
24 & 0.147132 & 1.2485 & 0.107955 \tabularnewline
25 & -0.13103 & -1.1118 & 0.134955 \tabularnewline
26 & 0.128312 & 1.0888 & 0.139945 \tabularnewline
27 & -0.041551 & -0.3526 & 0.36272 \tabularnewline
28 & -0.00247 & -0.021 & 0.491667 \tabularnewline
29 & 0.003539 & 0.03 & 0.488062 \tabularnewline
30 & -0.013535 & -0.1149 & 0.454442 \tabularnewline
31 & 0.028791 & 0.2443 & 0.403846 \tabularnewline
32 & 0.033246 & 0.2821 & 0.389339 \tabularnewline
33 & 0.009352 & 0.0794 & 0.468484 \tabularnewline
34 & 0.014783 & 0.1254 & 0.450262 \tabularnewline
35 & -0.020625 & -0.175 & 0.430782 \tabularnewline
36 & -0.035288 & -0.2994 & 0.382737 \tabularnewline
37 & 0.081329 & 0.6901 & 0.246175 \tabularnewline
38 & 0.008922 & 0.0757 & 0.469932 \tabularnewline
39 & -0.014139 & -0.12 & 0.45242 \tabularnewline
40 & 0.021449 & 0.182 & 0.428048 \tabularnewline
41 & 0.019438 & 0.1649 & 0.434727 \tabularnewline
42 & -0.024929 & -0.2115 & 0.416535 \tabularnewline
43 & 0.065265 & 0.5538 & 0.290718 \tabularnewline
44 & -0.126051 & -1.0696 & 0.144191 \tabularnewline
45 & 0.031004 & 0.2631 & 0.396621 \tabularnewline
46 & -0.065621 & -0.5568 & 0.289691 \tabularnewline
47 & -0.065846 & -0.5587 & 0.289043 \tabularnewline
48 & -0.062321 & -0.5288 & 0.29928 \tabularnewline
\hline
\end{tabular}
%Source: https://freestatistics.org/blog/index.php?pk=243183&T=2

[TABLE]
[ROW][C]Partial Autocorrelation Function[/C][/ROW]
[ROW][C]Time lag k[/C][C]PACF(k)[/C][C]T-STAT[/C][C]P-value[/C][/ROW]
[ROW][C]1[/C][C]0.769785[/C][C]6.5318[/C][C]0[/C][/ROW]
[ROW][C]2[/C][C]-0.484752[/C][C]-4.1133[/C][C]5.1e-05[/C][/ROW]
[ROW][C]3[/C][C]0.219657[/C][C]1.8639[/C][C]0.03321[/C][/ROW]
[ROW][C]4[/C][C]0.037614[/C][C]0.3192[/C][C]0.375264[/C][/ROW]
[ROW][C]5[/C][C]0.040214[/C][C]0.3412[/C][C]0.366964[/C][/ROW]
[ROW][C]6[/C][C]-0.087367[/C][C]-0.7413[/C][C]0.230452[/C][/ROW]
[ROW][C]7[/C][C]0.064422[/C][C]0.5466[/C][C]0.29316[/C][/ROW]
[ROW][C]8[/C][C]-0.173671[/C][C]-1.4736[/C][C]0.072468[/C][/ROW]
[ROW][C]9[/C][C]0.237759[/C][C]2.0175[/C][C]0.023688[/C][/ROW]
[ROW][C]10[/C][C]0.211561[/C][C]1.7952[/C][C]0.038413[/C][/ROW]
[ROW][C]11[/C][C]0.343149[/C][C]2.9117[/C][C]0.002391[/C][/ROW]
[ROW][C]12[/C][C]-0.173802[/C][C]-1.4748[/C][C]0.072319[/C][/ROW]
[ROW][C]13[/C][C]-0.47476[/C][C]-4.0285[/C][C]6.9e-05[/C][/ROW]
[ROW][C]14[/C][C]0.031223[/C][C]0.2649[/C][C]0.395907[/C][/ROW]
[ROW][C]15[/C][C]-0.045741[/C][C]-0.3881[/C][C]0.349534[/C][/ROW]
[ROW][C]16[/C][C]-0.142622[/C][C]-1.2102[/C][C]0.115083[/C][/ROW]
[ROW][C]17[/C][C]-0.10401[/C][C]-0.8826[/C][C]0.190208[/C][/ROW]
[ROW][C]18[/C][C]-0.027474[/C][C]-0.2331[/C][C]0.408162[/C][/ROW]
[ROW][C]19[/C][C]0.033117[/C][C]0.281[/C][C]0.389757[/C][/ROW]
[ROW][C]20[/C][C]-0.017135[/C][C]-0.1454[/C][C]0.442403[/C][/ROW]
[ROW][C]21[/C][C]0.085505[/C][C]0.7255[/C][C]0.235237[/C][/ROW]
[ROW][C]22[/C][C]-0.04214[/C][C]-0.3576[/C][C]0.360855[/C][/ROW]
[ROW][C]23[/C][C]0.129817[/C][C]1.1015[/C][C]0.137167[/C][/ROW]
[ROW][C]24[/C][C]0.147132[/C][C]1.2485[/C][C]0.107955[/C][/ROW]
[ROW][C]25[/C][C]-0.13103[/C][C]-1.1118[/C][C]0.134955[/C][/ROW]
[ROW][C]26[/C][C]0.128312[/C][C]1.0888[/C][C]0.139945[/C][/ROW]
[ROW][C]27[/C][C]-0.041551[/C][C]-0.3526[/C][C]0.36272[/C][/ROW]
[ROW][C]28[/C][C]-0.00247[/C][C]-0.021[/C][C]0.491667[/C][/ROW]
[ROW][C]29[/C][C]0.003539[/C][C]0.03[/C][C]0.488062[/C][/ROW]
[ROW][C]30[/C][C]-0.013535[/C][C]-0.1149[/C][C]0.454442[/C][/ROW]
[ROW][C]31[/C][C]0.028791[/C][C]0.2443[/C][C]0.403846[/C][/ROW]
[ROW][C]32[/C][C]0.033246[/C][C]0.2821[/C][C]0.389339[/C][/ROW]
[ROW][C]33[/C][C]0.009352[/C][C]0.0794[/C][C]0.468484[/C][/ROW]
[ROW][C]34[/C][C]0.014783[/C][C]0.1254[/C][C]0.450262[/C][/ROW]
[ROW][C]35[/C][C]-0.020625[/C][C]-0.175[/C][C]0.430782[/C][/ROW]
[ROW][C]36[/C][C]-0.035288[/C][C]-0.2994[/C][C]0.382737[/C][/ROW]
[ROW][C]37[/C][C]0.081329[/C][C]0.6901[/C][C]0.246175[/C][/ROW]
[ROW][C]38[/C][C]0.008922[/C][C]0.0757[/C][C]0.469932[/C][/ROW]
[ROW][C]39[/C][C]-0.014139[/C][C]-0.12[/C][C]0.45242[/C][/ROW]
[ROW][C]40[/C][C]0.021449[/C][C]0.182[/C][C]0.428048[/C][/ROW]
[ROW][C]41[/C][C]0.019438[/C][C]0.1649[/C][C]0.434727[/C][/ROW]
[ROW][C]42[/C][C]-0.024929[/C][C]-0.2115[/C][C]0.416535[/C][/ROW]
[ROW][C]43[/C][C]0.065265[/C][C]0.5538[/C][C]0.290718[/C][/ROW]
[ROW][C]44[/C][C]-0.126051[/C][C]-1.0696[/C][C]0.144191[/C][/ROW]
[ROW][C]45[/C][C]0.031004[/C][C]0.2631[/C][C]0.396621[/C][/ROW]
[ROW][C]46[/C][C]-0.065621[/C][C]-0.5568[/C][C]0.289691[/C][/ROW]
[ROW][C]47[/C][C]-0.065846[/C][C]-0.5587[/C][C]0.289043[/C][/ROW]
[ROW][C]48[/C][C]-0.062321[/C][C]-0.5288[/C][C]0.29928[/C][/ROW]
[/TABLE]
Source: https://freestatistics.org/blog/index.php?pk=243183&T=2

Globally Unique Identifier (entire table): ba.freestatistics.org/blog/index.php?pk=243183&T=2

As an alternative you can also use a QR Code:  

The GUIDs for individual cells are displayed in the table below:

Partial Autocorrelation Function
Time lag kPACF(k)T-STATP-value
10.7697856.53180
2-0.484752-4.11335.1e-05
30.2196571.86390.03321
40.0376140.31920.375264
50.0402140.34120.366964
6-0.087367-0.74130.230452
70.0644220.54660.29316
8-0.173671-1.47360.072468
90.2377592.01750.023688
100.2115611.79520.038413
110.3431492.91170.002391
12-0.173802-1.47480.072319
13-0.47476-4.02856.9e-05
140.0312230.26490.395907
15-0.045741-0.38810.349534
16-0.142622-1.21020.115083
17-0.10401-0.88260.190208
18-0.027474-0.23310.408162
190.0331170.2810.389757
20-0.017135-0.14540.442403
210.0855050.72550.235237
22-0.04214-0.35760.360855
230.1298171.10150.137167
240.1471321.24850.107955
25-0.13103-1.11180.134955
260.1283121.08880.139945
27-0.041551-0.35260.36272
28-0.00247-0.0210.491667
290.0035390.030.488062
30-0.013535-0.11490.454442
310.0287910.24430.403846
320.0332460.28210.389339
330.0093520.07940.468484
340.0147830.12540.450262
35-0.020625-0.1750.430782
36-0.035288-0.29940.382737
370.0813290.69010.246175
380.0089220.07570.469932
39-0.014139-0.120.45242
400.0214490.1820.428048
410.0194380.16490.434727
42-0.024929-0.21150.416535
430.0652650.55380.290718
44-0.126051-1.06960.144191
450.0310040.26310.396621
46-0.065621-0.55680.289691
47-0.065846-0.55870.289043
48-0.062321-0.52880.29928


Parameters (Session):
par1 = 48 ; par2 = 1 ; par3 = 0 ; par4 = 0 ; par5 = 12 ; par6 = White Noise ; par7 = 0.95 ;
Parameters (R input):
par1 = 48 ; par2 = 1 ; par3 = 0 ; par4 = 0 ; par5 = 12 ; par6 = White Noise ; par7 = 0.95 ; par8 = ;
R code (references can be found in the software module):
if (par1 == 'Default') {
par1 = 10*log10(length(x))
} else {
par1 <- as.numeric(par1)
}
par2 <- as.numeric(par2)
par3 <- as.numeric(par3)
par4 <- as.numeric(par4)
par5 <- as.numeric(par5)
if (par6 == 'White Noise') par6 <- 'white' else par6 <- 'ma'
par7 <- as.numeric(par7)
if (par8 != '') par8 <- as.numeric(par8)
ox <- x
if (par8 == '') {
if (par2 == 0) {
x <- log(x)
} else {
x <- (x ^ par2 - 1) / par2
}
} else {
x <- log(x,base=par8)
}
if (par3 > 0) x <- diff(x,lag=1,difference=par3)
if (par4 > 0) x <- diff(x,lag=par5,difference=par4)
bitmap(file='picts.png')
op <- par(mfrow=c(2,1))
plot(ox,type='l',main='Original Time Series',xlab='time',ylab='value')
if (par8=='') {
mytitle <- paste('Working Time Series (lambda=',par2,', d=',par3,', D=',par4,')',sep='')
mysub <- paste('(lambda=',par2,', d=',par3,', D=',par4,', CI=', par7, ', CI type=',par6,')',sep='')
} else {
mytitle <- paste('Working Time Series (base=',par8,', d=',par3,', D=',par4,')',sep='')
mysub <- paste('(base=',par8,', d=',par3,', D=',par4,', CI=', par7, ', CI type=',par6,')',sep='')
}
plot(x,type='l', main=mytitle,xlab='time',ylab='value')
par(op)
dev.off()
bitmap(file='pic1.png')
racf <- acf(x, par1, main='Autocorrelation', xlab='time lag', ylab='ACF', ci.type=par6, ci=par7, sub=mysub)
dev.off()
bitmap(file='pic2.png')
rpacf <- pacf(x,par1,main='Partial Autocorrelation',xlab='lags',ylab='PACF',sub=mysub)
dev.off()
(myacf <- c(racf$acf))
(mypacf <- c(rpacf$acf))
lengthx <- length(x)
sqrtn <- sqrt(lengthx)
load(file='createtable')
a<-table.start()
a<-table.row.start(a)
a<-table.element(a,'Autocorrelation Function',4,TRUE)
a<-table.row.end(a)
a<-table.row.start(a)
a<-table.element(a,'Time lag k',header=TRUE)
a<-table.element(a,hyperlink('basics.htm','ACF(k)','click here for more information about the Autocorrelation Function'),header=TRUE)
a<-table.element(a,'T-STAT',header=TRUE)
a<-table.element(a,'P-value',header=TRUE)
a<-table.row.end(a)
for (i in 2:(par1+1)) {
a<-table.row.start(a)
a<-table.element(a,i-1,header=TRUE)
a<-table.element(a,round(myacf[i],6))
mytstat <- myacf[i]*sqrtn
a<-table.element(a,round(mytstat,4))
a<-table.element(a,round(1-pt(abs(mytstat),lengthx),6))
a<-table.row.end(a)
}
a<-table.end(a)
table.save(a,file='mytable.tab')
a<-table.start()
a<-table.row.start(a)
a<-table.element(a,'Partial Autocorrelation Function',4,TRUE)
a<-table.row.end(a)
a<-table.row.start(a)
a<-table.element(a,'Time lag k',header=TRUE)
a<-table.element(a,hyperlink('basics.htm','PACF(k)','click here for more information about the Partial Autocorrelation Function'),header=TRUE)
a<-table.element(a,'T-STAT',header=TRUE)
a<-table.element(a,'P-value',header=TRUE)
a<-table.row.end(a)
for (i in 1:par1) {
a<-table.row.start(a)
a<-table.element(a,i,header=TRUE)
a<-table.element(a,round(mypacf[i],6))
mytstat <- mypacf[i]*sqrtn
a<-table.element(a,round(mytstat,4))
a<-table.element(a,round(1-pt(abs(mytstat),lengthx),6))
a<-table.row.end(a)
}
a<-table.end(a)
table.save(a,file='mytable1.tab')