Free Statistics

of Irreproducible Research!

Author's title

Author*Unverified author*
R Software Modulerwasp_autocorrelation.wasp
Title produced by software(Partial) Autocorrelation Function
Date of computationFri, 17 Oct 2014 09:30:58 +0100
Cite this page as followsStatistical Computations at FreeStatistics.org, Office for Research Development and Education, URL https://freestatistics.org/blog/index.php?v=date/2014/Oct/17/t1413534734cltf80lxffqyr1v.htm/, Retrieved Fri, 10 May 2024 06:06:18 +0000
Statistical Computations at FreeStatistics.org, Office for Research Development and Education, URL https://freestatistics.org/blog/index.php?pk=243179, Retrieved Fri, 10 May 2024 06:06:18 +0000
QR Codes:

Original text written by user:
IsPrivate?No (this computation is public)
User-defined keywords
Estimated Impact96
Family? (F = Feedback message, R = changed R code, M = changed R Module, P = changed Parameters, D = changed Data)
-       [(Partial) Autocorrelation Function] [Partial Autocorre...] [2014-10-17 08:30:58] [8ab2f7883acfec92c4c89513940c9803] [Current]
Feedback Forum

Post a new message
Dataseries X:
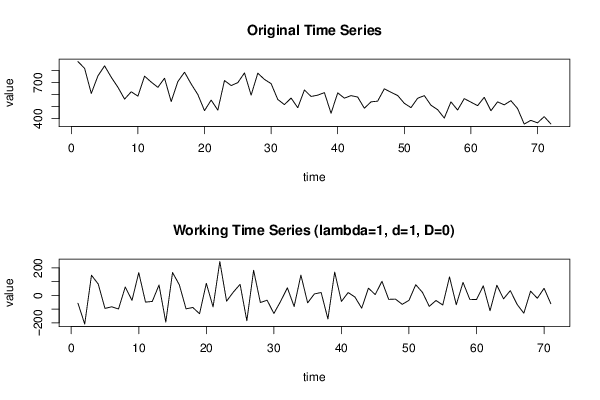
876
819
610
757
840
745
662
563
624
588
754
705
661
737
542
709
787
689
601
467
555
471
718
676
700
781
596
779
727
692
560
517
572
491
639
585
596
617
445
615
571
592
580
487
540
546
649
620
593
528
492
570
592
512
475
405
540
472
567
538
508
578
466
540
515
550
485
355
386
365
417
356


Summary of computational transaction
Raw Inputview raw input (R code)
Raw Outputview raw output of R engine
Computing time1 seconds
R Server'Gwilym Jenkins' @ jenkins.wessa.net

\begin{tabular}{lllllllll}
\hline
Summary of computational transaction \tabularnewline
Raw Input & view raw input (R code)  \tabularnewline
Raw Output & view raw output of R engine  \tabularnewline
Computing time & 1 seconds \tabularnewline
R Server & 'Gwilym Jenkins' @ jenkins.wessa.net \tabularnewline
\hline
\end{tabular}
%Source: https://freestatistics.org/blog/index.php?pk=243179&T=0

[TABLE]
[ROW][C]Summary of computational transaction[/C][/ROW]
[ROW][C]Raw Input[/C][C]view raw input (R code) [/C][/ROW]
[ROW][C]Raw Output[/C][C]view raw output of R engine [/C][/ROW]
[ROW][C]Computing time[/C][C]1 seconds[/C][/ROW]
[ROW][C]R Server[/C][C]'Gwilym Jenkins' @ jenkins.wessa.net[/C][/ROW]
[/TABLE]
Source: https://freestatistics.org/blog/index.php?pk=243179&T=0

Globally Unique Identifier (entire table): ba.freestatistics.org/blog/index.php?pk=243179&T=0

As an alternative you can also use a QR Code:  

The GUIDs for individual cells are displayed in the table below:

Summary of computational transaction
Raw Inputview raw input (R code)
Raw Outputview raw output of R engine
Computing time1 seconds
R Server'Gwilym Jenkins' @ jenkins.wessa.net


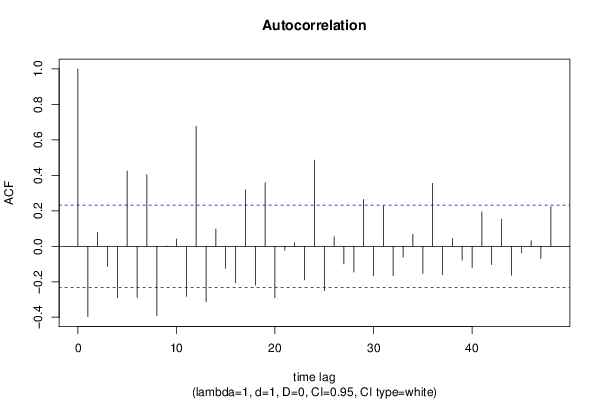
Autocorrelation Function
Time lag kACF(k)T-STATP-value
1-0.396794-3.34340.000662
20.0783380.66010.255665
3-0.114318-0.96330.169342
4-0.29064-2.4490.008399
50.4246533.57820.000314
6-0.288514-2.43110.008791
70.4036513.40120.000552
8-0.391736-3.30080.000755
90.0012810.01080.495709
100.0403180.33970.367534
11-0.282732-2.38230.009942
120.6773745.70770
13-0.313167-2.63880.005109
140.0973830.82060.207322
15-0.124272-1.04710.149295
16-0.206075-1.73640.043414
170.3183312.68230.004544
18-0.218865-1.84420.034664
190.3582023.01830.001764
20-0.289881-2.44260.008537
21-0.02212-0.18640.426337
220.0198890.16760.433691
23-0.188334-1.58690.058486
240.4859294.09455.5e-05
25-0.251091-2.11570.018938
260.0534270.45020.326974
27-0.099048-0.83460.203373
28-0.14507-1.22240.112803
290.2638022.22280.014706
30-0.165419-1.39380.083856
310.2267541.91070.030043
32-0.165261-1.39250.084056
33-0.061121-0.5150.304072
340.0676150.56970.285327
35-0.152874-1.28810.10094
360.3550312.99150.001907
37-0.160517-1.35250.090248
380.0430120.36240.359055
39-0.077747-0.65510.257259
40-0.120054-1.01160.157584
410.1937581.63260.053487
42-0.103245-0.870.193627
430.1525541.28540.101408
44-0.163807-1.38030.085918
45-0.036635-0.30870.37923
460.0315650.2660.395516
47-0.068543-0.57760.282697
480.2238091.88580.031703

\begin{tabular}{lllllllll}
\hline
Autocorrelation Function \tabularnewline
Time lag k & ACF(k) & T-STAT & P-value \tabularnewline
1 & -0.396794 & -3.3434 & 0.000662 \tabularnewline
2 & 0.078338 & 0.6601 & 0.255665 \tabularnewline
3 & -0.114318 & -0.9633 & 0.169342 \tabularnewline
4 & -0.29064 & -2.449 & 0.008399 \tabularnewline
5 & 0.424653 & 3.5782 & 0.000314 \tabularnewline
6 & -0.288514 & -2.4311 & 0.008791 \tabularnewline
7 & 0.403651 & 3.4012 & 0.000552 \tabularnewline
8 & -0.391736 & -3.3008 & 0.000755 \tabularnewline
9 & 0.001281 & 0.0108 & 0.495709 \tabularnewline
10 & 0.040318 & 0.3397 & 0.367534 \tabularnewline
11 & -0.282732 & -2.3823 & 0.009942 \tabularnewline
12 & 0.677374 & 5.7077 & 0 \tabularnewline
13 & -0.313167 & -2.6388 & 0.005109 \tabularnewline
14 & 0.097383 & 0.8206 & 0.207322 \tabularnewline
15 & -0.124272 & -1.0471 & 0.149295 \tabularnewline
16 & -0.206075 & -1.7364 & 0.043414 \tabularnewline
17 & 0.318331 & 2.6823 & 0.004544 \tabularnewline
18 & -0.218865 & -1.8442 & 0.034664 \tabularnewline
19 & 0.358202 & 3.0183 & 0.001764 \tabularnewline
20 & -0.289881 & -2.4426 & 0.008537 \tabularnewline
21 & -0.02212 & -0.1864 & 0.426337 \tabularnewline
22 & 0.019889 & 0.1676 & 0.433691 \tabularnewline
23 & -0.188334 & -1.5869 & 0.058486 \tabularnewline
24 & 0.485929 & 4.0945 & 5.5e-05 \tabularnewline
25 & -0.251091 & -2.1157 & 0.018938 \tabularnewline
26 & 0.053427 & 0.4502 & 0.326974 \tabularnewline
27 & -0.099048 & -0.8346 & 0.203373 \tabularnewline
28 & -0.14507 & -1.2224 & 0.112803 \tabularnewline
29 & 0.263802 & 2.2228 & 0.014706 \tabularnewline
30 & -0.165419 & -1.3938 & 0.083856 \tabularnewline
31 & 0.226754 & 1.9107 & 0.030043 \tabularnewline
32 & -0.165261 & -1.3925 & 0.084056 \tabularnewline
33 & -0.061121 & -0.515 & 0.304072 \tabularnewline
34 & 0.067615 & 0.5697 & 0.285327 \tabularnewline
35 & -0.152874 & -1.2881 & 0.10094 \tabularnewline
36 & 0.355031 & 2.9915 & 0.001907 \tabularnewline
37 & -0.160517 & -1.3525 & 0.090248 \tabularnewline
38 & 0.043012 & 0.3624 & 0.359055 \tabularnewline
39 & -0.077747 & -0.6551 & 0.257259 \tabularnewline
40 & -0.120054 & -1.0116 & 0.157584 \tabularnewline
41 & 0.193758 & 1.6326 & 0.053487 \tabularnewline
42 & -0.103245 & -0.87 & 0.193627 \tabularnewline
43 & 0.152554 & 1.2854 & 0.101408 \tabularnewline
44 & -0.163807 & -1.3803 & 0.085918 \tabularnewline
45 & -0.036635 & -0.3087 & 0.37923 \tabularnewline
46 & 0.031565 & 0.266 & 0.395516 \tabularnewline
47 & -0.068543 & -0.5776 & 0.282697 \tabularnewline
48 & 0.223809 & 1.8858 & 0.031703 \tabularnewline
\hline
\end{tabular}
%Source: https://freestatistics.org/blog/index.php?pk=243179&T=1

[TABLE]
[ROW][C]Autocorrelation Function[/C][/ROW]
[ROW][C]Time lag k[/C][C]ACF(k)[/C][C]T-STAT[/C][C]P-value[/C][/ROW]
[ROW][C]1[/C][C]-0.396794[/C][C]-3.3434[/C][C]0.000662[/C][/ROW]
[ROW][C]2[/C][C]0.078338[/C][C]0.6601[/C][C]0.255665[/C][/ROW]
[ROW][C]3[/C][C]-0.114318[/C][C]-0.9633[/C][C]0.169342[/C][/ROW]
[ROW][C]4[/C][C]-0.29064[/C][C]-2.449[/C][C]0.008399[/C][/ROW]
[ROW][C]5[/C][C]0.424653[/C][C]3.5782[/C][C]0.000314[/C][/ROW]
[ROW][C]6[/C][C]-0.288514[/C][C]-2.4311[/C][C]0.008791[/C][/ROW]
[ROW][C]7[/C][C]0.403651[/C][C]3.4012[/C][C]0.000552[/C][/ROW]
[ROW][C]8[/C][C]-0.391736[/C][C]-3.3008[/C][C]0.000755[/C][/ROW]
[ROW][C]9[/C][C]0.001281[/C][C]0.0108[/C][C]0.495709[/C][/ROW]
[ROW][C]10[/C][C]0.040318[/C][C]0.3397[/C][C]0.367534[/C][/ROW]
[ROW][C]11[/C][C]-0.282732[/C][C]-2.3823[/C][C]0.009942[/C][/ROW]
[ROW][C]12[/C][C]0.677374[/C][C]5.7077[/C][C]0[/C][/ROW]
[ROW][C]13[/C][C]-0.313167[/C][C]-2.6388[/C][C]0.005109[/C][/ROW]
[ROW][C]14[/C][C]0.097383[/C][C]0.8206[/C][C]0.207322[/C][/ROW]
[ROW][C]15[/C][C]-0.124272[/C][C]-1.0471[/C][C]0.149295[/C][/ROW]
[ROW][C]16[/C][C]-0.206075[/C][C]-1.7364[/C][C]0.043414[/C][/ROW]
[ROW][C]17[/C][C]0.318331[/C][C]2.6823[/C][C]0.004544[/C][/ROW]
[ROW][C]18[/C][C]-0.218865[/C][C]-1.8442[/C][C]0.034664[/C][/ROW]
[ROW][C]19[/C][C]0.358202[/C][C]3.0183[/C][C]0.001764[/C][/ROW]
[ROW][C]20[/C][C]-0.289881[/C][C]-2.4426[/C][C]0.008537[/C][/ROW]
[ROW][C]21[/C][C]-0.02212[/C][C]-0.1864[/C][C]0.426337[/C][/ROW]
[ROW][C]22[/C][C]0.019889[/C][C]0.1676[/C][C]0.433691[/C][/ROW]
[ROW][C]23[/C][C]-0.188334[/C][C]-1.5869[/C][C]0.058486[/C][/ROW]
[ROW][C]24[/C][C]0.485929[/C][C]4.0945[/C][C]5.5e-05[/C][/ROW]
[ROW][C]25[/C][C]-0.251091[/C][C]-2.1157[/C][C]0.018938[/C][/ROW]
[ROW][C]26[/C][C]0.053427[/C][C]0.4502[/C][C]0.326974[/C][/ROW]
[ROW][C]27[/C][C]-0.099048[/C][C]-0.8346[/C][C]0.203373[/C][/ROW]
[ROW][C]28[/C][C]-0.14507[/C][C]-1.2224[/C][C]0.112803[/C][/ROW]
[ROW][C]29[/C][C]0.263802[/C][C]2.2228[/C][C]0.014706[/C][/ROW]
[ROW][C]30[/C][C]-0.165419[/C][C]-1.3938[/C][C]0.083856[/C][/ROW]
[ROW][C]31[/C][C]0.226754[/C][C]1.9107[/C][C]0.030043[/C][/ROW]
[ROW][C]32[/C][C]-0.165261[/C][C]-1.3925[/C][C]0.084056[/C][/ROW]
[ROW][C]33[/C][C]-0.061121[/C][C]-0.515[/C][C]0.304072[/C][/ROW]
[ROW][C]34[/C][C]0.067615[/C][C]0.5697[/C][C]0.285327[/C][/ROW]
[ROW][C]35[/C][C]-0.152874[/C][C]-1.2881[/C][C]0.10094[/C][/ROW]
[ROW][C]36[/C][C]0.355031[/C][C]2.9915[/C][C]0.001907[/C][/ROW]
[ROW][C]37[/C][C]-0.160517[/C][C]-1.3525[/C][C]0.090248[/C][/ROW]
[ROW][C]38[/C][C]0.043012[/C][C]0.3624[/C][C]0.359055[/C][/ROW]
[ROW][C]39[/C][C]-0.077747[/C][C]-0.6551[/C][C]0.257259[/C][/ROW]
[ROW][C]40[/C][C]-0.120054[/C][C]-1.0116[/C][C]0.157584[/C][/ROW]
[ROW][C]41[/C][C]0.193758[/C][C]1.6326[/C][C]0.053487[/C][/ROW]
[ROW][C]42[/C][C]-0.103245[/C][C]-0.87[/C][C]0.193627[/C][/ROW]
[ROW][C]43[/C][C]0.152554[/C][C]1.2854[/C][C]0.101408[/C][/ROW]
[ROW][C]44[/C][C]-0.163807[/C][C]-1.3803[/C][C]0.085918[/C][/ROW]
[ROW][C]45[/C][C]-0.036635[/C][C]-0.3087[/C][C]0.37923[/C][/ROW]
[ROW][C]46[/C][C]0.031565[/C][C]0.266[/C][C]0.395516[/C][/ROW]
[ROW][C]47[/C][C]-0.068543[/C][C]-0.5776[/C][C]0.282697[/C][/ROW]
[ROW][C]48[/C][C]0.223809[/C][C]1.8858[/C][C]0.031703[/C][/ROW]
[/TABLE]
Source: https://freestatistics.org/blog/index.php?pk=243179&T=1

Globally Unique Identifier (entire table): ba.freestatistics.org/blog/index.php?pk=243179&T=1

As an alternative you can also use a QR Code:  

The GUIDs for individual cells are displayed in the table below:

Autocorrelation Function
Time lag kACF(k)T-STATP-value
1-0.396794-3.34340.000662
20.0783380.66010.255665
3-0.114318-0.96330.169342
4-0.29064-2.4490.008399
50.4246533.57820.000314
6-0.288514-2.43110.008791
70.4036513.40120.000552
8-0.391736-3.30080.000755
90.0012810.01080.495709
100.0403180.33970.367534
11-0.282732-2.38230.009942
120.6773745.70770
13-0.313167-2.63880.005109
140.0973830.82060.207322
15-0.124272-1.04710.149295
16-0.206075-1.73640.043414
170.3183312.68230.004544
18-0.218865-1.84420.034664
190.3582023.01830.001764
20-0.289881-2.44260.008537
21-0.02212-0.18640.426337
220.0198890.16760.433691
23-0.188334-1.58690.058486
240.4859294.09455.5e-05
25-0.251091-2.11570.018938
260.0534270.45020.326974
27-0.099048-0.83460.203373
28-0.14507-1.22240.112803
290.2638022.22280.014706
30-0.165419-1.39380.083856
310.2267541.91070.030043
32-0.165261-1.39250.084056
33-0.061121-0.5150.304072
340.0676150.56970.285327
35-0.152874-1.28810.10094
360.3550312.99150.001907
37-0.160517-1.35250.090248
380.0430120.36240.359055
39-0.077747-0.65510.257259
40-0.120054-1.01160.157584
410.1937581.63260.053487
42-0.103245-0.870.193627
430.1525541.28540.101408
44-0.163807-1.38030.085918
45-0.036635-0.30870.37923
460.0315650.2660.395516
47-0.068543-0.57760.282697
480.2238091.88580.031703


Partial Autocorrelation Function
Time lag kPACF(k)T-STATP-value
1-0.396794-3.34340.000662
2-0.093889-0.79110.215752
3-0.140782-1.18620.11974
4-0.470927-3.96818.6e-05
50.1412711.19040.118932
6-0.159756-1.34610.091271
70.2608362.19780.015611
8-0.310102-2.6130.005475
9-0.036171-0.30480.380711
10-0.253105-2.13270.018204
11-0.315279-2.65660.004871
120.2986732.51670.007054
130.1839681.55010.062777
14-0.072046-0.60710.27287
150.1002540.84480.200543
16-0.085347-0.71910.237205
17-0.078824-0.66420.254361
18-0.096921-0.81670.208424
190.0251580.2120.416363
200.1196871.00850.15832
210.0118250.09960.460457
22-0.0672-0.56620.286508
230.0783260.660.255698
24-0.031782-0.26780.394814
25-0.043762-0.36870.356707
26-0.145596-1.22680.111972
270.0305190.25720.398901
28-0.028401-0.23930.405776
290.0245390.20680.41839
30-0.016777-0.14140.44399
31-0.07191-0.60590.273248
32-0.016032-0.13510.446461
33-0.076146-0.64160.261594
34-0.023624-0.19910.421393
350.0143180.12060.452157
360.0121250.10220.459456
370.0774010.65220.258191
380.1173090.98850.163142
39-0.044588-0.37570.354129
400.0588850.49620.310653
41-0.097565-0.82210.206888
420.0495580.41760.338755
43-0.030642-0.25820.398502
44-0.107651-0.90710.183715
450.0345380.2910.385941
46-0.03212-0.27060.393723
47-0.040446-0.34080.367127
48-0.049912-0.42060.337671

\begin{tabular}{lllllllll}
\hline
Partial Autocorrelation Function \tabularnewline
Time lag k & PACF(k) & T-STAT & P-value \tabularnewline
1 & -0.396794 & -3.3434 & 0.000662 \tabularnewline
2 & -0.093889 & -0.7911 & 0.215752 \tabularnewline
3 & -0.140782 & -1.1862 & 0.11974 \tabularnewline
4 & -0.470927 & -3.9681 & 8.6e-05 \tabularnewline
5 & 0.141271 & 1.1904 & 0.118932 \tabularnewline
6 & -0.159756 & -1.3461 & 0.091271 \tabularnewline
7 & 0.260836 & 2.1978 & 0.015611 \tabularnewline
8 & -0.310102 & -2.613 & 0.005475 \tabularnewline
9 & -0.036171 & -0.3048 & 0.380711 \tabularnewline
10 & -0.253105 & -2.1327 & 0.018204 \tabularnewline
11 & -0.315279 & -2.6566 & 0.004871 \tabularnewline
12 & 0.298673 & 2.5167 & 0.007054 \tabularnewline
13 & 0.183968 & 1.5501 & 0.062777 \tabularnewline
14 & -0.072046 & -0.6071 & 0.27287 \tabularnewline
15 & 0.100254 & 0.8448 & 0.200543 \tabularnewline
16 & -0.085347 & -0.7191 & 0.237205 \tabularnewline
17 & -0.078824 & -0.6642 & 0.254361 \tabularnewline
18 & -0.096921 & -0.8167 & 0.208424 \tabularnewline
19 & 0.025158 & 0.212 & 0.416363 \tabularnewline
20 & 0.119687 & 1.0085 & 0.15832 \tabularnewline
21 & 0.011825 & 0.0996 & 0.460457 \tabularnewline
22 & -0.0672 & -0.5662 & 0.286508 \tabularnewline
23 & 0.078326 & 0.66 & 0.255698 \tabularnewline
24 & -0.031782 & -0.2678 & 0.394814 \tabularnewline
25 & -0.043762 & -0.3687 & 0.356707 \tabularnewline
26 & -0.145596 & -1.2268 & 0.111972 \tabularnewline
27 & 0.030519 & 0.2572 & 0.398901 \tabularnewline
28 & -0.028401 & -0.2393 & 0.405776 \tabularnewline
29 & 0.024539 & 0.2068 & 0.41839 \tabularnewline
30 & -0.016777 & -0.1414 & 0.44399 \tabularnewline
31 & -0.07191 & -0.6059 & 0.273248 \tabularnewline
32 & -0.016032 & -0.1351 & 0.446461 \tabularnewline
33 & -0.076146 & -0.6416 & 0.261594 \tabularnewline
34 & -0.023624 & -0.1991 & 0.421393 \tabularnewline
35 & 0.014318 & 0.1206 & 0.452157 \tabularnewline
36 & 0.012125 & 0.1022 & 0.459456 \tabularnewline
37 & 0.077401 & 0.6522 & 0.258191 \tabularnewline
38 & 0.117309 & 0.9885 & 0.163142 \tabularnewline
39 & -0.044588 & -0.3757 & 0.354129 \tabularnewline
40 & 0.058885 & 0.4962 & 0.310653 \tabularnewline
41 & -0.097565 & -0.8221 & 0.206888 \tabularnewline
42 & 0.049558 & 0.4176 & 0.338755 \tabularnewline
43 & -0.030642 & -0.2582 & 0.398502 \tabularnewline
44 & -0.107651 & -0.9071 & 0.183715 \tabularnewline
45 & 0.034538 & 0.291 & 0.385941 \tabularnewline
46 & -0.03212 & -0.2706 & 0.393723 \tabularnewline
47 & -0.040446 & -0.3408 & 0.367127 \tabularnewline
48 & -0.049912 & -0.4206 & 0.337671 \tabularnewline
\hline
\end{tabular}
%Source: https://freestatistics.org/blog/index.php?pk=243179&T=2

[TABLE]
[ROW][C]Partial Autocorrelation Function[/C][/ROW]
[ROW][C]Time lag k[/C][C]PACF(k)[/C][C]T-STAT[/C][C]P-value[/C][/ROW]
[ROW][C]1[/C][C]-0.396794[/C][C]-3.3434[/C][C]0.000662[/C][/ROW]
[ROW][C]2[/C][C]-0.093889[/C][C]-0.7911[/C][C]0.215752[/C][/ROW]
[ROW][C]3[/C][C]-0.140782[/C][C]-1.1862[/C][C]0.11974[/C][/ROW]
[ROW][C]4[/C][C]-0.470927[/C][C]-3.9681[/C][C]8.6e-05[/C][/ROW]
[ROW][C]5[/C][C]0.141271[/C][C]1.1904[/C][C]0.118932[/C][/ROW]
[ROW][C]6[/C][C]-0.159756[/C][C]-1.3461[/C][C]0.091271[/C][/ROW]
[ROW][C]7[/C][C]0.260836[/C][C]2.1978[/C][C]0.015611[/C][/ROW]
[ROW][C]8[/C][C]-0.310102[/C][C]-2.613[/C][C]0.005475[/C][/ROW]
[ROW][C]9[/C][C]-0.036171[/C][C]-0.3048[/C][C]0.380711[/C][/ROW]
[ROW][C]10[/C][C]-0.253105[/C][C]-2.1327[/C][C]0.018204[/C][/ROW]
[ROW][C]11[/C][C]-0.315279[/C][C]-2.6566[/C][C]0.004871[/C][/ROW]
[ROW][C]12[/C][C]0.298673[/C][C]2.5167[/C][C]0.007054[/C][/ROW]
[ROW][C]13[/C][C]0.183968[/C][C]1.5501[/C][C]0.062777[/C][/ROW]
[ROW][C]14[/C][C]-0.072046[/C][C]-0.6071[/C][C]0.27287[/C][/ROW]
[ROW][C]15[/C][C]0.100254[/C][C]0.8448[/C][C]0.200543[/C][/ROW]
[ROW][C]16[/C][C]-0.085347[/C][C]-0.7191[/C][C]0.237205[/C][/ROW]
[ROW][C]17[/C][C]-0.078824[/C][C]-0.6642[/C][C]0.254361[/C][/ROW]
[ROW][C]18[/C][C]-0.096921[/C][C]-0.8167[/C][C]0.208424[/C][/ROW]
[ROW][C]19[/C][C]0.025158[/C][C]0.212[/C][C]0.416363[/C][/ROW]
[ROW][C]20[/C][C]0.119687[/C][C]1.0085[/C][C]0.15832[/C][/ROW]
[ROW][C]21[/C][C]0.011825[/C][C]0.0996[/C][C]0.460457[/C][/ROW]
[ROW][C]22[/C][C]-0.0672[/C][C]-0.5662[/C][C]0.286508[/C][/ROW]
[ROW][C]23[/C][C]0.078326[/C][C]0.66[/C][C]0.255698[/C][/ROW]
[ROW][C]24[/C][C]-0.031782[/C][C]-0.2678[/C][C]0.394814[/C][/ROW]
[ROW][C]25[/C][C]-0.043762[/C][C]-0.3687[/C][C]0.356707[/C][/ROW]
[ROW][C]26[/C][C]-0.145596[/C][C]-1.2268[/C][C]0.111972[/C][/ROW]
[ROW][C]27[/C][C]0.030519[/C][C]0.2572[/C][C]0.398901[/C][/ROW]
[ROW][C]28[/C][C]-0.028401[/C][C]-0.2393[/C][C]0.405776[/C][/ROW]
[ROW][C]29[/C][C]0.024539[/C][C]0.2068[/C][C]0.41839[/C][/ROW]
[ROW][C]30[/C][C]-0.016777[/C][C]-0.1414[/C][C]0.44399[/C][/ROW]
[ROW][C]31[/C][C]-0.07191[/C][C]-0.6059[/C][C]0.273248[/C][/ROW]
[ROW][C]32[/C][C]-0.016032[/C][C]-0.1351[/C][C]0.446461[/C][/ROW]
[ROW][C]33[/C][C]-0.076146[/C][C]-0.6416[/C][C]0.261594[/C][/ROW]
[ROW][C]34[/C][C]-0.023624[/C][C]-0.1991[/C][C]0.421393[/C][/ROW]
[ROW][C]35[/C][C]0.014318[/C][C]0.1206[/C][C]0.452157[/C][/ROW]
[ROW][C]36[/C][C]0.012125[/C][C]0.1022[/C][C]0.459456[/C][/ROW]
[ROW][C]37[/C][C]0.077401[/C][C]0.6522[/C][C]0.258191[/C][/ROW]
[ROW][C]38[/C][C]0.117309[/C][C]0.9885[/C][C]0.163142[/C][/ROW]
[ROW][C]39[/C][C]-0.044588[/C][C]-0.3757[/C][C]0.354129[/C][/ROW]
[ROW][C]40[/C][C]0.058885[/C][C]0.4962[/C][C]0.310653[/C][/ROW]
[ROW][C]41[/C][C]-0.097565[/C][C]-0.8221[/C][C]0.206888[/C][/ROW]
[ROW][C]42[/C][C]0.049558[/C][C]0.4176[/C][C]0.338755[/C][/ROW]
[ROW][C]43[/C][C]-0.030642[/C][C]-0.2582[/C][C]0.398502[/C][/ROW]
[ROW][C]44[/C][C]-0.107651[/C][C]-0.9071[/C][C]0.183715[/C][/ROW]
[ROW][C]45[/C][C]0.034538[/C][C]0.291[/C][C]0.385941[/C][/ROW]
[ROW][C]46[/C][C]-0.03212[/C][C]-0.2706[/C][C]0.393723[/C][/ROW]
[ROW][C]47[/C][C]-0.040446[/C][C]-0.3408[/C][C]0.367127[/C][/ROW]
[ROW][C]48[/C][C]-0.049912[/C][C]-0.4206[/C][C]0.337671[/C][/ROW]
[/TABLE]
Source: https://freestatistics.org/blog/index.php?pk=243179&T=2

Globally Unique Identifier (entire table): ba.freestatistics.org/blog/index.php?pk=243179&T=2

As an alternative you can also use a QR Code:  

The GUIDs for individual cells are displayed in the table below:

Partial Autocorrelation Function
Time lag kPACF(k)T-STATP-value
1-0.396794-3.34340.000662
2-0.093889-0.79110.215752
3-0.140782-1.18620.11974
4-0.470927-3.96818.6e-05
50.1412711.19040.118932
6-0.159756-1.34610.091271
70.2608362.19780.015611
8-0.310102-2.6130.005475
9-0.036171-0.30480.380711
10-0.253105-2.13270.018204
11-0.315279-2.65660.004871
120.2986732.51670.007054
130.1839681.55010.062777
14-0.072046-0.60710.27287
150.1002540.84480.200543
16-0.085347-0.71910.237205
17-0.078824-0.66420.254361
18-0.096921-0.81670.208424
190.0251580.2120.416363
200.1196871.00850.15832
210.0118250.09960.460457
22-0.0672-0.56620.286508
230.0783260.660.255698
24-0.031782-0.26780.394814
25-0.043762-0.36870.356707
26-0.145596-1.22680.111972
270.0305190.25720.398901
28-0.028401-0.23930.405776
290.0245390.20680.41839
30-0.016777-0.14140.44399
31-0.07191-0.60590.273248
32-0.016032-0.13510.446461
33-0.076146-0.64160.261594
34-0.023624-0.19910.421393
350.0143180.12060.452157
360.0121250.10220.459456
370.0774010.65220.258191
380.1173090.98850.163142
39-0.044588-0.37570.354129
400.0588850.49620.310653
41-0.097565-0.82210.206888
420.0495580.41760.338755
43-0.030642-0.25820.398502
44-0.107651-0.90710.183715
450.0345380.2910.385941
46-0.03212-0.27060.393723
47-0.040446-0.34080.367127
48-0.049912-0.42060.337671


Parameters (Session):
par1 = 48 ; par2 = 1 ; par3 = 1 ; par4 = 0 ; par5 = 12 ; par6 = White Noise ; par7 = 0.95 ;
Parameters (R input):
par1 = 48 ; par2 = 1 ; par3 = 1 ; par4 = 0 ; par5 = 12 ; par6 = White Noise ; par7 = 0.95 ; par8 = ;
R code (references can be found in the software module):
if (par1 == 'Default') {
par1 = 10*log10(length(x))
} else {
par1 <- as.numeric(par1)
}
par2 <- as.numeric(par2)
par3 <- as.numeric(par3)
par4 <- as.numeric(par4)
par5 <- as.numeric(par5)
if (par6 == 'White Noise') par6 <- 'white' else par6 <- 'ma'
par7 <- as.numeric(par7)
if (par8 != '') par8 <- as.numeric(par8)
ox <- x
if (par8 == '') {
if (par2 == 0) {
x <- log(x)
} else {
x <- (x ^ par2 - 1) / par2
}
} else {
x <- log(x,base=par8)
}
if (par3 > 0) x <- diff(x,lag=1,difference=par3)
if (par4 > 0) x <- diff(x,lag=par5,difference=par4)
bitmap(file='picts.png')
op <- par(mfrow=c(2,1))
plot(ox,type='l',main='Original Time Series',xlab='time',ylab='value')
if (par8=='') {
mytitle <- paste('Working Time Series (lambda=',par2,', d=',par3,', D=',par4,')',sep='')
mysub <- paste('(lambda=',par2,', d=',par3,', D=',par4,', CI=', par7, ', CI type=',par6,')',sep='')
} else {
mytitle <- paste('Working Time Series (base=',par8,', d=',par3,', D=',par4,')',sep='')
mysub <- paste('(base=',par8,', d=',par3,', D=',par4,', CI=', par7, ', CI type=',par6,')',sep='')
}
plot(x,type='l', main=mytitle,xlab='time',ylab='value')
par(op)
dev.off()
bitmap(file='pic1.png')
racf <- acf(x, par1, main='Autocorrelation', xlab='time lag', ylab='ACF', ci.type=par6, ci=par7, sub=mysub)
dev.off()
bitmap(file='pic2.png')
rpacf <- pacf(x,par1,main='Partial Autocorrelation',xlab='lags',ylab='PACF',sub=mysub)
dev.off()
(myacf <- c(racf$acf))
(mypacf <- c(rpacf$acf))
lengthx <- length(x)
sqrtn <- sqrt(lengthx)
load(file='createtable')
a<-table.start()
a<-table.row.start(a)
a<-table.element(a,'Autocorrelation Function',4,TRUE)
a<-table.row.end(a)
a<-table.row.start(a)
a<-table.element(a,'Time lag k',header=TRUE)
a<-table.element(a,hyperlink('basics.htm','ACF(k)','click here for more information about the Autocorrelation Function'),header=TRUE)
a<-table.element(a,'T-STAT',header=TRUE)
a<-table.element(a,'P-value',header=TRUE)
a<-table.row.end(a)
for (i in 2:(par1+1)) {
a<-table.row.start(a)
a<-table.element(a,i-1,header=TRUE)
a<-table.element(a,round(myacf[i],6))
mytstat <- myacf[i]*sqrtn
a<-table.element(a,round(mytstat,4))
a<-table.element(a,round(1-pt(abs(mytstat),lengthx),6))
a<-table.row.end(a)
}
a<-table.end(a)
table.save(a,file='mytable.tab')
a<-table.start()
a<-table.row.start(a)
a<-table.element(a,'Partial Autocorrelation Function',4,TRUE)
a<-table.row.end(a)
a<-table.row.start(a)
a<-table.element(a,'Time lag k',header=TRUE)
a<-table.element(a,hyperlink('basics.htm','PACF(k)','click here for more information about the Partial Autocorrelation Function'),header=TRUE)
a<-table.element(a,'T-STAT',header=TRUE)
a<-table.element(a,'P-value',header=TRUE)
a<-table.row.end(a)
for (i in 1:par1) {
a<-table.row.start(a)
a<-table.element(a,i,header=TRUE)
a<-table.element(a,round(mypacf[i],6))
mytstat <- mypacf[i]*sqrtn
a<-table.element(a,round(mytstat,4))
a<-table.element(a,round(1-pt(abs(mytstat),lengthx),6))
a<-table.row.end(a)
}
a<-table.end(a)
table.save(a,file='mytable1.tab')