Free Statistics

of Irreproducible Research!

Author's title

Author*Unverified author*
R Software Modulerwasp_autocorrelation.wasp
Title produced by software(Partial) Autocorrelation Function
Date of computationFri, 17 Oct 2014 09:24:10 +0100
Cite this page as followsStatistical Computations at FreeStatistics.org, Office for Research Development and Education, URL https://freestatistics.org/blog/index.php?v=date/2014/Oct/17/t1413534327lcir8iel4jndzdz.htm/, Retrieved Fri, 10 May 2024 02:20:02 +0000
Statistical Computations at FreeStatistics.org, Office for Research Development and Education, URL https://freestatistics.org/blog/index.php?pk=243173, Retrieved Fri, 10 May 2024 02:20:02 +0000
QR Codes:

Original text written by user:
IsPrivate?No (this computation is public)
User-defined keywords
Estimated Impact105
Family? (F = Feedback message, R = changed R code, M = changed R Module, P = changed Parameters, D = changed Data)
-       [(Partial) Autocorrelation Function] [Partial Autocorre...] [2014-10-17 08:24:10] [8ab2f7883acfec92c4c89513940c9803] [Current]
Feedback Forum

Post a new message
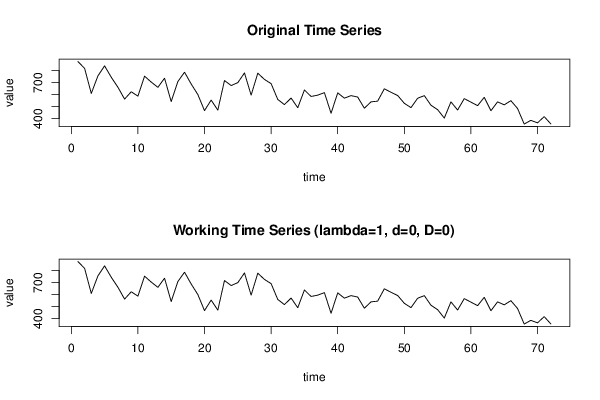
Dataseries X:
876
819
610
757
840
745
662
563
624
588
754
705
661
737
542
709
787
689
601
467
555
471
718
676
700
781
596
779
727
692
560
517
572
491
639
585
596
617
445
615
571
592
580
487
540
546
649
620
593
528
492
570
592
512
475
405
540
472
567
538
508
578
466
540
515
550
485
355
386
365
417
356


Summary of computational transaction
Raw Inputview raw input (R code)
Raw Outputview raw output of R engine
Computing time2 seconds
R Server'Gwilym Jenkins' @ jenkins.wessa.net

\begin{tabular}{lllllllll}
\hline
Summary of computational transaction \tabularnewline
Raw Input & view raw input (R code)  \tabularnewline
Raw Output & view raw output of R engine  \tabularnewline
Computing time & 2 seconds \tabularnewline
R Server & 'Gwilym Jenkins' @ jenkins.wessa.net \tabularnewline
\hline
\end{tabular}
%Source: https://freestatistics.org/blog/index.php?pk=243173&T=0

[TABLE]
[ROW][C]Summary of computational transaction[/C][/ROW]
[ROW][C]Raw Input[/C][C]view raw input (R code) [/C][/ROW]
[ROW][C]Raw Output[/C][C]view raw output of R engine [/C][/ROW]
[ROW][C]Computing time[/C][C]2 seconds[/C][/ROW]
[ROW][C]R Server[/C][C]'Gwilym Jenkins' @ jenkins.wessa.net[/C][/ROW]
[/TABLE]
Source: https://freestatistics.org/blog/index.php?pk=243173&T=0

Globally Unique Identifier (entire table): ba.freestatistics.org/blog/index.php?pk=243173&T=0

As an alternative you can also use a QR Code:  

The GUIDs for individual cells are displayed in the table below:

Summary of computational transaction
Raw Inputview raw input (R code)
Raw Outputview raw output of R engine
Computing time2 seconds
R Server'Gwilym Jenkins' @ jenkins.wessa.net


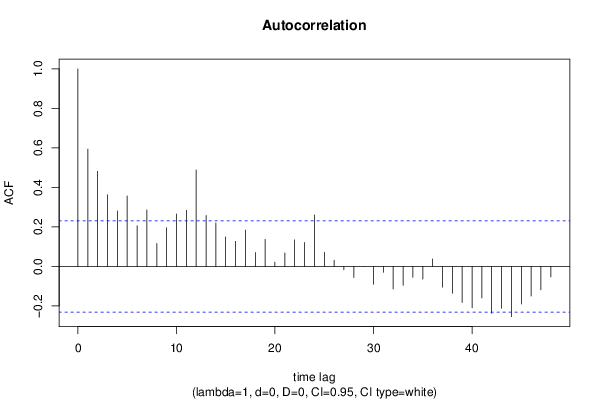
Autocorrelation Function
Time lag kACF(k)T-STATP-value
10.5940035.04032e-06
20.4814734.08545.6e-05
30.3633213.08290.001453
40.2806962.38180.009937
50.3568823.02820.001706
60.2057241.74560.042571
70.2860872.42750.008852
80.1164150.98780.163277
90.1957261.66080.050552
100.2656412.2540.013619
110.2849272.41770.009076
120.4887974.14764.5e-05
130.2582122.1910.015844
140.2197321.86450.033165
150.1491931.26590.104806
160.1270581.07810.142288
170.1839471.56080.061473
180.0708250.6010.274873
190.1369491.1620.124527
200.0217410.18450.427078
210.0683870.58030.281767
220.1347751.14360.128288
230.1216091.03190.15279
240.2602782.20850.015196
250.0715620.60720.272806
260.031610.26820.39465
27-0.016353-0.13880.445015
28-0.056297-0.47770.317156
29-2e-05-2e-040.499934
30-0.09012-0.76470.223476
31-0.029564-0.25090.40132
32-0.114351-0.97030.167572
33-0.095655-0.81170.20983
34-0.055134-0.46780.320661
35-0.064072-0.54370.294173
360.0381450.32370.373562
37-0.104913-0.89020.188158
38-0.135762-1.1520.126571
39-0.182137-1.54550.063307
40-0.209363-1.77650.039937
41-0.159176-1.35070.090518
42-0.236901-2.01020.02408
43-0.212046-1.79930.038083
44-0.254204-2.1570.017173
45-0.190548-1.61690.055142
46-0.149918-1.27210.103715
47-0.11789-1.00030.160251
48-0.052861-0.44850.327554

\begin{tabular}{lllllllll}
\hline
Autocorrelation Function \tabularnewline
Time lag k & ACF(k) & T-STAT & P-value \tabularnewline
1 & 0.594003 & 5.0403 & 2e-06 \tabularnewline
2 & 0.481473 & 4.0854 & 5.6e-05 \tabularnewline
3 & 0.363321 & 3.0829 & 0.001453 \tabularnewline
4 & 0.280696 & 2.3818 & 0.009937 \tabularnewline
5 & 0.356882 & 3.0282 & 0.001706 \tabularnewline
6 & 0.205724 & 1.7456 & 0.042571 \tabularnewline
7 & 0.286087 & 2.4275 & 0.008852 \tabularnewline
8 & 0.116415 & 0.9878 & 0.163277 \tabularnewline
9 & 0.195726 & 1.6608 & 0.050552 \tabularnewline
10 & 0.265641 & 2.254 & 0.013619 \tabularnewline
11 & 0.284927 & 2.4177 & 0.009076 \tabularnewline
12 & 0.488797 & 4.1476 & 4.5e-05 \tabularnewline
13 & 0.258212 & 2.191 & 0.015844 \tabularnewline
14 & 0.219732 & 1.8645 & 0.033165 \tabularnewline
15 & 0.149193 & 1.2659 & 0.104806 \tabularnewline
16 & 0.127058 & 1.0781 & 0.142288 \tabularnewline
17 & 0.183947 & 1.5608 & 0.061473 \tabularnewline
18 & 0.070825 & 0.601 & 0.274873 \tabularnewline
19 & 0.136949 & 1.162 & 0.124527 \tabularnewline
20 & 0.021741 & 0.1845 & 0.427078 \tabularnewline
21 & 0.068387 & 0.5803 & 0.281767 \tabularnewline
22 & 0.134775 & 1.1436 & 0.128288 \tabularnewline
23 & 0.121609 & 1.0319 & 0.15279 \tabularnewline
24 & 0.260278 & 2.2085 & 0.015196 \tabularnewline
25 & 0.071562 & 0.6072 & 0.272806 \tabularnewline
26 & 0.03161 & 0.2682 & 0.39465 \tabularnewline
27 & -0.016353 & -0.1388 & 0.445015 \tabularnewline
28 & -0.056297 & -0.4777 & 0.317156 \tabularnewline
29 & -2e-05 & -2e-04 & 0.499934 \tabularnewline
30 & -0.09012 & -0.7647 & 0.223476 \tabularnewline
31 & -0.029564 & -0.2509 & 0.40132 \tabularnewline
32 & -0.114351 & -0.9703 & 0.167572 \tabularnewline
33 & -0.095655 & -0.8117 & 0.20983 \tabularnewline
34 & -0.055134 & -0.4678 & 0.320661 \tabularnewline
35 & -0.064072 & -0.5437 & 0.294173 \tabularnewline
36 & 0.038145 & 0.3237 & 0.373562 \tabularnewline
37 & -0.104913 & -0.8902 & 0.188158 \tabularnewline
38 & -0.135762 & -1.152 & 0.126571 \tabularnewline
39 & -0.182137 & -1.5455 & 0.063307 \tabularnewline
40 & -0.209363 & -1.7765 & 0.039937 \tabularnewline
41 & -0.159176 & -1.3507 & 0.090518 \tabularnewline
42 & -0.236901 & -2.0102 & 0.02408 \tabularnewline
43 & -0.212046 & -1.7993 & 0.038083 \tabularnewline
44 & -0.254204 & -2.157 & 0.017173 \tabularnewline
45 & -0.190548 & -1.6169 & 0.055142 \tabularnewline
46 & -0.149918 & -1.2721 & 0.103715 \tabularnewline
47 & -0.11789 & -1.0003 & 0.160251 \tabularnewline
48 & -0.052861 & -0.4485 & 0.327554 \tabularnewline
\hline
\end{tabular}
%Source: https://freestatistics.org/blog/index.php?pk=243173&T=1

[TABLE]
[ROW][C]Autocorrelation Function[/C][/ROW]
[ROW][C]Time lag k[/C][C]ACF(k)[/C][C]T-STAT[/C][C]P-value[/C][/ROW]
[ROW][C]1[/C][C]0.594003[/C][C]5.0403[/C][C]2e-06[/C][/ROW]
[ROW][C]2[/C][C]0.481473[/C][C]4.0854[/C][C]5.6e-05[/C][/ROW]
[ROW][C]3[/C][C]0.363321[/C][C]3.0829[/C][C]0.001453[/C][/ROW]
[ROW][C]4[/C][C]0.280696[/C][C]2.3818[/C][C]0.009937[/C][/ROW]
[ROW][C]5[/C][C]0.356882[/C][C]3.0282[/C][C]0.001706[/C][/ROW]
[ROW][C]6[/C][C]0.205724[/C][C]1.7456[/C][C]0.042571[/C][/ROW]
[ROW][C]7[/C][C]0.286087[/C][C]2.4275[/C][C]0.008852[/C][/ROW]
[ROW][C]8[/C][C]0.116415[/C][C]0.9878[/C][C]0.163277[/C][/ROW]
[ROW][C]9[/C][C]0.195726[/C][C]1.6608[/C][C]0.050552[/C][/ROW]
[ROW][C]10[/C][C]0.265641[/C][C]2.254[/C][C]0.013619[/C][/ROW]
[ROW][C]11[/C][C]0.284927[/C][C]2.4177[/C][C]0.009076[/C][/ROW]
[ROW][C]12[/C][C]0.488797[/C][C]4.1476[/C][C]4.5e-05[/C][/ROW]
[ROW][C]13[/C][C]0.258212[/C][C]2.191[/C][C]0.015844[/C][/ROW]
[ROW][C]14[/C][C]0.219732[/C][C]1.8645[/C][C]0.033165[/C][/ROW]
[ROW][C]15[/C][C]0.149193[/C][C]1.2659[/C][C]0.104806[/C][/ROW]
[ROW][C]16[/C][C]0.127058[/C][C]1.0781[/C][C]0.142288[/C][/ROW]
[ROW][C]17[/C][C]0.183947[/C][C]1.5608[/C][C]0.061473[/C][/ROW]
[ROW][C]18[/C][C]0.070825[/C][C]0.601[/C][C]0.274873[/C][/ROW]
[ROW][C]19[/C][C]0.136949[/C][C]1.162[/C][C]0.124527[/C][/ROW]
[ROW][C]20[/C][C]0.021741[/C][C]0.1845[/C][C]0.427078[/C][/ROW]
[ROW][C]21[/C][C]0.068387[/C][C]0.5803[/C][C]0.281767[/C][/ROW]
[ROW][C]22[/C][C]0.134775[/C][C]1.1436[/C][C]0.128288[/C][/ROW]
[ROW][C]23[/C][C]0.121609[/C][C]1.0319[/C][C]0.15279[/C][/ROW]
[ROW][C]24[/C][C]0.260278[/C][C]2.2085[/C][C]0.015196[/C][/ROW]
[ROW][C]25[/C][C]0.071562[/C][C]0.6072[/C][C]0.272806[/C][/ROW]
[ROW][C]26[/C][C]0.03161[/C][C]0.2682[/C][C]0.39465[/C][/ROW]
[ROW][C]27[/C][C]-0.016353[/C][C]-0.1388[/C][C]0.445015[/C][/ROW]
[ROW][C]28[/C][C]-0.056297[/C][C]-0.4777[/C][C]0.317156[/C][/ROW]
[ROW][C]29[/C][C]-2e-05[/C][C]-2e-04[/C][C]0.499934[/C][/ROW]
[ROW][C]30[/C][C]-0.09012[/C][C]-0.7647[/C][C]0.223476[/C][/ROW]
[ROW][C]31[/C][C]-0.029564[/C][C]-0.2509[/C][C]0.40132[/C][/ROW]
[ROW][C]32[/C][C]-0.114351[/C][C]-0.9703[/C][C]0.167572[/C][/ROW]
[ROW][C]33[/C][C]-0.095655[/C][C]-0.8117[/C][C]0.20983[/C][/ROW]
[ROW][C]34[/C][C]-0.055134[/C][C]-0.4678[/C][C]0.320661[/C][/ROW]
[ROW][C]35[/C][C]-0.064072[/C][C]-0.5437[/C][C]0.294173[/C][/ROW]
[ROW][C]36[/C][C]0.038145[/C][C]0.3237[/C][C]0.373562[/C][/ROW]
[ROW][C]37[/C][C]-0.104913[/C][C]-0.8902[/C][C]0.188158[/C][/ROW]
[ROW][C]38[/C][C]-0.135762[/C][C]-1.152[/C][C]0.126571[/C][/ROW]
[ROW][C]39[/C][C]-0.182137[/C][C]-1.5455[/C][C]0.063307[/C][/ROW]
[ROW][C]40[/C][C]-0.209363[/C][C]-1.7765[/C][C]0.039937[/C][/ROW]
[ROW][C]41[/C][C]-0.159176[/C][C]-1.3507[/C][C]0.090518[/C][/ROW]
[ROW][C]42[/C][C]-0.236901[/C][C]-2.0102[/C][C]0.02408[/C][/ROW]
[ROW][C]43[/C][C]-0.212046[/C][C]-1.7993[/C][C]0.038083[/C][/ROW]
[ROW][C]44[/C][C]-0.254204[/C][C]-2.157[/C][C]0.017173[/C][/ROW]
[ROW][C]45[/C][C]-0.190548[/C][C]-1.6169[/C][C]0.055142[/C][/ROW]
[ROW][C]46[/C][C]-0.149918[/C][C]-1.2721[/C][C]0.103715[/C][/ROW]
[ROW][C]47[/C][C]-0.11789[/C][C]-1.0003[/C][C]0.160251[/C][/ROW]
[ROW][C]48[/C][C]-0.052861[/C][C]-0.4485[/C][C]0.327554[/C][/ROW]
[/TABLE]
Source: https://freestatistics.org/blog/index.php?pk=243173&T=1

Globally Unique Identifier (entire table): ba.freestatistics.org/blog/index.php?pk=243173&T=1

As an alternative you can also use a QR Code:  

The GUIDs for individual cells are displayed in the table below:

Autocorrelation Function
Time lag kACF(k)T-STATP-value
10.5940035.04032e-06
20.4814734.08545.6e-05
30.3633213.08290.001453
40.2806962.38180.009937
50.3568823.02820.001706
60.2057241.74560.042571
70.2860872.42750.008852
80.1164150.98780.163277
90.1957261.66080.050552
100.2656412.2540.013619
110.2849272.41770.009076
120.4887974.14764.5e-05
130.2582122.1910.015844
140.2197321.86450.033165
150.1491931.26590.104806
160.1270581.07810.142288
170.1839471.56080.061473
180.0708250.6010.274873
190.1369491.1620.124527
200.0217410.18450.427078
210.0683870.58030.281767
220.1347751.14360.128288
230.1216091.03190.15279
240.2602782.20850.015196
250.0715620.60720.272806
260.031610.26820.39465
27-0.016353-0.13880.445015
28-0.056297-0.47770.317156
29-2e-05-2e-040.499934
30-0.09012-0.76470.223476
31-0.029564-0.25090.40132
32-0.114351-0.97030.167572
33-0.095655-0.81170.20983
34-0.055134-0.46780.320661
35-0.064072-0.54370.294173
360.0381450.32370.373562
37-0.104913-0.89020.188158
38-0.135762-1.1520.126571
39-0.182137-1.54550.063307
40-0.209363-1.77650.039937
41-0.159176-1.35070.090518
42-0.236901-2.01020.02408
43-0.212046-1.79930.038083
44-0.254204-2.1570.017173
45-0.190548-1.61690.055142
46-0.149918-1.27210.103715
47-0.11789-1.00030.160251
48-0.052861-0.44850.327554


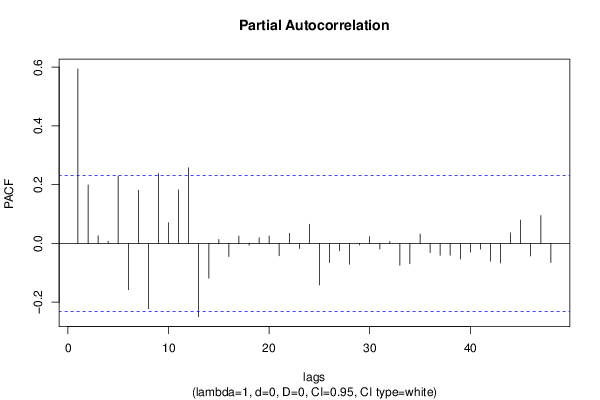
Partial Autocorrelation Function
Time lag kPACF(k)T-STATP-value
10.5940035.04032e-06
20.1987651.68660.048007
30.0259080.21980.413311
40.0072390.06140.475596
50.2292681.94540.027815
6-0.157381-1.33540.092973
70.1811331.5370.064342
8-0.221739-1.88150.031972
90.2384312.02320.023385
100.0705570.59870.275627
110.1823161.5470.063124
120.2572632.18290.016151
13-0.249107-2.11370.019001
14-0.11845-1.00510.159112
150.0137250.11650.453805
16-0.04456-0.37810.353233
170.0249650.21180.416417
18-0.005795-0.04920.480459
190.0193940.16460.434875
200.0253740.21530.415068
21-0.04189-0.35540.361646
220.0347540.29490.384459
23-0.017384-0.14750.441572
240.0651550.55290.291036
25-0.141201-1.19810.117398
26-0.064739-0.54930.292239
27-0.024615-0.20890.417572
28-0.070549-0.59860.27565
29-0.004756-0.04040.483962
300.0228250.19370.423488
31-0.019096-0.1620.435867
320.0067120.05690.477371
33-0.074389-0.63120.264951
34-0.068866-0.58430.280408
350.0317230.26920.39428
36-0.031081-0.26370.396372
37-0.040329-0.34220.366597
38-0.040299-0.34190.366694
39-0.053147-0.4510.326685
40-0.02956-0.25080.401333
41-0.019329-0.1640.435091
42-0.060248-0.51120.30538
43-0.066598-0.56510.286881
440.0359810.30530.380507
450.0795950.67540.250796
46-0.042817-0.36330.358718
470.0947980.80440.211912
48-0.064983-0.55140.291534

\begin{tabular}{lllllllll}
\hline
Partial Autocorrelation Function \tabularnewline
Time lag k & PACF(k) & T-STAT & P-value \tabularnewline
1 & 0.594003 & 5.0403 & 2e-06 \tabularnewline
2 & 0.198765 & 1.6866 & 0.048007 \tabularnewline
3 & 0.025908 & 0.2198 & 0.413311 \tabularnewline
4 & 0.007239 & 0.0614 & 0.475596 \tabularnewline
5 & 0.229268 & 1.9454 & 0.027815 \tabularnewline
6 & -0.157381 & -1.3354 & 0.092973 \tabularnewline
7 & 0.181133 & 1.537 & 0.064342 \tabularnewline
8 & -0.221739 & -1.8815 & 0.031972 \tabularnewline
9 & 0.238431 & 2.0232 & 0.023385 \tabularnewline
10 & 0.070557 & 0.5987 & 0.275627 \tabularnewline
11 & 0.182316 & 1.547 & 0.063124 \tabularnewline
12 & 0.257263 & 2.1829 & 0.016151 \tabularnewline
13 & -0.249107 & -2.1137 & 0.019001 \tabularnewline
14 & -0.11845 & -1.0051 & 0.159112 \tabularnewline
15 & 0.013725 & 0.1165 & 0.453805 \tabularnewline
16 & -0.04456 & -0.3781 & 0.353233 \tabularnewline
17 & 0.024965 & 0.2118 & 0.416417 \tabularnewline
18 & -0.005795 & -0.0492 & 0.480459 \tabularnewline
19 & 0.019394 & 0.1646 & 0.434875 \tabularnewline
20 & 0.025374 & 0.2153 & 0.415068 \tabularnewline
21 & -0.04189 & -0.3554 & 0.361646 \tabularnewline
22 & 0.034754 & 0.2949 & 0.384459 \tabularnewline
23 & -0.017384 & -0.1475 & 0.441572 \tabularnewline
24 & 0.065155 & 0.5529 & 0.291036 \tabularnewline
25 & -0.141201 & -1.1981 & 0.117398 \tabularnewline
26 & -0.064739 & -0.5493 & 0.292239 \tabularnewline
27 & -0.024615 & -0.2089 & 0.417572 \tabularnewline
28 & -0.070549 & -0.5986 & 0.27565 \tabularnewline
29 & -0.004756 & -0.0404 & 0.483962 \tabularnewline
30 & 0.022825 & 0.1937 & 0.423488 \tabularnewline
31 & -0.019096 & -0.162 & 0.435867 \tabularnewline
32 & 0.006712 & 0.0569 & 0.477371 \tabularnewline
33 & -0.074389 & -0.6312 & 0.264951 \tabularnewline
34 & -0.068866 & -0.5843 & 0.280408 \tabularnewline
35 & 0.031723 & 0.2692 & 0.39428 \tabularnewline
36 & -0.031081 & -0.2637 & 0.396372 \tabularnewline
37 & -0.040329 & -0.3422 & 0.366597 \tabularnewline
38 & -0.040299 & -0.3419 & 0.366694 \tabularnewline
39 & -0.053147 & -0.451 & 0.326685 \tabularnewline
40 & -0.02956 & -0.2508 & 0.401333 \tabularnewline
41 & -0.019329 & -0.164 & 0.435091 \tabularnewline
42 & -0.060248 & -0.5112 & 0.30538 \tabularnewline
43 & -0.066598 & -0.5651 & 0.286881 \tabularnewline
44 & 0.035981 & 0.3053 & 0.380507 \tabularnewline
45 & 0.079595 & 0.6754 & 0.250796 \tabularnewline
46 & -0.042817 & -0.3633 & 0.358718 \tabularnewline
47 & 0.094798 & 0.8044 & 0.211912 \tabularnewline
48 & -0.064983 & -0.5514 & 0.291534 \tabularnewline
\hline
\end{tabular}
%Source: https://freestatistics.org/blog/index.php?pk=243173&T=2

[TABLE]
[ROW][C]Partial Autocorrelation Function[/C][/ROW]
[ROW][C]Time lag k[/C][C]PACF(k)[/C][C]T-STAT[/C][C]P-value[/C][/ROW]
[ROW][C]1[/C][C]0.594003[/C][C]5.0403[/C][C]2e-06[/C][/ROW]
[ROW][C]2[/C][C]0.198765[/C][C]1.6866[/C][C]0.048007[/C][/ROW]
[ROW][C]3[/C][C]0.025908[/C][C]0.2198[/C][C]0.413311[/C][/ROW]
[ROW][C]4[/C][C]0.007239[/C][C]0.0614[/C][C]0.475596[/C][/ROW]
[ROW][C]5[/C][C]0.229268[/C][C]1.9454[/C][C]0.027815[/C][/ROW]
[ROW][C]6[/C][C]-0.157381[/C][C]-1.3354[/C][C]0.092973[/C][/ROW]
[ROW][C]7[/C][C]0.181133[/C][C]1.537[/C][C]0.064342[/C][/ROW]
[ROW][C]8[/C][C]-0.221739[/C][C]-1.8815[/C][C]0.031972[/C][/ROW]
[ROW][C]9[/C][C]0.238431[/C][C]2.0232[/C][C]0.023385[/C][/ROW]
[ROW][C]10[/C][C]0.070557[/C][C]0.5987[/C][C]0.275627[/C][/ROW]
[ROW][C]11[/C][C]0.182316[/C][C]1.547[/C][C]0.063124[/C][/ROW]
[ROW][C]12[/C][C]0.257263[/C][C]2.1829[/C][C]0.016151[/C][/ROW]
[ROW][C]13[/C][C]-0.249107[/C][C]-2.1137[/C][C]0.019001[/C][/ROW]
[ROW][C]14[/C][C]-0.11845[/C][C]-1.0051[/C][C]0.159112[/C][/ROW]
[ROW][C]15[/C][C]0.013725[/C][C]0.1165[/C][C]0.453805[/C][/ROW]
[ROW][C]16[/C][C]-0.04456[/C][C]-0.3781[/C][C]0.353233[/C][/ROW]
[ROW][C]17[/C][C]0.024965[/C][C]0.2118[/C][C]0.416417[/C][/ROW]
[ROW][C]18[/C][C]-0.005795[/C][C]-0.0492[/C][C]0.480459[/C][/ROW]
[ROW][C]19[/C][C]0.019394[/C][C]0.1646[/C][C]0.434875[/C][/ROW]
[ROW][C]20[/C][C]0.025374[/C][C]0.2153[/C][C]0.415068[/C][/ROW]
[ROW][C]21[/C][C]-0.04189[/C][C]-0.3554[/C][C]0.361646[/C][/ROW]
[ROW][C]22[/C][C]0.034754[/C][C]0.2949[/C][C]0.384459[/C][/ROW]
[ROW][C]23[/C][C]-0.017384[/C][C]-0.1475[/C][C]0.441572[/C][/ROW]
[ROW][C]24[/C][C]0.065155[/C][C]0.5529[/C][C]0.291036[/C][/ROW]
[ROW][C]25[/C][C]-0.141201[/C][C]-1.1981[/C][C]0.117398[/C][/ROW]
[ROW][C]26[/C][C]-0.064739[/C][C]-0.5493[/C][C]0.292239[/C][/ROW]
[ROW][C]27[/C][C]-0.024615[/C][C]-0.2089[/C][C]0.417572[/C][/ROW]
[ROW][C]28[/C][C]-0.070549[/C][C]-0.5986[/C][C]0.27565[/C][/ROW]
[ROW][C]29[/C][C]-0.004756[/C][C]-0.0404[/C][C]0.483962[/C][/ROW]
[ROW][C]30[/C][C]0.022825[/C][C]0.1937[/C][C]0.423488[/C][/ROW]
[ROW][C]31[/C][C]-0.019096[/C][C]-0.162[/C][C]0.435867[/C][/ROW]
[ROW][C]32[/C][C]0.006712[/C][C]0.0569[/C][C]0.477371[/C][/ROW]
[ROW][C]33[/C][C]-0.074389[/C][C]-0.6312[/C][C]0.264951[/C][/ROW]
[ROW][C]34[/C][C]-0.068866[/C][C]-0.5843[/C][C]0.280408[/C][/ROW]
[ROW][C]35[/C][C]0.031723[/C][C]0.2692[/C][C]0.39428[/C][/ROW]
[ROW][C]36[/C][C]-0.031081[/C][C]-0.2637[/C][C]0.396372[/C][/ROW]
[ROW][C]37[/C][C]-0.040329[/C][C]-0.3422[/C][C]0.366597[/C][/ROW]
[ROW][C]38[/C][C]-0.040299[/C][C]-0.3419[/C][C]0.366694[/C][/ROW]
[ROW][C]39[/C][C]-0.053147[/C][C]-0.451[/C][C]0.326685[/C][/ROW]
[ROW][C]40[/C][C]-0.02956[/C][C]-0.2508[/C][C]0.401333[/C][/ROW]
[ROW][C]41[/C][C]-0.019329[/C][C]-0.164[/C][C]0.435091[/C][/ROW]
[ROW][C]42[/C][C]-0.060248[/C][C]-0.5112[/C][C]0.30538[/C][/ROW]
[ROW][C]43[/C][C]-0.066598[/C][C]-0.5651[/C][C]0.286881[/C][/ROW]
[ROW][C]44[/C][C]0.035981[/C][C]0.3053[/C][C]0.380507[/C][/ROW]
[ROW][C]45[/C][C]0.079595[/C][C]0.6754[/C][C]0.250796[/C][/ROW]
[ROW][C]46[/C][C]-0.042817[/C][C]-0.3633[/C][C]0.358718[/C][/ROW]
[ROW][C]47[/C][C]0.094798[/C][C]0.8044[/C][C]0.211912[/C][/ROW]
[ROW][C]48[/C][C]-0.064983[/C][C]-0.5514[/C][C]0.291534[/C][/ROW]
[/TABLE]
Source: https://freestatistics.org/blog/index.php?pk=243173&T=2

Globally Unique Identifier (entire table): ba.freestatistics.org/blog/index.php?pk=243173&T=2

As an alternative you can also use a QR Code:  

The GUIDs for individual cells are displayed in the table below:

Partial Autocorrelation Function
Time lag kPACF(k)T-STATP-value
10.5940035.04032e-06
20.1987651.68660.048007
30.0259080.21980.413311
40.0072390.06140.475596
50.2292681.94540.027815
6-0.157381-1.33540.092973
70.1811331.5370.064342
8-0.221739-1.88150.031972
90.2384312.02320.023385
100.0705570.59870.275627
110.1823161.5470.063124
120.2572632.18290.016151
13-0.249107-2.11370.019001
14-0.11845-1.00510.159112
150.0137250.11650.453805
16-0.04456-0.37810.353233
170.0249650.21180.416417
18-0.005795-0.04920.480459
190.0193940.16460.434875
200.0253740.21530.415068
21-0.04189-0.35540.361646
220.0347540.29490.384459
23-0.017384-0.14750.441572
240.0651550.55290.291036
25-0.141201-1.19810.117398
26-0.064739-0.54930.292239
27-0.024615-0.20890.417572
28-0.070549-0.59860.27565
29-0.004756-0.04040.483962
300.0228250.19370.423488
31-0.019096-0.1620.435867
320.0067120.05690.477371
33-0.074389-0.63120.264951
34-0.068866-0.58430.280408
350.0317230.26920.39428
36-0.031081-0.26370.396372
37-0.040329-0.34220.366597
38-0.040299-0.34190.366694
39-0.053147-0.4510.326685
40-0.02956-0.25080.401333
41-0.019329-0.1640.435091
42-0.060248-0.51120.30538
43-0.066598-0.56510.286881
440.0359810.30530.380507
450.0795950.67540.250796
46-0.042817-0.36330.358718
470.0947980.80440.211912
48-0.064983-0.55140.291534


Parameters (Session):
par1 = 48 ; par2 = 1 ; par3 = 0 ; par4 = 0 ; par5 = 12 ; par6 = White Noise ; par7 = 0.95 ;
Parameters (R input):
par1 = 48 ; par2 = 1 ; par3 = 0 ; par4 = 0 ; par5 = 12 ; par6 = White Noise ; par7 = 0.95 ; par8 = ;
R code (references can be found in the software module):
if (par1 == 'Default') {
par1 = 10*log10(length(x))
} else {
par1 <- as.numeric(par1)
}
par2 <- as.numeric(par2)
par3 <- as.numeric(par3)
par4 <- as.numeric(par4)
par5 <- as.numeric(par5)
if (par6 == 'White Noise') par6 <- 'white' else par6 <- 'ma'
par7 <- as.numeric(par7)
if (par8 != '') par8 <- as.numeric(par8)
ox <- x
if (par8 == '') {
if (par2 == 0) {
x <- log(x)
} else {
x <- (x ^ par2 - 1) / par2
}
} else {
x <- log(x,base=par8)
}
if (par3 > 0) x <- diff(x,lag=1,difference=par3)
if (par4 > 0) x <- diff(x,lag=par5,difference=par4)
bitmap(file='picts.png')
op <- par(mfrow=c(2,1))
plot(ox,type='l',main='Original Time Series',xlab='time',ylab='value')
if (par8=='') {
mytitle <- paste('Working Time Series (lambda=',par2,', d=',par3,', D=',par4,')',sep='')
mysub <- paste('(lambda=',par2,', d=',par3,', D=',par4,', CI=', par7, ', CI type=',par6,')',sep='')
} else {
mytitle <- paste('Working Time Series (base=',par8,', d=',par3,', D=',par4,')',sep='')
mysub <- paste('(base=',par8,', d=',par3,', D=',par4,', CI=', par7, ', CI type=',par6,')',sep='')
}
plot(x,type='l', main=mytitle,xlab='time',ylab='value')
par(op)
dev.off()
bitmap(file='pic1.png')
racf <- acf(x, par1, main='Autocorrelation', xlab='time lag', ylab='ACF', ci.type=par6, ci=par7, sub=mysub)
dev.off()
bitmap(file='pic2.png')
rpacf <- pacf(x,par1,main='Partial Autocorrelation',xlab='lags',ylab='PACF',sub=mysub)
dev.off()
(myacf <- c(racf$acf))
(mypacf <- c(rpacf$acf))
lengthx <- length(x)
sqrtn <- sqrt(lengthx)
load(file='createtable')
a<-table.start()
a<-table.row.start(a)
a<-table.element(a,'Autocorrelation Function',4,TRUE)
a<-table.row.end(a)
a<-table.row.start(a)
a<-table.element(a,'Time lag k',header=TRUE)
a<-table.element(a,hyperlink('basics.htm','ACF(k)','click here for more information about the Autocorrelation Function'),header=TRUE)
a<-table.element(a,'T-STAT',header=TRUE)
a<-table.element(a,'P-value',header=TRUE)
a<-table.row.end(a)
for (i in 2:(par1+1)) {
a<-table.row.start(a)
a<-table.element(a,i-1,header=TRUE)
a<-table.element(a,round(myacf[i],6))
mytstat <- myacf[i]*sqrtn
a<-table.element(a,round(mytstat,4))
a<-table.element(a,round(1-pt(abs(mytstat),lengthx),6))
a<-table.row.end(a)
}
a<-table.end(a)
table.save(a,file='mytable.tab')
a<-table.start()
a<-table.row.start(a)
a<-table.element(a,'Partial Autocorrelation Function',4,TRUE)
a<-table.row.end(a)
a<-table.row.start(a)
a<-table.element(a,'Time lag k',header=TRUE)
a<-table.element(a,hyperlink('basics.htm','PACF(k)','click here for more information about the Partial Autocorrelation Function'),header=TRUE)
a<-table.element(a,'T-STAT',header=TRUE)
a<-table.element(a,'P-value',header=TRUE)
a<-table.row.end(a)
for (i in 1:par1) {
a<-table.row.start(a)
a<-table.element(a,i,header=TRUE)
a<-table.element(a,round(mypacf[i],6))
mytstat <- mypacf[i]*sqrtn
a<-table.element(a,round(mytstat,4))
a<-table.element(a,round(1-pt(abs(mytstat),lengthx),6))
a<-table.row.end(a)
}
a<-table.end(a)
table.save(a,file='mytable1.tab')