Free Statistics

of Irreproducible Research!

Author's title

Author*Unverified author*
R Software Modulerwasp_autocorrelation.wasp
Title produced by software(Partial) Autocorrelation Function
Date of computationThu, 16 Oct 2014 19:24:19 +0100
Cite this page as followsStatistical Computations at FreeStatistics.org, Office for Research Development and Education, URL https://freestatistics.org/blog/index.php?v=date/2014/Oct/16/t1413483903wlwsto9iezgtpc3.htm/, Retrieved Mon, 13 May 2024 06:26:40 +0000
Statistical Computations at FreeStatistics.org, Office for Research Development and Education, URL https://freestatistics.org/blog/index.php?pk=242923, Retrieved Mon, 13 May 2024 06:26:40 +0000
QR Codes:

Original text written by user:
IsPrivate?No (this computation is public)
User-defined keywords
Estimated Impact47
Family? (F = Feedback message, R = changed R code, M = changed R Module, P = changed Parameters, D = changed Data)
-       [(Partial) Autocorrelation Function] [] [2014-10-16 18:24:19] [bc3b0a9d08b571f2c6b79bb1a1231eac] [Current]
Feedback Forum

Post a new message
Dataseries X:
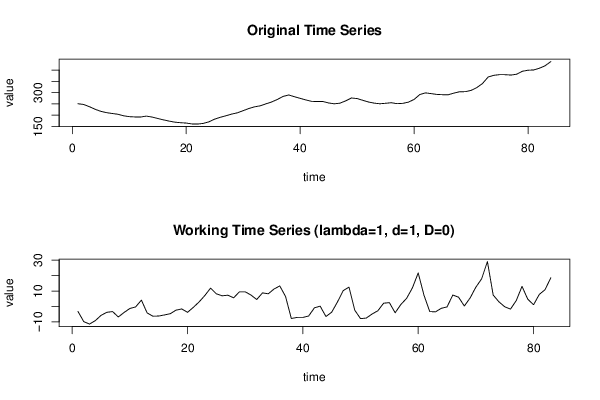
250.8
247.6
237.8
226.4
217.2
211.4
207.6
204.3
197.5
193.6
192.3
192
196.1
191.9
185.6
179.4
173.9
169.2
166.8
165.2
161.4
160.8
163.7
170.8
182.7
190.9
197.8
205.1
210.7
220.2
229.7
237.1
241.6
250.4
258.6
269.9
283.2
289.6
281.8
274.7
267.6
261.4
260.5
260.7
254.2
250.5
253.4
263.7
276.2
273.8
265.9
258.4
253.5
250.7
252.8
255.3
251.2
252.5
257.8
269.9
291.6
298.9
295.6
292.1
290.9
290.6
298
304
304.3
309.8
322.3
340.2
369.3
376.7
379.7
379.5
377.8
381.6
394.6
399.3
400.4
408.2
419.1
437.7


Summary of computational transaction
Raw Inputview raw input (R code)
Raw Outputview raw output of R engine
Computing time2 seconds
R Server'George Udny Yule' @ yule.wessa.net

\begin{tabular}{lllllllll}
\hline
Summary of computational transaction \tabularnewline
Raw Input & view raw input (R code)  \tabularnewline
Raw Output & view raw output of R engine  \tabularnewline
Computing time & 2 seconds \tabularnewline
R Server & 'George Udny Yule' @ yule.wessa.net \tabularnewline
\hline
\end{tabular}
%Source: https://freestatistics.org/blog/index.php?pk=242923&T=0

[TABLE]
[ROW][C]Summary of computational transaction[/C][/ROW]
[ROW][C]Raw Input[/C][C]view raw input (R code) [/C][/ROW]
[ROW][C]Raw Output[/C][C]view raw output of R engine [/C][/ROW]
[ROW][C]Computing time[/C][C]2 seconds[/C][/ROW]
[ROW][C]R Server[/C][C]'George Udny Yule' @ yule.wessa.net[/C][/ROW]
[/TABLE]
Source: https://freestatistics.org/blog/index.php?pk=242923&T=0

Globally Unique Identifier (entire table): ba.freestatistics.org/blog/index.php?pk=242923&T=0

As an alternative you can also use a QR Code:  

The GUIDs for individual cells are displayed in the table below:

Summary of computational transaction
Raw Inputview raw input (R code)
Raw Outputview raw output of R engine
Computing time2 seconds
R Server'George Udny Yule' @ yule.wessa.net


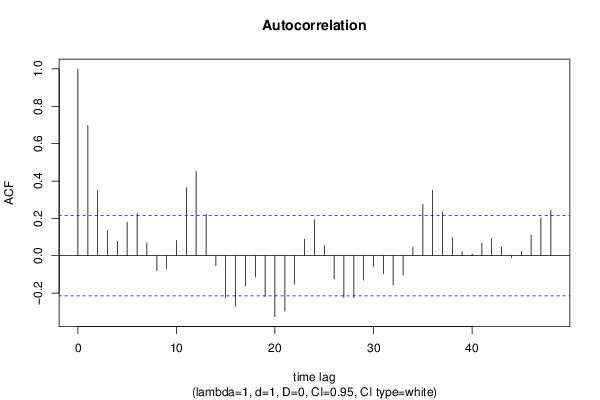
Autocorrelation Function
Time lag kACF(k)T-STATP-value
10.6968836.34890
20.3479413.16990.001068
30.1351751.23150.110807
40.0766120.6980.243574
50.1794291.63470.052952
60.2249432.04930.021794
70.0690730.62930.265446
8-0.080401-0.73250.232968
9-0.068008-0.61960.268614
100.0816070.74350.229646
110.3639893.31610.000678
120.4516324.11464.5e-05
130.2223532.02570.023003
14-0.053391-0.48640.313978
15-0.226633-2.06470.021036
16-0.271149-2.47030.007774
17-0.162441-1.47990.071342
18-0.114001-1.03860.151003
19-0.217674-1.98310.025331
20-0.326063-2.97060.001943
21-0.29592-2.6960.004248
22-0.151397-1.37930.085755
230.0885050.80630.211181
240.1933311.76130.040932
250.0556360.50690.306797
26-0.124018-1.12990.130895
27-0.223703-2.0380.022366
28-0.223904-2.03990.022272
29-0.130575-1.18960.118799
30-0.055892-0.50920.305983
31-0.095483-0.86990.193433
32-0.1575-1.43490.077538
33-0.10246-0.93350.176646
340.0445180.40560.343048
350.2746422.50210.007154
360.3505973.19410.000992
370.2352712.14340.017503
380.097790.89090.187776
390.02140.1950.42295
400.0088590.08070.467935
410.067020.61060.271572
420.0928020.84550.20014
430.0469650.42790.334925
44-0.010326-0.09410.462639
450.0227310.20710.418225
460.1102921.00480.158955
470.2028581.84810.034073
480.2429232.21310.014817

\begin{tabular}{lllllllll}
\hline
Autocorrelation Function \tabularnewline
Time lag k & ACF(k) & T-STAT & P-value \tabularnewline
1 & 0.696883 & 6.3489 & 0 \tabularnewline
2 & 0.347941 & 3.1699 & 0.001068 \tabularnewline
3 & 0.135175 & 1.2315 & 0.110807 \tabularnewline
4 & 0.076612 & 0.698 & 0.243574 \tabularnewline
5 & 0.179429 & 1.6347 & 0.052952 \tabularnewline
6 & 0.224943 & 2.0493 & 0.021794 \tabularnewline
7 & 0.069073 & 0.6293 & 0.265446 \tabularnewline
8 & -0.080401 & -0.7325 & 0.232968 \tabularnewline
9 & -0.068008 & -0.6196 & 0.268614 \tabularnewline
10 & 0.081607 & 0.7435 & 0.229646 \tabularnewline
11 & 0.363989 & 3.3161 & 0.000678 \tabularnewline
12 & 0.451632 & 4.1146 & 4.5e-05 \tabularnewline
13 & 0.222353 & 2.0257 & 0.023003 \tabularnewline
14 & -0.053391 & -0.4864 & 0.313978 \tabularnewline
15 & -0.226633 & -2.0647 & 0.021036 \tabularnewline
16 & -0.271149 & -2.4703 & 0.007774 \tabularnewline
17 & -0.162441 & -1.4799 & 0.071342 \tabularnewline
18 & -0.114001 & -1.0386 & 0.151003 \tabularnewline
19 & -0.217674 & -1.9831 & 0.025331 \tabularnewline
20 & -0.326063 & -2.9706 & 0.001943 \tabularnewline
21 & -0.29592 & -2.696 & 0.004248 \tabularnewline
22 & -0.151397 & -1.3793 & 0.085755 \tabularnewline
23 & 0.088505 & 0.8063 & 0.211181 \tabularnewline
24 & 0.193331 & 1.7613 & 0.040932 \tabularnewline
25 & 0.055636 & 0.5069 & 0.306797 \tabularnewline
26 & -0.124018 & -1.1299 & 0.130895 \tabularnewline
27 & -0.223703 & -2.038 & 0.022366 \tabularnewline
28 & -0.223904 & -2.0399 & 0.022272 \tabularnewline
29 & -0.130575 & -1.1896 & 0.118799 \tabularnewline
30 & -0.055892 & -0.5092 & 0.305983 \tabularnewline
31 & -0.095483 & -0.8699 & 0.193433 \tabularnewline
32 & -0.1575 & -1.4349 & 0.077538 \tabularnewline
33 & -0.10246 & -0.9335 & 0.176646 \tabularnewline
34 & 0.044518 & 0.4056 & 0.343048 \tabularnewline
35 & 0.274642 & 2.5021 & 0.007154 \tabularnewline
36 & 0.350597 & 3.1941 & 0.000992 \tabularnewline
37 & 0.235271 & 2.1434 & 0.017503 \tabularnewline
38 & 0.09779 & 0.8909 & 0.187776 \tabularnewline
39 & 0.0214 & 0.195 & 0.42295 \tabularnewline
40 & 0.008859 & 0.0807 & 0.467935 \tabularnewline
41 & 0.06702 & 0.6106 & 0.271572 \tabularnewline
42 & 0.092802 & 0.8455 & 0.20014 \tabularnewline
43 & 0.046965 & 0.4279 & 0.334925 \tabularnewline
44 & -0.010326 & -0.0941 & 0.462639 \tabularnewline
45 & 0.022731 & 0.2071 & 0.418225 \tabularnewline
46 & 0.110292 & 1.0048 & 0.158955 \tabularnewline
47 & 0.202858 & 1.8481 & 0.034073 \tabularnewline
48 & 0.242923 & 2.2131 & 0.014817 \tabularnewline
\hline
\end{tabular}
%Source: https://freestatistics.org/blog/index.php?pk=242923&T=1

[TABLE]
[ROW][C]Autocorrelation Function[/C][/ROW]
[ROW][C]Time lag k[/C][C]ACF(k)[/C][C]T-STAT[/C][C]P-value[/C][/ROW]
[ROW][C]1[/C][C]0.696883[/C][C]6.3489[/C][C]0[/C][/ROW]
[ROW][C]2[/C][C]0.347941[/C][C]3.1699[/C][C]0.001068[/C][/ROW]
[ROW][C]3[/C][C]0.135175[/C][C]1.2315[/C][C]0.110807[/C][/ROW]
[ROW][C]4[/C][C]0.076612[/C][C]0.698[/C][C]0.243574[/C][/ROW]
[ROW][C]5[/C][C]0.179429[/C][C]1.6347[/C][C]0.052952[/C][/ROW]
[ROW][C]6[/C][C]0.224943[/C][C]2.0493[/C][C]0.021794[/C][/ROW]
[ROW][C]7[/C][C]0.069073[/C][C]0.6293[/C][C]0.265446[/C][/ROW]
[ROW][C]8[/C][C]-0.080401[/C][C]-0.7325[/C][C]0.232968[/C][/ROW]
[ROW][C]9[/C][C]-0.068008[/C][C]-0.6196[/C][C]0.268614[/C][/ROW]
[ROW][C]10[/C][C]0.081607[/C][C]0.7435[/C][C]0.229646[/C][/ROW]
[ROW][C]11[/C][C]0.363989[/C][C]3.3161[/C][C]0.000678[/C][/ROW]
[ROW][C]12[/C][C]0.451632[/C][C]4.1146[/C][C]4.5e-05[/C][/ROW]
[ROW][C]13[/C][C]0.222353[/C][C]2.0257[/C][C]0.023003[/C][/ROW]
[ROW][C]14[/C][C]-0.053391[/C][C]-0.4864[/C][C]0.313978[/C][/ROW]
[ROW][C]15[/C][C]-0.226633[/C][C]-2.0647[/C][C]0.021036[/C][/ROW]
[ROW][C]16[/C][C]-0.271149[/C][C]-2.4703[/C][C]0.007774[/C][/ROW]
[ROW][C]17[/C][C]-0.162441[/C][C]-1.4799[/C][C]0.071342[/C][/ROW]
[ROW][C]18[/C][C]-0.114001[/C][C]-1.0386[/C][C]0.151003[/C][/ROW]
[ROW][C]19[/C][C]-0.217674[/C][C]-1.9831[/C][C]0.025331[/C][/ROW]
[ROW][C]20[/C][C]-0.326063[/C][C]-2.9706[/C][C]0.001943[/C][/ROW]
[ROW][C]21[/C][C]-0.29592[/C][C]-2.696[/C][C]0.004248[/C][/ROW]
[ROW][C]22[/C][C]-0.151397[/C][C]-1.3793[/C][C]0.085755[/C][/ROW]
[ROW][C]23[/C][C]0.088505[/C][C]0.8063[/C][C]0.211181[/C][/ROW]
[ROW][C]24[/C][C]0.193331[/C][C]1.7613[/C][C]0.040932[/C][/ROW]
[ROW][C]25[/C][C]0.055636[/C][C]0.5069[/C][C]0.306797[/C][/ROW]
[ROW][C]26[/C][C]-0.124018[/C][C]-1.1299[/C][C]0.130895[/C][/ROW]
[ROW][C]27[/C][C]-0.223703[/C][C]-2.038[/C][C]0.022366[/C][/ROW]
[ROW][C]28[/C][C]-0.223904[/C][C]-2.0399[/C][C]0.022272[/C][/ROW]
[ROW][C]29[/C][C]-0.130575[/C][C]-1.1896[/C][C]0.118799[/C][/ROW]
[ROW][C]30[/C][C]-0.055892[/C][C]-0.5092[/C][C]0.305983[/C][/ROW]
[ROW][C]31[/C][C]-0.095483[/C][C]-0.8699[/C][C]0.193433[/C][/ROW]
[ROW][C]32[/C][C]-0.1575[/C][C]-1.4349[/C][C]0.077538[/C][/ROW]
[ROW][C]33[/C][C]-0.10246[/C][C]-0.9335[/C][C]0.176646[/C][/ROW]
[ROW][C]34[/C][C]0.044518[/C][C]0.4056[/C][C]0.343048[/C][/ROW]
[ROW][C]35[/C][C]0.274642[/C][C]2.5021[/C][C]0.007154[/C][/ROW]
[ROW][C]36[/C][C]0.350597[/C][C]3.1941[/C][C]0.000992[/C][/ROW]
[ROW][C]37[/C][C]0.235271[/C][C]2.1434[/C][C]0.017503[/C][/ROW]
[ROW][C]38[/C][C]0.09779[/C][C]0.8909[/C][C]0.187776[/C][/ROW]
[ROW][C]39[/C][C]0.0214[/C][C]0.195[/C][C]0.42295[/C][/ROW]
[ROW][C]40[/C][C]0.008859[/C][C]0.0807[/C][C]0.467935[/C][/ROW]
[ROW][C]41[/C][C]0.06702[/C][C]0.6106[/C][C]0.271572[/C][/ROW]
[ROW][C]42[/C][C]0.092802[/C][C]0.8455[/C][C]0.20014[/C][/ROW]
[ROW][C]43[/C][C]0.046965[/C][C]0.4279[/C][C]0.334925[/C][/ROW]
[ROW][C]44[/C][C]-0.010326[/C][C]-0.0941[/C][C]0.462639[/C][/ROW]
[ROW][C]45[/C][C]0.022731[/C][C]0.2071[/C][C]0.418225[/C][/ROW]
[ROW][C]46[/C][C]0.110292[/C][C]1.0048[/C][C]0.158955[/C][/ROW]
[ROW][C]47[/C][C]0.202858[/C][C]1.8481[/C][C]0.034073[/C][/ROW]
[ROW][C]48[/C][C]0.242923[/C][C]2.2131[/C][C]0.014817[/C][/ROW]
[/TABLE]
Source: https://freestatistics.org/blog/index.php?pk=242923&T=1

Globally Unique Identifier (entire table): ba.freestatistics.org/blog/index.php?pk=242923&T=1

As an alternative you can also use a QR Code:  

The GUIDs for individual cells are displayed in the table below:

Autocorrelation Function
Time lag kACF(k)T-STATP-value
10.6968836.34890
20.3479413.16990.001068
30.1351751.23150.110807
40.0766120.6980.243574
50.1794291.63470.052952
60.2249432.04930.021794
70.0690730.62930.265446
8-0.080401-0.73250.232968
9-0.068008-0.61960.268614
100.0816070.74350.229646
110.3639893.31610.000678
120.4516324.11464.5e-05
130.2223532.02570.023003
14-0.053391-0.48640.313978
15-0.226633-2.06470.021036
16-0.271149-2.47030.007774
17-0.162441-1.47990.071342
18-0.114001-1.03860.151003
19-0.217674-1.98310.025331
20-0.326063-2.97060.001943
21-0.29592-2.6960.004248
22-0.151397-1.37930.085755
230.0885050.80630.211181
240.1933311.76130.040932
250.0556360.50690.306797
26-0.124018-1.12990.130895
27-0.223703-2.0380.022366
28-0.223904-2.03990.022272
29-0.130575-1.18960.118799
30-0.055892-0.50920.305983
31-0.095483-0.86990.193433
32-0.1575-1.43490.077538
33-0.10246-0.93350.176646
340.0445180.40560.343048
350.2746422.50210.007154
360.3505973.19410.000992
370.2352712.14340.017503
380.097790.89090.187776
390.02140.1950.42295
400.0088590.08070.467935
410.067020.61060.271572
420.0928020.84550.20014
430.0469650.42790.334925
44-0.010326-0.09410.462639
450.0227310.20710.418225
460.1102921.00480.158955
470.2028581.84810.034073
480.2429232.21310.014817


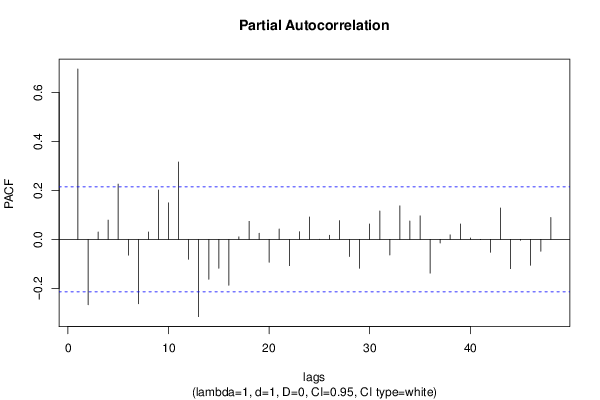
Partial Autocorrelation Function
Time lag kPACF(k)T-STATP-value
10.6968836.34890
2-0.267724-2.43910.008428
30.0300680.27390.392409
40.0786980.7170.237701
50.225832.05740.021393
6-0.064632-0.58880.278788
7-0.263007-2.39610.009409
80.0299490.27280.392824
90.2017121.83770.034844
100.1493531.36070.088651
110.3165562.8840.0025
12-0.081502-0.74250.229935
13-0.316057-2.87940.002533
14-0.163252-1.48730.070363
15-0.118277-1.07760.142178
16-0.187658-1.70960.045534
170.0103060.09390.462711
180.0736580.67110.252025
190.0248080.2260.410873
20-0.093691-0.85360.197901
210.0427270.38930.34904
22-0.10758-0.98010.164941
230.031430.28630.387664
240.0914560.83320.203562
25-0.000168-0.00150.499392
260.0170380.15520.438512
270.0765230.69720.243826
28-0.069966-0.63740.262803
29-0.117954-1.07460.142832
300.0631290.57510.283378
310.1159221.05610.146995
32-0.064326-0.5860.279722
330.1369931.24810.107757
340.0754750.68760.246808
350.0960370.87490.192065
36-0.138069-1.25790.105983
37-0.015213-0.13860.445053
380.0183930.16760.433664
390.0626250.57050.284926
400.0054230.04940.480357
41-0.00117-0.01070.495759
42-0.053025-0.48310.315155
430.1281051.16710.123257
44-0.119648-1.090.139424
45-0.003698-0.03370.486601
46-0.106179-0.96730.168094
47-0.048846-0.4450.328736
480.0895070.81540.208576

\begin{tabular}{lllllllll}
\hline
Partial Autocorrelation Function \tabularnewline
Time lag k & PACF(k) & T-STAT & P-value \tabularnewline
1 & 0.696883 & 6.3489 & 0 \tabularnewline
2 & -0.267724 & -2.4391 & 0.008428 \tabularnewline
3 & 0.030068 & 0.2739 & 0.392409 \tabularnewline
4 & 0.078698 & 0.717 & 0.237701 \tabularnewline
5 & 0.22583 & 2.0574 & 0.021393 \tabularnewline
6 & -0.064632 & -0.5888 & 0.278788 \tabularnewline
7 & -0.263007 & -2.3961 & 0.009409 \tabularnewline
8 & 0.029949 & 0.2728 & 0.392824 \tabularnewline
9 & 0.201712 & 1.8377 & 0.034844 \tabularnewline
10 & 0.149353 & 1.3607 & 0.088651 \tabularnewline
11 & 0.316556 & 2.884 & 0.0025 \tabularnewline
12 & -0.081502 & -0.7425 & 0.229935 \tabularnewline
13 & -0.316057 & -2.8794 & 0.002533 \tabularnewline
14 & -0.163252 & -1.4873 & 0.070363 \tabularnewline
15 & -0.118277 & -1.0776 & 0.142178 \tabularnewline
16 & -0.187658 & -1.7096 & 0.045534 \tabularnewline
17 & 0.010306 & 0.0939 & 0.462711 \tabularnewline
18 & 0.073658 & 0.6711 & 0.252025 \tabularnewline
19 & 0.024808 & 0.226 & 0.410873 \tabularnewline
20 & -0.093691 & -0.8536 & 0.197901 \tabularnewline
21 & 0.042727 & 0.3893 & 0.34904 \tabularnewline
22 & -0.10758 & -0.9801 & 0.164941 \tabularnewline
23 & 0.03143 & 0.2863 & 0.387664 \tabularnewline
24 & 0.091456 & 0.8332 & 0.203562 \tabularnewline
25 & -0.000168 & -0.0015 & 0.499392 \tabularnewline
26 & 0.017038 & 0.1552 & 0.438512 \tabularnewline
27 & 0.076523 & 0.6972 & 0.243826 \tabularnewline
28 & -0.069966 & -0.6374 & 0.262803 \tabularnewline
29 & -0.117954 & -1.0746 & 0.142832 \tabularnewline
30 & 0.063129 & 0.5751 & 0.283378 \tabularnewline
31 & 0.115922 & 1.0561 & 0.146995 \tabularnewline
32 & -0.064326 & -0.586 & 0.279722 \tabularnewline
33 & 0.136993 & 1.2481 & 0.107757 \tabularnewline
34 & 0.075475 & 0.6876 & 0.246808 \tabularnewline
35 & 0.096037 & 0.8749 & 0.192065 \tabularnewline
36 & -0.138069 & -1.2579 & 0.105983 \tabularnewline
37 & -0.015213 & -0.1386 & 0.445053 \tabularnewline
38 & 0.018393 & 0.1676 & 0.433664 \tabularnewline
39 & 0.062625 & 0.5705 & 0.284926 \tabularnewline
40 & 0.005423 & 0.0494 & 0.480357 \tabularnewline
41 & -0.00117 & -0.0107 & 0.495759 \tabularnewline
42 & -0.053025 & -0.4831 & 0.315155 \tabularnewline
43 & 0.128105 & 1.1671 & 0.123257 \tabularnewline
44 & -0.119648 & -1.09 & 0.139424 \tabularnewline
45 & -0.003698 & -0.0337 & 0.486601 \tabularnewline
46 & -0.106179 & -0.9673 & 0.168094 \tabularnewline
47 & -0.048846 & -0.445 & 0.328736 \tabularnewline
48 & 0.089507 & 0.8154 & 0.208576 \tabularnewline
\hline
\end{tabular}
%Source: https://freestatistics.org/blog/index.php?pk=242923&T=2

[TABLE]
[ROW][C]Partial Autocorrelation Function[/C][/ROW]
[ROW][C]Time lag k[/C][C]PACF(k)[/C][C]T-STAT[/C][C]P-value[/C][/ROW]
[ROW][C]1[/C][C]0.696883[/C][C]6.3489[/C][C]0[/C][/ROW]
[ROW][C]2[/C][C]-0.267724[/C][C]-2.4391[/C][C]0.008428[/C][/ROW]
[ROW][C]3[/C][C]0.030068[/C][C]0.2739[/C][C]0.392409[/C][/ROW]
[ROW][C]4[/C][C]0.078698[/C][C]0.717[/C][C]0.237701[/C][/ROW]
[ROW][C]5[/C][C]0.22583[/C][C]2.0574[/C][C]0.021393[/C][/ROW]
[ROW][C]6[/C][C]-0.064632[/C][C]-0.5888[/C][C]0.278788[/C][/ROW]
[ROW][C]7[/C][C]-0.263007[/C][C]-2.3961[/C][C]0.009409[/C][/ROW]
[ROW][C]8[/C][C]0.029949[/C][C]0.2728[/C][C]0.392824[/C][/ROW]
[ROW][C]9[/C][C]0.201712[/C][C]1.8377[/C][C]0.034844[/C][/ROW]
[ROW][C]10[/C][C]0.149353[/C][C]1.3607[/C][C]0.088651[/C][/ROW]
[ROW][C]11[/C][C]0.316556[/C][C]2.884[/C][C]0.0025[/C][/ROW]
[ROW][C]12[/C][C]-0.081502[/C][C]-0.7425[/C][C]0.229935[/C][/ROW]
[ROW][C]13[/C][C]-0.316057[/C][C]-2.8794[/C][C]0.002533[/C][/ROW]
[ROW][C]14[/C][C]-0.163252[/C][C]-1.4873[/C][C]0.070363[/C][/ROW]
[ROW][C]15[/C][C]-0.118277[/C][C]-1.0776[/C][C]0.142178[/C][/ROW]
[ROW][C]16[/C][C]-0.187658[/C][C]-1.7096[/C][C]0.045534[/C][/ROW]
[ROW][C]17[/C][C]0.010306[/C][C]0.0939[/C][C]0.462711[/C][/ROW]
[ROW][C]18[/C][C]0.073658[/C][C]0.6711[/C][C]0.252025[/C][/ROW]
[ROW][C]19[/C][C]0.024808[/C][C]0.226[/C][C]0.410873[/C][/ROW]
[ROW][C]20[/C][C]-0.093691[/C][C]-0.8536[/C][C]0.197901[/C][/ROW]
[ROW][C]21[/C][C]0.042727[/C][C]0.3893[/C][C]0.34904[/C][/ROW]
[ROW][C]22[/C][C]-0.10758[/C][C]-0.9801[/C][C]0.164941[/C][/ROW]
[ROW][C]23[/C][C]0.03143[/C][C]0.2863[/C][C]0.387664[/C][/ROW]
[ROW][C]24[/C][C]0.091456[/C][C]0.8332[/C][C]0.203562[/C][/ROW]
[ROW][C]25[/C][C]-0.000168[/C][C]-0.0015[/C][C]0.499392[/C][/ROW]
[ROW][C]26[/C][C]0.017038[/C][C]0.1552[/C][C]0.438512[/C][/ROW]
[ROW][C]27[/C][C]0.076523[/C][C]0.6972[/C][C]0.243826[/C][/ROW]
[ROW][C]28[/C][C]-0.069966[/C][C]-0.6374[/C][C]0.262803[/C][/ROW]
[ROW][C]29[/C][C]-0.117954[/C][C]-1.0746[/C][C]0.142832[/C][/ROW]
[ROW][C]30[/C][C]0.063129[/C][C]0.5751[/C][C]0.283378[/C][/ROW]
[ROW][C]31[/C][C]0.115922[/C][C]1.0561[/C][C]0.146995[/C][/ROW]
[ROW][C]32[/C][C]-0.064326[/C][C]-0.586[/C][C]0.279722[/C][/ROW]
[ROW][C]33[/C][C]0.136993[/C][C]1.2481[/C][C]0.107757[/C][/ROW]
[ROW][C]34[/C][C]0.075475[/C][C]0.6876[/C][C]0.246808[/C][/ROW]
[ROW][C]35[/C][C]0.096037[/C][C]0.8749[/C][C]0.192065[/C][/ROW]
[ROW][C]36[/C][C]-0.138069[/C][C]-1.2579[/C][C]0.105983[/C][/ROW]
[ROW][C]37[/C][C]-0.015213[/C][C]-0.1386[/C][C]0.445053[/C][/ROW]
[ROW][C]38[/C][C]0.018393[/C][C]0.1676[/C][C]0.433664[/C][/ROW]
[ROW][C]39[/C][C]0.062625[/C][C]0.5705[/C][C]0.284926[/C][/ROW]
[ROW][C]40[/C][C]0.005423[/C][C]0.0494[/C][C]0.480357[/C][/ROW]
[ROW][C]41[/C][C]-0.00117[/C][C]-0.0107[/C][C]0.495759[/C][/ROW]
[ROW][C]42[/C][C]-0.053025[/C][C]-0.4831[/C][C]0.315155[/C][/ROW]
[ROW][C]43[/C][C]0.128105[/C][C]1.1671[/C][C]0.123257[/C][/ROW]
[ROW][C]44[/C][C]-0.119648[/C][C]-1.09[/C][C]0.139424[/C][/ROW]
[ROW][C]45[/C][C]-0.003698[/C][C]-0.0337[/C][C]0.486601[/C][/ROW]
[ROW][C]46[/C][C]-0.106179[/C][C]-0.9673[/C][C]0.168094[/C][/ROW]
[ROW][C]47[/C][C]-0.048846[/C][C]-0.445[/C][C]0.328736[/C][/ROW]
[ROW][C]48[/C][C]0.089507[/C][C]0.8154[/C][C]0.208576[/C][/ROW]
[/TABLE]
Source: https://freestatistics.org/blog/index.php?pk=242923&T=2

Globally Unique Identifier (entire table): ba.freestatistics.org/blog/index.php?pk=242923&T=2

As an alternative you can also use a QR Code:  

The GUIDs for individual cells are displayed in the table below:

Partial Autocorrelation Function
Time lag kPACF(k)T-STATP-value
10.6968836.34890
2-0.267724-2.43910.008428
30.0300680.27390.392409
40.0786980.7170.237701
50.225832.05740.021393
6-0.064632-0.58880.278788
7-0.263007-2.39610.009409
80.0299490.27280.392824
90.2017121.83770.034844
100.1493531.36070.088651
110.3165562.8840.0025
12-0.081502-0.74250.229935
13-0.316057-2.87940.002533
14-0.163252-1.48730.070363
15-0.118277-1.07760.142178
16-0.187658-1.70960.045534
170.0103060.09390.462711
180.0736580.67110.252025
190.0248080.2260.410873
20-0.093691-0.85360.197901
210.0427270.38930.34904
22-0.10758-0.98010.164941
230.031430.28630.387664
240.0914560.83320.203562
25-0.000168-0.00150.499392
260.0170380.15520.438512
270.0765230.69720.243826
28-0.069966-0.63740.262803
29-0.117954-1.07460.142832
300.0631290.57510.283378
310.1159221.05610.146995
32-0.064326-0.5860.279722
330.1369931.24810.107757
340.0754750.68760.246808
350.0960370.87490.192065
36-0.138069-1.25790.105983
37-0.015213-0.13860.445053
380.0183930.16760.433664
390.0626250.57050.284926
400.0054230.04940.480357
41-0.00117-0.01070.495759
42-0.053025-0.48310.315155
430.1281051.16710.123257
44-0.119648-1.090.139424
45-0.003698-0.03370.486601
46-0.106179-0.96730.168094
47-0.048846-0.4450.328736
480.0895070.81540.208576


Parameters (Session):
par1 = 48 ; par2 = 1 ; par3 = 1 ; par4 = 0 ; par5 = 12 ; par6 = White Noise ; par7 = 0.95 ;
Parameters (R input):
par1 = 48 ; par2 = 1 ; par3 = 1 ; par4 = 0 ; par5 = 12 ; par6 = White Noise ; par7 = 0.95 ; par8 = ;
R code (references can be found in the software module):
if (par1 == 'Default') {
par1 = 10*log10(length(x))
} else {
par1 <- as.numeric(par1)
}
par2 <- as.numeric(par2)
par3 <- as.numeric(par3)
par4 <- as.numeric(par4)
par5 <- as.numeric(par5)
if (par6 == 'White Noise') par6 <- 'white' else par6 <- 'ma'
par7 <- as.numeric(par7)
if (par8 != '') par8 <- as.numeric(par8)
ox <- x
if (par8 == '') {
if (par2 == 0) {
x <- log(x)
} else {
x <- (x ^ par2 - 1) / par2
}
} else {
x <- log(x,base=par8)
}
if (par3 > 0) x <- diff(x,lag=1,difference=par3)
if (par4 > 0) x <- diff(x,lag=par5,difference=par4)
bitmap(file='picts.png')
op <- par(mfrow=c(2,1))
plot(ox,type='l',main='Original Time Series',xlab='time',ylab='value')
if (par8=='') {
mytitle <- paste('Working Time Series (lambda=',par2,', d=',par3,', D=',par4,')',sep='')
mysub <- paste('(lambda=',par2,', d=',par3,', D=',par4,', CI=', par7, ', CI type=',par6,')',sep='')
} else {
mytitle <- paste('Working Time Series (base=',par8,', d=',par3,', D=',par4,')',sep='')
mysub <- paste('(base=',par8,', d=',par3,', D=',par4,', CI=', par7, ', CI type=',par6,')',sep='')
}
plot(x,type='l', main=mytitle,xlab='time',ylab='value')
par(op)
dev.off()
bitmap(file='pic1.png')
racf <- acf(x, par1, main='Autocorrelation', xlab='time lag', ylab='ACF', ci.type=par6, ci=par7, sub=mysub)
dev.off()
bitmap(file='pic2.png')
rpacf <- pacf(x,par1,main='Partial Autocorrelation',xlab='lags',ylab='PACF',sub=mysub)
dev.off()
(myacf <- c(racf$acf))
(mypacf <- c(rpacf$acf))
lengthx <- length(x)
sqrtn <- sqrt(lengthx)
load(file='createtable')
a<-table.start()
a<-table.row.start(a)
a<-table.element(a,'Autocorrelation Function',4,TRUE)
a<-table.row.end(a)
a<-table.row.start(a)
a<-table.element(a,'Time lag k',header=TRUE)
a<-table.element(a,hyperlink('basics.htm','ACF(k)','click here for more information about the Autocorrelation Function'),header=TRUE)
a<-table.element(a,'T-STAT',header=TRUE)
a<-table.element(a,'P-value',header=TRUE)
a<-table.row.end(a)
for (i in 2:(par1+1)) {
a<-table.row.start(a)
a<-table.element(a,i-1,header=TRUE)
a<-table.element(a,round(myacf[i],6))
mytstat <- myacf[i]*sqrtn
a<-table.element(a,round(mytstat,4))
a<-table.element(a,round(1-pt(abs(mytstat),lengthx),6))
a<-table.row.end(a)
}
a<-table.end(a)
table.save(a,file='mytable.tab')
a<-table.start()
a<-table.row.start(a)
a<-table.element(a,'Partial Autocorrelation Function',4,TRUE)
a<-table.row.end(a)
a<-table.row.start(a)
a<-table.element(a,'Time lag k',header=TRUE)
a<-table.element(a,hyperlink('basics.htm','PACF(k)','click here for more information about the Partial Autocorrelation Function'),header=TRUE)
a<-table.element(a,'T-STAT',header=TRUE)
a<-table.element(a,'P-value',header=TRUE)
a<-table.row.end(a)
for (i in 1:par1) {
a<-table.row.start(a)
a<-table.element(a,i,header=TRUE)
a<-table.element(a,round(mypacf[i],6))
mytstat <- mypacf[i]*sqrtn
a<-table.element(a,round(mytstat,4))
a<-table.element(a,round(1-pt(abs(mytstat),lengthx),6))
a<-table.row.end(a)
}
a<-table.end(a)
table.save(a,file='mytable1.tab')