Free Statistics

of Irreproducible Research!

Author's title

Author*Unverified author*
R Software Modulerwasp_autocorrelation.wasp
Title produced by software(Partial) Autocorrelation Function
Date of computationThu, 16 Oct 2014 19:19:40 +0100
Cite this page as followsStatistical Computations at FreeStatistics.org, Office for Research Development and Education, URL https://freestatistics.org/blog/index.php?v=date/2014/Oct/16/t1413483614aq3z5zhcouevxjv.htm/, Retrieved Sun, 12 May 2024 15:29:42 +0000
Statistical Computations at FreeStatistics.org, Office for Research Development and Education, URL https://freestatistics.org/blog/index.php?pk=242915, Retrieved Sun, 12 May 2024 15:29:42 +0000
QR Codes:

Original text written by user:
IsPrivate?No (this computation is public)
User-defined keywords
Estimated Impact38
Family? (F = Feedback message, R = changed R code, M = changed R Module, P = changed Parameters, D = changed Data)
-       [(Partial) Autocorrelation Function] [] [2014-10-16 18:19:40] [bc3b0a9d08b571f2c6b79bb1a1231eac] [Current]
Feedback Forum

Post a new message
Dataseries X:
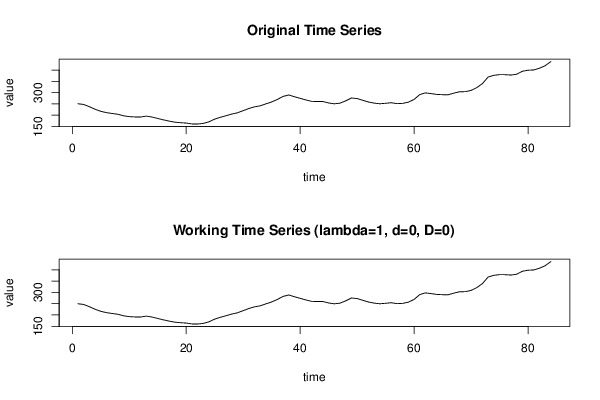
250,8
247,6
237,8
226,4
217,2
211,4
207,6
204,3
197,5
193,6
192,3
192
196,1
191,9
185,6
179,4
173,9
169,2
166,8
165,2
161,4
160,8
163,7
170,8
182,7
190,9
197,8
205,1
210,7
220,2
229,7
237,1
241,6
250,4
258,6
269,9
283,2
289,6
281,8
274,7
267,6
261,4
260,5
260,7
254,2
250,5
253,4
263,7
276,2
273,8
265,9
258,4
253,5
250,7
252,8
255,3
251,2
252,5
257,8
269,9
291,6
298,9
295,6
292,1
290,9
290,6
298
304
304,3
309,8
322,3
340,2
369,3
376,7
379,7
379,5
377,8
381,6
394,6
399,3
400,4
408,2
419,1
437,7


Summary of computational transaction
Raw Inputview raw input (R code)
Raw Outputview raw output of R engine
Computing time1 seconds
R Server'Gertrude Mary Cox' @ cox.wessa.net

\begin{tabular}{lllllllll}
\hline
Summary of computational transaction \tabularnewline
Raw Input & view raw input (R code)  \tabularnewline
Raw Output & view raw output of R engine  \tabularnewline
Computing time & 1 seconds \tabularnewline
R Server & 'Gertrude Mary Cox' @ cox.wessa.net \tabularnewline
\hline
\end{tabular}
%Source: https://freestatistics.org/blog/index.php?pk=242915&T=0

[TABLE]
[ROW][C]Summary of computational transaction[/C][/ROW]
[ROW][C]Raw Input[/C][C]view raw input (R code) [/C][/ROW]
[ROW][C]Raw Output[/C][C]view raw output of R engine [/C][/ROW]
[ROW][C]Computing time[/C][C]1 seconds[/C][/ROW]
[ROW][C]R Server[/C][C]'Gertrude Mary Cox' @ cox.wessa.net[/C][/ROW]
[/TABLE]
Source: https://freestatistics.org/blog/index.php?pk=242915&T=0

Globally Unique Identifier (entire table): ba.freestatistics.org/blog/index.php?pk=242915&T=0

As an alternative you can also use a QR Code:  

The GUIDs for individual cells are displayed in the table below:

Summary of computational transaction
Raw Inputview raw input (R code)
Raw Outputview raw output of R engine
Computing time1 seconds
R Server'Gertrude Mary Cox' @ cox.wessa.net


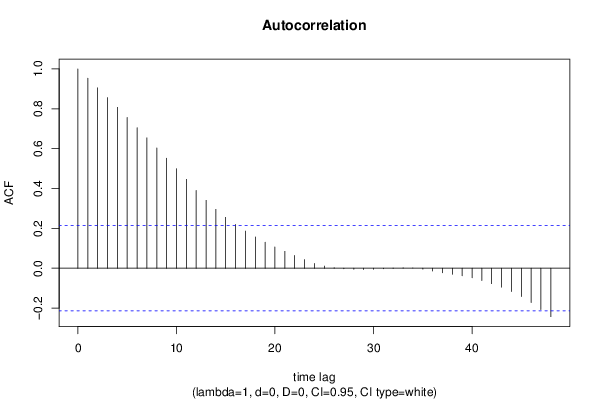
Autocorrelation Function
Time lag kACF(k)T-STATP-value
10.9534818.73880
20.905238.29660
30.8560867.84620
40.8073217.39920
50.7566876.93510
60.7045556.45740
70.6541665.99550
80.6034035.53030
90.5515585.05511e-06
100.4991954.57528e-06
110.4458954.08675e-05
120.3900493.57490.000292
130.3405783.12150.001234
140.2952322.70580.004125
150.2551022.3380.010881
160.2192662.00960.023842
170.185941.70420.046023
180.15631.43250.077854
190.1304341.19540.117639
200.1062210.97350.166541
210.0845490.77490.220286
220.0640540.58710.279367
230.043050.39460.347082
240.0233980.21440.415358
250.0105340.09650.461658
260.0019180.01760.493009
27-0.003168-0.0290.488453
28-0.005185-0.04750.481106
29-0.00661-0.06060.475918
30-0.005512-0.05050.479916
31-0.002979-0.02730.489143
32-0.000749-0.00690.497269
330.0009330.00850.4966
340.0003110.00290.498866
35-0.004718-0.04320.482807
36-0.014522-0.13310.447219
37-0.023196-0.21260.41608
38-0.030361-0.27830.390746
39-0.03803-0.34860.364148
40-0.048235-0.44210.329783
41-0.062163-0.56970.285191
42-0.077576-0.7110.239529
43-0.095167-0.87220.192787
44-0.11674-1.06990.143856
45-0.14225-1.30370.097942
46-0.172115-1.57750.059224
47-0.207625-1.90290.030239
48-0.243295-2.22980.014213

\begin{tabular}{lllllllll}
\hline
Autocorrelation Function \tabularnewline
Time lag k & ACF(k) & T-STAT & P-value \tabularnewline
1 & 0.953481 & 8.7388 & 0 \tabularnewline
2 & 0.90523 & 8.2966 & 0 \tabularnewline
3 & 0.856086 & 7.8462 & 0 \tabularnewline
4 & 0.807321 & 7.3992 & 0 \tabularnewline
5 & 0.756687 & 6.9351 & 0 \tabularnewline
6 & 0.704555 & 6.4574 & 0 \tabularnewline
7 & 0.654166 & 5.9955 & 0 \tabularnewline
8 & 0.603403 & 5.5303 & 0 \tabularnewline
9 & 0.551558 & 5.0551 & 1e-06 \tabularnewline
10 & 0.499195 & 4.5752 & 8e-06 \tabularnewline
11 & 0.445895 & 4.0867 & 5e-05 \tabularnewline
12 & 0.390049 & 3.5749 & 0.000292 \tabularnewline
13 & 0.340578 & 3.1215 & 0.001234 \tabularnewline
14 & 0.295232 & 2.7058 & 0.004125 \tabularnewline
15 & 0.255102 & 2.338 & 0.010881 \tabularnewline
16 & 0.219266 & 2.0096 & 0.023842 \tabularnewline
17 & 0.18594 & 1.7042 & 0.046023 \tabularnewline
18 & 0.1563 & 1.4325 & 0.077854 \tabularnewline
19 & 0.130434 & 1.1954 & 0.117639 \tabularnewline
20 & 0.106221 & 0.9735 & 0.166541 \tabularnewline
21 & 0.084549 & 0.7749 & 0.220286 \tabularnewline
22 & 0.064054 & 0.5871 & 0.279367 \tabularnewline
23 & 0.04305 & 0.3946 & 0.347082 \tabularnewline
24 & 0.023398 & 0.2144 & 0.415358 \tabularnewline
25 & 0.010534 & 0.0965 & 0.461658 \tabularnewline
26 & 0.001918 & 0.0176 & 0.493009 \tabularnewline
27 & -0.003168 & -0.029 & 0.488453 \tabularnewline
28 & -0.005185 & -0.0475 & 0.481106 \tabularnewline
29 & -0.00661 & -0.0606 & 0.475918 \tabularnewline
30 & -0.005512 & -0.0505 & 0.479916 \tabularnewline
31 & -0.002979 & -0.0273 & 0.489143 \tabularnewline
32 & -0.000749 & -0.0069 & 0.497269 \tabularnewline
33 & 0.000933 & 0.0085 & 0.4966 \tabularnewline
34 & 0.000311 & 0.0029 & 0.498866 \tabularnewline
35 & -0.004718 & -0.0432 & 0.482807 \tabularnewline
36 & -0.014522 & -0.1331 & 0.447219 \tabularnewline
37 & -0.023196 & -0.2126 & 0.41608 \tabularnewline
38 & -0.030361 & -0.2783 & 0.390746 \tabularnewline
39 & -0.03803 & -0.3486 & 0.364148 \tabularnewline
40 & -0.048235 & -0.4421 & 0.329783 \tabularnewline
41 & -0.062163 & -0.5697 & 0.285191 \tabularnewline
42 & -0.077576 & -0.711 & 0.239529 \tabularnewline
43 & -0.095167 & -0.8722 & 0.192787 \tabularnewline
44 & -0.11674 & -1.0699 & 0.143856 \tabularnewline
45 & -0.14225 & -1.3037 & 0.097942 \tabularnewline
46 & -0.172115 & -1.5775 & 0.059224 \tabularnewline
47 & -0.207625 & -1.9029 & 0.030239 \tabularnewline
48 & -0.243295 & -2.2298 & 0.014213 \tabularnewline
\hline
\end{tabular}
%Source: https://freestatistics.org/blog/index.php?pk=242915&T=1

[TABLE]
[ROW][C]Autocorrelation Function[/C][/ROW]
[ROW][C]Time lag k[/C][C]ACF(k)[/C][C]T-STAT[/C][C]P-value[/C][/ROW]
[ROW][C]1[/C][C]0.953481[/C][C]8.7388[/C][C]0[/C][/ROW]
[ROW][C]2[/C][C]0.90523[/C][C]8.2966[/C][C]0[/C][/ROW]
[ROW][C]3[/C][C]0.856086[/C][C]7.8462[/C][C]0[/C][/ROW]
[ROW][C]4[/C][C]0.807321[/C][C]7.3992[/C][C]0[/C][/ROW]
[ROW][C]5[/C][C]0.756687[/C][C]6.9351[/C][C]0[/C][/ROW]
[ROW][C]6[/C][C]0.704555[/C][C]6.4574[/C][C]0[/C][/ROW]
[ROW][C]7[/C][C]0.654166[/C][C]5.9955[/C][C]0[/C][/ROW]
[ROW][C]8[/C][C]0.603403[/C][C]5.5303[/C][C]0[/C][/ROW]
[ROW][C]9[/C][C]0.551558[/C][C]5.0551[/C][C]1e-06[/C][/ROW]
[ROW][C]10[/C][C]0.499195[/C][C]4.5752[/C][C]8e-06[/C][/ROW]
[ROW][C]11[/C][C]0.445895[/C][C]4.0867[/C][C]5e-05[/C][/ROW]
[ROW][C]12[/C][C]0.390049[/C][C]3.5749[/C][C]0.000292[/C][/ROW]
[ROW][C]13[/C][C]0.340578[/C][C]3.1215[/C][C]0.001234[/C][/ROW]
[ROW][C]14[/C][C]0.295232[/C][C]2.7058[/C][C]0.004125[/C][/ROW]
[ROW][C]15[/C][C]0.255102[/C][C]2.338[/C][C]0.010881[/C][/ROW]
[ROW][C]16[/C][C]0.219266[/C][C]2.0096[/C][C]0.023842[/C][/ROW]
[ROW][C]17[/C][C]0.18594[/C][C]1.7042[/C][C]0.046023[/C][/ROW]
[ROW][C]18[/C][C]0.1563[/C][C]1.4325[/C][C]0.077854[/C][/ROW]
[ROW][C]19[/C][C]0.130434[/C][C]1.1954[/C][C]0.117639[/C][/ROW]
[ROW][C]20[/C][C]0.106221[/C][C]0.9735[/C][C]0.166541[/C][/ROW]
[ROW][C]21[/C][C]0.084549[/C][C]0.7749[/C][C]0.220286[/C][/ROW]
[ROW][C]22[/C][C]0.064054[/C][C]0.5871[/C][C]0.279367[/C][/ROW]
[ROW][C]23[/C][C]0.04305[/C][C]0.3946[/C][C]0.347082[/C][/ROW]
[ROW][C]24[/C][C]0.023398[/C][C]0.2144[/C][C]0.415358[/C][/ROW]
[ROW][C]25[/C][C]0.010534[/C][C]0.0965[/C][C]0.461658[/C][/ROW]
[ROW][C]26[/C][C]0.001918[/C][C]0.0176[/C][C]0.493009[/C][/ROW]
[ROW][C]27[/C][C]-0.003168[/C][C]-0.029[/C][C]0.488453[/C][/ROW]
[ROW][C]28[/C][C]-0.005185[/C][C]-0.0475[/C][C]0.481106[/C][/ROW]
[ROW][C]29[/C][C]-0.00661[/C][C]-0.0606[/C][C]0.475918[/C][/ROW]
[ROW][C]30[/C][C]-0.005512[/C][C]-0.0505[/C][C]0.479916[/C][/ROW]
[ROW][C]31[/C][C]-0.002979[/C][C]-0.0273[/C][C]0.489143[/C][/ROW]
[ROW][C]32[/C][C]-0.000749[/C][C]-0.0069[/C][C]0.497269[/C][/ROW]
[ROW][C]33[/C][C]0.000933[/C][C]0.0085[/C][C]0.4966[/C][/ROW]
[ROW][C]34[/C][C]0.000311[/C][C]0.0029[/C][C]0.498866[/C][/ROW]
[ROW][C]35[/C][C]-0.004718[/C][C]-0.0432[/C][C]0.482807[/C][/ROW]
[ROW][C]36[/C][C]-0.014522[/C][C]-0.1331[/C][C]0.447219[/C][/ROW]
[ROW][C]37[/C][C]-0.023196[/C][C]-0.2126[/C][C]0.41608[/C][/ROW]
[ROW][C]38[/C][C]-0.030361[/C][C]-0.2783[/C][C]0.390746[/C][/ROW]
[ROW][C]39[/C][C]-0.03803[/C][C]-0.3486[/C][C]0.364148[/C][/ROW]
[ROW][C]40[/C][C]-0.048235[/C][C]-0.4421[/C][C]0.329783[/C][/ROW]
[ROW][C]41[/C][C]-0.062163[/C][C]-0.5697[/C][C]0.285191[/C][/ROW]
[ROW][C]42[/C][C]-0.077576[/C][C]-0.711[/C][C]0.239529[/C][/ROW]
[ROW][C]43[/C][C]-0.095167[/C][C]-0.8722[/C][C]0.192787[/C][/ROW]
[ROW][C]44[/C][C]-0.11674[/C][C]-1.0699[/C][C]0.143856[/C][/ROW]
[ROW][C]45[/C][C]-0.14225[/C][C]-1.3037[/C][C]0.097942[/C][/ROW]
[ROW][C]46[/C][C]-0.172115[/C][C]-1.5775[/C][C]0.059224[/C][/ROW]
[ROW][C]47[/C][C]-0.207625[/C][C]-1.9029[/C][C]0.030239[/C][/ROW]
[ROW][C]48[/C][C]-0.243295[/C][C]-2.2298[/C][C]0.014213[/C][/ROW]
[/TABLE]
Source: https://freestatistics.org/blog/index.php?pk=242915&T=1

Globally Unique Identifier (entire table): ba.freestatistics.org/blog/index.php?pk=242915&T=1

As an alternative you can also use a QR Code:  

The GUIDs for individual cells are displayed in the table below:

Autocorrelation Function
Time lag kACF(k)T-STATP-value
10.9534818.73880
20.905238.29660
30.8560867.84620
40.8073217.39920
50.7566876.93510
60.7045556.45740
70.6541665.99550
80.6034035.53030
90.5515585.05511e-06
100.4991954.57528e-06
110.4458954.08675e-05
120.3900493.57490.000292
130.3405783.12150.001234
140.2952322.70580.004125
150.2551022.3380.010881
160.2192662.00960.023842
170.185941.70420.046023
180.15631.43250.077854
190.1304341.19540.117639
200.1062210.97350.166541
210.0845490.77490.220286
220.0640540.58710.279367
230.043050.39460.347082
240.0233980.21440.415358
250.0105340.09650.461658
260.0019180.01760.493009
27-0.003168-0.0290.488453
28-0.005185-0.04750.481106
29-0.00661-0.06060.475918
30-0.005512-0.05050.479916
31-0.002979-0.02730.489143
32-0.000749-0.00690.497269
330.0009330.00850.4966
340.0003110.00290.498866
35-0.004718-0.04320.482807
36-0.014522-0.13310.447219
37-0.023196-0.21260.41608
38-0.030361-0.27830.390746
39-0.03803-0.34860.364148
40-0.048235-0.44210.329783
41-0.062163-0.56970.285191
42-0.077576-0.7110.239529
43-0.095167-0.87220.192787
44-0.11674-1.06990.143856
45-0.14225-1.30370.097942
46-0.172115-1.57750.059224
47-0.207625-1.90290.030239
48-0.243295-2.22980.014213


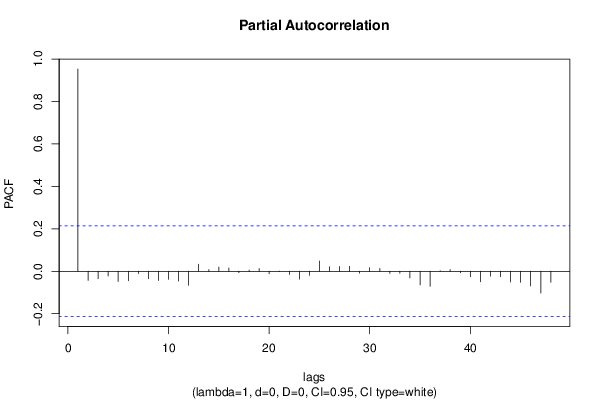
Partial Autocorrelation Function
Time lag kPACF(k)T-STATP-value
10.9534818.73880
2-0.042884-0.3930.347644
3-0.034826-0.31920.375191
4-0.021964-0.20130.420475
5-0.047685-0.4370.331601
6-0.044783-0.41040.341263
7-0.010392-0.09520.462174
8-0.035188-0.32250.373936
9-0.043644-0.40.345084
10-0.037906-0.34740.364575
11-0.045583-0.41780.338589
12-0.065545-0.60070.274819
130.0330040.30250.381515
140.007750.0710.471773
150.0204550.18750.425872
160.0152680.13990.444523
17-0.006331-0.0580.476932
180.0055370.05070.479824
190.0126290.11570.454064
20-0.01133-0.10380.458772
21-0.000626-0.00570.49772
22-0.015068-0.13810.445245
23-0.03688-0.3380.368099
24-0.019277-0.17670.430095
250.048390.44350.329272
260.0214790.19690.422207
270.0222060.20350.419611
280.023020.2110.416708
29-0.008667-0.07940.468439
300.0166430.15250.439564
310.0127720.11710.453549
32-0.009997-0.09160.463608
33-0.009588-0.08790.465093
34-0.031169-0.28570.387916
35-0.064124-0.58770.279154
36-0.070724-0.64820.259314
370.0027020.02480.49015
380.0078030.07150.471578
39-0.006817-0.06250.475165
40-0.02555-0.23420.407711
41-0.049377-0.45250.32602
42-0.022782-0.20880.417556
43-0.025881-0.23720.406538
44-0.050562-0.46340.322135
45-0.051959-0.47620.31758
46-0.068991-0.63230.26445
47-0.102753-0.94180.174511
48-0.051633-0.47320.318639

\begin{tabular}{lllllllll}
\hline
Partial Autocorrelation Function \tabularnewline
Time lag k & PACF(k) & T-STAT & P-value \tabularnewline
1 & 0.953481 & 8.7388 & 0 \tabularnewline
2 & -0.042884 & -0.393 & 0.347644 \tabularnewline
3 & -0.034826 & -0.3192 & 0.375191 \tabularnewline
4 & -0.021964 & -0.2013 & 0.420475 \tabularnewline
5 & -0.047685 & -0.437 & 0.331601 \tabularnewline
6 & -0.044783 & -0.4104 & 0.341263 \tabularnewline
7 & -0.010392 & -0.0952 & 0.462174 \tabularnewline
8 & -0.035188 & -0.3225 & 0.373936 \tabularnewline
9 & -0.043644 & -0.4 & 0.345084 \tabularnewline
10 & -0.037906 & -0.3474 & 0.364575 \tabularnewline
11 & -0.045583 & -0.4178 & 0.338589 \tabularnewline
12 & -0.065545 & -0.6007 & 0.274819 \tabularnewline
13 & 0.033004 & 0.3025 & 0.381515 \tabularnewline
14 & 0.00775 & 0.071 & 0.471773 \tabularnewline
15 & 0.020455 & 0.1875 & 0.425872 \tabularnewline
16 & 0.015268 & 0.1399 & 0.444523 \tabularnewline
17 & -0.006331 & -0.058 & 0.476932 \tabularnewline
18 & 0.005537 & 0.0507 & 0.479824 \tabularnewline
19 & 0.012629 & 0.1157 & 0.454064 \tabularnewline
20 & -0.01133 & -0.1038 & 0.458772 \tabularnewline
21 & -0.000626 & -0.0057 & 0.49772 \tabularnewline
22 & -0.015068 & -0.1381 & 0.445245 \tabularnewline
23 & -0.03688 & -0.338 & 0.368099 \tabularnewline
24 & -0.019277 & -0.1767 & 0.430095 \tabularnewline
25 & 0.04839 & 0.4435 & 0.329272 \tabularnewline
26 & 0.021479 & 0.1969 & 0.422207 \tabularnewline
27 & 0.022206 & 0.2035 & 0.419611 \tabularnewline
28 & 0.02302 & 0.211 & 0.416708 \tabularnewline
29 & -0.008667 & -0.0794 & 0.468439 \tabularnewline
30 & 0.016643 & 0.1525 & 0.439564 \tabularnewline
31 & 0.012772 & 0.1171 & 0.453549 \tabularnewline
32 & -0.009997 & -0.0916 & 0.463608 \tabularnewline
33 & -0.009588 & -0.0879 & 0.465093 \tabularnewline
34 & -0.031169 & -0.2857 & 0.387916 \tabularnewline
35 & -0.064124 & -0.5877 & 0.279154 \tabularnewline
36 & -0.070724 & -0.6482 & 0.259314 \tabularnewline
37 & 0.002702 & 0.0248 & 0.49015 \tabularnewline
38 & 0.007803 & 0.0715 & 0.471578 \tabularnewline
39 & -0.006817 & -0.0625 & 0.475165 \tabularnewline
40 & -0.02555 & -0.2342 & 0.407711 \tabularnewline
41 & -0.049377 & -0.4525 & 0.32602 \tabularnewline
42 & -0.022782 & -0.2088 & 0.417556 \tabularnewline
43 & -0.025881 & -0.2372 & 0.406538 \tabularnewline
44 & -0.050562 & -0.4634 & 0.322135 \tabularnewline
45 & -0.051959 & -0.4762 & 0.31758 \tabularnewline
46 & -0.068991 & -0.6323 & 0.26445 \tabularnewline
47 & -0.102753 & -0.9418 & 0.174511 \tabularnewline
48 & -0.051633 & -0.4732 & 0.318639 \tabularnewline
\hline
\end{tabular}
%Source: https://freestatistics.org/blog/index.php?pk=242915&T=2

[TABLE]
[ROW][C]Partial Autocorrelation Function[/C][/ROW]
[ROW][C]Time lag k[/C][C]PACF(k)[/C][C]T-STAT[/C][C]P-value[/C][/ROW]
[ROW][C]1[/C][C]0.953481[/C][C]8.7388[/C][C]0[/C][/ROW]
[ROW][C]2[/C][C]-0.042884[/C][C]-0.393[/C][C]0.347644[/C][/ROW]
[ROW][C]3[/C][C]-0.034826[/C][C]-0.3192[/C][C]0.375191[/C][/ROW]
[ROW][C]4[/C][C]-0.021964[/C][C]-0.2013[/C][C]0.420475[/C][/ROW]
[ROW][C]5[/C][C]-0.047685[/C][C]-0.437[/C][C]0.331601[/C][/ROW]
[ROW][C]6[/C][C]-0.044783[/C][C]-0.4104[/C][C]0.341263[/C][/ROW]
[ROW][C]7[/C][C]-0.010392[/C][C]-0.0952[/C][C]0.462174[/C][/ROW]
[ROW][C]8[/C][C]-0.035188[/C][C]-0.3225[/C][C]0.373936[/C][/ROW]
[ROW][C]9[/C][C]-0.043644[/C][C]-0.4[/C][C]0.345084[/C][/ROW]
[ROW][C]10[/C][C]-0.037906[/C][C]-0.3474[/C][C]0.364575[/C][/ROW]
[ROW][C]11[/C][C]-0.045583[/C][C]-0.4178[/C][C]0.338589[/C][/ROW]
[ROW][C]12[/C][C]-0.065545[/C][C]-0.6007[/C][C]0.274819[/C][/ROW]
[ROW][C]13[/C][C]0.033004[/C][C]0.3025[/C][C]0.381515[/C][/ROW]
[ROW][C]14[/C][C]0.00775[/C][C]0.071[/C][C]0.471773[/C][/ROW]
[ROW][C]15[/C][C]0.020455[/C][C]0.1875[/C][C]0.425872[/C][/ROW]
[ROW][C]16[/C][C]0.015268[/C][C]0.1399[/C][C]0.444523[/C][/ROW]
[ROW][C]17[/C][C]-0.006331[/C][C]-0.058[/C][C]0.476932[/C][/ROW]
[ROW][C]18[/C][C]0.005537[/C][C]0.0507[/C][C]0.479824[/C][/ROW]
[ROW][C]19[/C][C]0.012629[/C][C]0.1157[/C][C]0.454064[/C][/ROW]
[ROW][C]20[/C][C]-0.01133[/C][C]-0.1038[/C][C]0.458772[/C][/ROW]
[ROW][C]21[/C][C]-0.000626[/C][C]-0.0057[/C][C]0.49772[/C][/ROW]
[ROW][C]22[/C][C]-0.015068[/C][C]-0.1381[/C][C]0.445245[/C][/ROW]
[ROW][C]23[/C][C]-0.03688[/C][C]-0.338[/C][C]0.368099[/C][/ROW]
[ROW][C]24[/C][C]-0.019277[/C][C]-0.1767[/C][C]0.430095[/C][/ROW]
[ROW][C]25[/C][C]0.04839[/C][C]0.4435[/C][C]0.329272[/C][/ROW]
[ROW][C]26[/C][C]0.021479[/C][C]0.1969[/C][C]0.422207[/C][/ROW]
[ROW][C]27[/C][C]0.022206[/C][C]0.2035[/C][C]0.419611[/C][/ROW]
[ROW][C]28[/C][C]0.02302[/C][C]0.211[/C][C]0.416708[/C][/ROW]
[ROW][C]29[/C][C]-0.008667[/C][C]-0.0794[/C][C]0.468439[/C][/ROW]
[ROW][C]30[/C][C]0.016643[/C][C]0.1525[/C][C]0.439564[/C][/ROW]
[ROW][C]31[/C][C]0.012772[/C][C]0.1171[/C][C]0.453549[/C][/ROW]
[ROW][C]32[/C][C]-0.009997[/C][C]-0.0916[/C][C]0.463608[/C][/ROW]
[ROW][C]33[/C][C]-0.009588[/C][C]-0.0879[/C][C]0.465093[/C][/ROW]
[ROW][C]34[/C][C]-0.031169[/C][C]-0.2857[/C][C]0.387916[/C][/ROW]
[ROW][C]35[/C][C]-0.064124[/C][C]-0.5877[/C][C]0.279154[/C][/ROW]
[ROW][C]36[/C][C]-0.070724[/C][C]-0.6482[/C][C]0.259314[/C][/ROW]
[ROW][C]37[/C][C]0.002702[/C][C]0.0248[/C][C]0.49015[/C][/ROW]
[ROW][C]38[/C][C]0.007803[/C][C]0.0715[/C][C]0.471578[/C][/ROW]
[ROW][C]39[/C][C]-0.006817[/C][C]-0.0625[/C][C]0.475165[/C][/ROW]
[ROW][C]40[/C][C]-0.02555[/C][C]-0.2342[/C][C]0.407711[/C][/ROW]
[ROW][C]41[/C][C]-0.049377[/C][C]-0.4525[/C][C]0.32602[/C][/ROW]
[ROW][C]42[/C][C]-0.022782[/C][C]-0.2088[/C][C]0.417556[/C][/ROW]
[ROW][C]43[/C][C]-0.025881[/C][C]-0.2372[/C][C]0.406538[/C][/ROW]
[ROW][C]44[/C][C]-0.050562[/C][C]-0.4634[/C][C]0.322135[/C][/ROW]
[ROW][C]45[/C][C]-0.051959[/C][C]-0.4762[/C][C]0.31758[/C][/ROW]
[ROW][C]46[/C][C]-0.068991[/C][C]-0.6323[/C][C]0.26445[/C][/ROW]
[ROW][C]47[/C][C]-0.102753[/C][C]-0.9418[/C][C]0.174511[/C][/ROW]
[ROW][C]48[/C][C]-0.051633[/C][C]-0.4732[/C][C]0.318639[/C][/ROW]
[/TABLE]
Source: https://freestatistics.org/blog/index.php?pk=242915&T=2

Globally Unique Identifier (entire table): ba.freestatistics.org/blog/index.php?pk=242915&T=2

As an alternative you can also use a QR Code:  

The GUIDs for individual cells are displayed in the table below:

Partial Autocorrelation Function
Time lag kPACF(k)T-STATP-value
10.9534818.73880
2-0.042884-0.3930.347644
3-0.034826-0.31920.375191
4-0.021964-0.20130.420475
5-0.047685-0.4370.331601
6-0.044783-0.41040.341263
7-0.010392-0.09520.462174
8-0.035188-0.32250.373936
9-0.043644-0.40.345084
10-0.037906-0.34740.364575
11-0.045583-0.41780.338589
12-0.065545-0.60070.274819
130.0330040.30250.381515
140.007750.0710.471773
150.0204550.18750.425872
160.0152680.13990.444523
17-0.006331-0.0580.476932
180.0055370.05070.479824
190.0126290.11570.454064
20-0.01133-0.10380.458772
21-0.000626-0.00570.49772
22-0.015068-0.13810.445245
23-0.03688-0.3380.368099
24-0.019277-0.17670.430095
250.048390.44350.329272
260.0214790.19690.422207
270.0222060.20350.419611
280.023020.2110.416708
29-0.008667-0.07940.468439
300.0166430.15250.439564
310.0127720.11710.453549
32-0.009997-0.09160.463608
33-0.009588-0.08790.465093
34-0.031169-0.28570.387916
35-0.064124-0.58770.279154
36-0.070724-0.64820.259314
370.0027020.02480.49015
380.0078030.07150.471578
39-0.006817-0.06250.475165
40-0.02555-0.23420.407711
41-0.049377-0.45250.32602
42-0.022782-0.20880.417556
43-0.025881-0.23720.406538
44-0.050562-0.46340.322135
45-0.051959-0.47620.31758
46-0.068991-0.63230.26445
47-0.102753-0.94180.174511
48-0.051633-0.47320.318639


Parameters (Session):
par1 = 48 ; par2 = 1 ; par3 = 0 ; par4 = 0 ; par5 = 12 ; par6 = White Noise ; par7 = 0.95 ;
Parameters (R input):
par1 = 48 ; par2 = 1 ; par3 = 0 ; par4 = 0 ; par5 = 12 ; par6 = White Noise ; par7 = 0.95 ; par8 = ;
R code (references can be found in the software module):
if (par1 == 'Default') {
par1 = 10*log10(length(x))
} else {
par1 <- as.numeric(par1)
}
par2 <- as.numeric(par2)
par3 <- as.numeric(par3)
par4 <- as.numeric(par4)
par5 <- as.numeric(par5)
if (par6 == 'White Noise') par6 <- 'white' else par6 <- 'ma'
par7 <- as.numeric(par7)
if (par8 != '') par8 <- as.numeric(par8)
ox <- x
if (par8 == '') {
if (par2 == 0) {
x <- log(x)
} else {
x <- (x ^ par2 - 1) / par2
}
} else {
x <- log(x,base=par8)
}
if (par3 > 0) x <- diff(x,lag=1,difference=par3)
if (par4 > 0) x <- diff(x,lag=par5,difference=par4)
bitmap(file='picts.png')
op <- par(mfrow=c(2,1))
plot(ox,type='l',main='Original Time Series',xlab='time',ylab='value')
if (par8=='') {
mytitle <- paste('Working Time Series (lambda=',par2,', d=',par3,', D=',par4,')',sep='')
mysub <- paste('(lambda=',par2,', d=',par3,', D=',par4,', CI=', par7, ', CI type=',par6,')',sep='')
} else {
mytitle <- paste('Working Time Series (base=',par8,', d=',par3,', D=',par4,')',sep='')
mysub <- paste('(base=',par8,', d=',par3,', D=',par4,', CI=', par7, ', CI type=',par6,')',sep='')
}
plot(x,type='l', main=mytitle,xlab='time',ylab='value')
par(op)
dev.off()
bitmap(file='pic1.png')
racf <- acf(x, par1, main='Autocorrelation', xlab='time lag', ylab='ACF', ci.type=par6, ci=par7, sub=mysub)
dev.off()
bitmap(file='pic2.png')
rpacf <- pacf(x,par1,main='Partial Autocorrelation',xlab='lags',ylab='PACF',sub=mysub)
dev.off()
(myacf <- c(racf$acf))
(mypacf <- c(rpacf$acf))
lengthx <- length(x)
sqrtn <- sqrt(lengthx)
load(file='createtable')
a<-table.start()
a<-table.row.start(a)
a<-table.element(a,'Autocorrelation Function',4,TRUE)
a<-table.row.end(a)
a<-table.row.start(a)
a<-table.element(a,'Time lag k',header=TRUE)
a<-table.element(a,hyperlink('basics.htm','ACF(k)','click here for more information about the Autocorrelation Function'),header=TRUE)
a<-table.element(a,'T-STAT',header=TRUE)
a<-table.element(a,'P-value',header=TRUE)
a<-table.row.end(a)
for (i in 2:(par1+1)) {
a<-table.row.start(a)
a<-table.element(a,i-1,header=TRUE)
a<-table.element(a,round(myacf[i],6))
mytstat <- myacf[i]*sqrtn
a<-table.element(a,round(mytstat,4))
a<-table.element(a,round(1-pt(abs(mytstat),lengthx),6))
a<-table.row.end(a)
}
a<-table.end(a)
table.save(a,file='mytable.tab')
a<-table.start()
a<-table.row.start(a)
a<-table.element(a,'Partial Autocorrelation Function',4,TRUE)
a<-table.row.end(a)
a<-table.row.start(a)
a<-table.element(a,'Time lag k',header=TRUE)
a<-table.element(a,hyperlink('basics.htm','PACF(k)','click here for more information about the Partial Autocorrelation Function'),header=TRUE)
a<-table.element(a,'T-STAT',header=TRUE)
a<-table.element(a,'P-value',header=TRUE)
a<-table.row.end(a)
for (i in 1:par1) {
a<-table.row.start(a)
a<-table.element(a,i,header=TRUE)
a<-table.element(a,round(mypacf[i],6))
mytstat <- mypacf[i]*sqrtn
a<-table.element(a,round(mytstat,4))
a<-table.element(a,round(1-pt(abs(mytstat),lengthx),6))
a<-table.row.end(a)
}
a<-table.end(a)
table.save(a,file='mytable1.tab')