Free Statistics

of Irreproducible Research!

Author's title

Author*Unverified author*
R Software Modulerwasp_autocorrelation.wasp
Title produced by software(Partial) Autocorrelation Function
Date of computationThu, 16 Oct 2014 18:26:06 +0100
Cite this page as followsStatistical Computations at FreeStatistics.org, Office for Research Development and Education, URL https://freestatistics.org/blog/index.php?v=date/2014/Oct/16/t14134803950vs2lljsekhibnr.htm/, Retrieved Mon, 13 May 2024 15:18:48 +0000
Statistical Computations at FreeStatistics.org, Office for Research Development and Education, URL https://freestatistics.org/blog/index.php?pk=242819, Retrieved Mon, 13 May 2024 15:18:48 +0000
QR Codes:

Original text written by user:
IsPrivate?No (this computation is public)
User-defined keywords
Estimated Impact57
Family? (F = Feedback message, R = changed R code, M = changed R Module, P = changed Parameters, D = changed Data)
-       [(Partial) Autocorrelation Function] [] [2014-10-16 17:26:06] [d67845bcf6d8dd3cd224f69460cf281c] [Current]
Feedback Forum

Post a new message
Dataseries X:
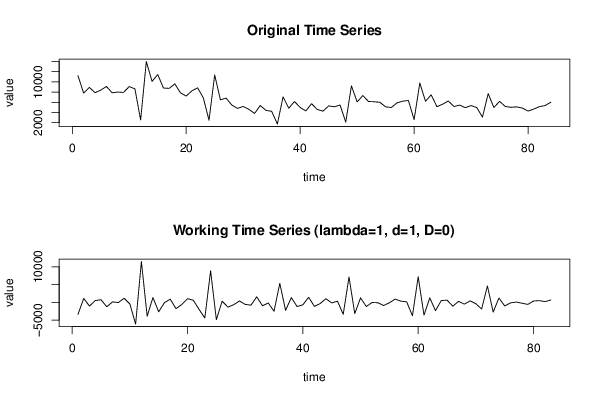
11201
7804
8918
7874
8374
9099
7860
8000
7930
9079
8620
2513
13991
10095
11445
8792
8716
9607
7843
7221
8242
8839
6874
2478
11351
6480
6809
5464
4791
5179
4605
3809
5366
4402
4225
1719
7064
4820
6150
4971
4295
5713
4588
4253
5275
5114
5450
2088
9228
6060
7322
6147
6102
5988
5095
4971
5883
6211
6352
2581
9787
6187
7456
5127
5615
6243
5161
5439
4939
5349
4959
3080
7695
4965
6179
5166
5012
5094
4855
4272
4658
5146
5346
6009


Summary of computational transaction
Raw Inputview raw input (R code)
Raw Outputview raw output of R engine
Computing time1 seconds
R Server'Sir Ronald Aylmer Fisher' @ fisher.wessa.net

\begin{tabular}{lllllllll}
\hline
Summary of computational transaction \tabularnewline
Raw Input & view raw input (R code)  \tabularnewline
Raw Output & view raw output of R engine  \tabularnewline
Computing time & 1 seconds \tabularnewline
R Server & 'Sir Ronald Aylmer Fisher' @ fisher.wessa.net \tabularnewline
\hline
\end{tabular}
%Source: https://freestatistics.org/blog/index.php?pk=242819&T=0

[TABLE]
[ROW][C]Summary of computational transaction[/C][/ROW]
[ROW][C]Raw Input[/C][C]view raw input (R code) [/C][/ROW]
[ROW][C]Raw Output[/C][C]view raw output of R engine [/C][/ROW]
[ROW][C]Computing time[/C][C]1 seconds[/C][/ROW]
[ROW][C]R Server[/C][C]'Sir Ronald Aylmer Fisher' @ fisher.wessa.net[/C][/ROW]
[/TABLE]
Source: https://freestatistics.org/blog/index.php?pk=242819&T=0

Globally Unique Identifier (entire table): ba.freestatistics.org/blog/index.php?pk=242819&T=0

As an alternative you can also use a QR Code:  

The GUIDs for individual cells are displayed in the table below:

Summary of computational transaction
Raw Inputview raw input (R code)
Raw Outputview raw output of R engine
Computing time1 seconds
R Server'Sir Ronald Aylmer Fisher' @ fisher.wessa.net


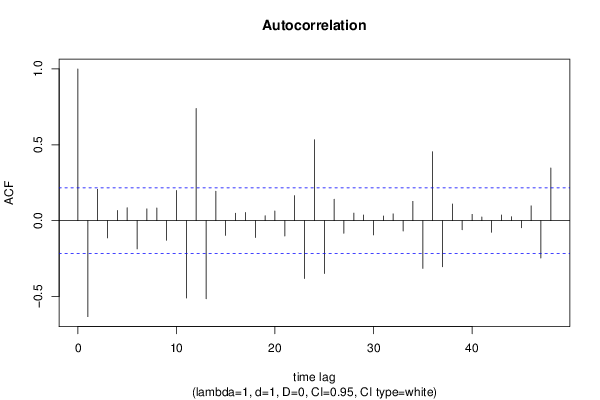
Autocorrelation Function
Time lag kACF(k)T-STATP-value
1-0.633147-5.76820
20.2065771.8820.03167
3-0.113932-1.0380.15115
40.0673350.61350.270627
50.0853310.77740.219567
6-0.186493-1.6990.04653
70.0773570.70480.241468
80.0836180.76180.22417
9-0.129441-1.17930.120832
100.1991171.8140.036643
11-0.509982-4.64626e-06
120.7396776.73880
13-0.515084-4.69265e-06
140.1936851.76460.040659
15-0.097116-0.88480.189418
160.0490940.44730.327925
170.0532310.4850.314491
18-0.111495-1.01580.156347
190.0318460.29010.386221
200.0636220.57960.281868
21-0.101406-0.92390.179121
220.1650071.50330.068281
23-0.381959-3.47980.000401
240.5327354.85343e-06
25-0.348679-3.17660.001046
260.1410491.2850.101181
27-0.083443-0.76020.224645
280.0495450.45140.326449
290.0369620.33670.368581
30-0.094251-0.85870.196499
310.0309320.28180.389398
320.0447190.40740.342377
33-0.068495-0.6240.267163
340.1271121.1580.125084
35-0.314732-2.86730.002623
360.4536584.1334.3e-05
37-0.304421-2.77340.003425
380.1100981.0030.159378
39-0.060758-0.55350.290694
400.0411870.37520.354221
410.0234130.21330.415808
42-0.077097-0.70240.242201
430.0369550.33670.368604
440.0250420.22810.410049
45-0.046915-0.42740.335093
460.0975120.88840.188454
47-0.246087-2.2420.013816
480.3472313.16340.00109

\begin{tabular}{lllllllll}
\hline
Autocorrelation Function \tabularnewline
Time lag k & ACF(k) & T-STAT & P-value \tabularnewline
1 & -0.633147 & -5.7682 & 0 \tabularnewline
2 & 0.206577 & 1.882 & 0.03167 \tabularnewline
3 & -0.113932 & -1.038 & 0.15115 \tabularnewline
4 & 0.067335 & 0.6135 & 0.270627 \tabularnewline
5 & 0.085331 & 0.7774 & 0.219567 \tabularnewline
6 & -0.186493 & -1.699 & 0.04653 \tabularnewline
7 & 0.077357 & 0.7048 & 0.241468 \tabularnewline
8 & 0.083618 & 0.7618 & 0.22417 \tabularnewline
9 & -0.129441 & -1.1793 & 0.120832 \tabularnewline
10 & 0.199117 & 1.814 & 0.036643 \tabularnewline
11 & -0.509982 & -4.6462 & 6e-06 \tabularnewline
12 & 0.739677 & 6.7388 & 0 \tabularnewline
13 & -0.515084 & -4.6926 & 5e-06 \tabularnewline
14 & 0.193685 & 1.7646 & 0.040659 \tabularnewline
15 & -0.097116 & -0.8848 & 0.189418 \tabularnewline
16 & 0.049094 & 0.4473 & 0.327925 \tabularnewline
17 & 0.053231 & 0.485 & 0.314491 \tabularnewline
18 & -0.111495 & -1.0158 & 0.156347 \tabularnewline
19 & 0.031846 & 0.2901 & 0.386221 \tabularnewline
20 & 0.063622 & 0.5796 & 0.281868 \tabularnewline
21 & -0.101406 & -0.9239 & 0.179121 \tabularnewline
22 & 0.165007 & 1.5033 & 0.068281 \tabularnewline
23 & -0.381959 & -3.4798 & 0.000401 \tabularnewline
24 & 0.532735 & 4.8534 & 3e-06 \tabularnewline
25 & -0.348679 & -3.1766 & 0.001046 \tabularnewline
26 & 0.141049 & 1.285 & 0.101181 \tabularnewline
27 & -0.083443 & -0.7602 & 0.224645 \tabularnewline
28 & 0.049545 & 0.4514 & 0.326449 \tabularnewline
29 & 0.036962 & 0.3367 & 0.368581 \tabularnewline
30 & -0.094251 & -0.8587 & 0.196499 \tabularnewline
31 & 0.030932 & 0.2818 & 0.389398 \tabularnewline
32 & 0.044719 & 0.4074 & 0.342377 \tabularnewline
33 & -0.068495 & -0.624 & 0.267163 \tabularnewline
34 & 0.127112 & 1.158 & 0.125084 \tabularnewline
35 & -0.314732 & -2.8673 & 0.002623 \tabularnewline
36 & 0.453658 & 4.133 & 4.3e-05 \tabularnewline
37 & -0.304421 & -2.7734 & 0.003425 \tabularnewline
38 & 0.110098 & 1.003 & 0.159378 \tabularnewline
39 & -0.060758 & -0.5535 & 0.290694 \tabularnewline
40 & 0.041187 & 0.3752 & 0.354221 \tabularnewline
41 & 0.023413 & 0.2133 & 0.415808 \tabularnewline
42 & -0.077097 & -0.7024 & 0.242201 \tabularnewline
43 & 0.036955 & 0.3367 & 0.368604 \tabularnewline
44 & 0.025042 & 0.2281 & 0.410049 \tabularnewline
45 & -0.046915 & -0.4274 & 0.335093 \tabularnewline
46 & 0.097512 & 0.8884 & 0.188454 \tabularnewline
47 & -0.246087 & -2.242 & 0.013816 \tabularnewline
48 & 0.347231 & 3.1634 & 0.00109 \tabularnewline
\hline
\end{tabular}
%Source: https://freestatistics.org/blog/index.php?pk=242819&T=1

[TABLE]
[ROW][C]Autocorrelation Function[/C][/ROW]
[ROW][C]Time lag k[/C][C]ACF(k)[/C][C]T-STAT[/C][C]P-value[/C][/ROW]
[ROW][C]1[/C][C]-0.633147[/C][C]-5.7682[/C][C]0[/C][/ROW]
[ROW][C]2[/C][C]0.206577[/C][C]1.882[/C][C]0.03167[/C][/ROW]
[ROW][C]3[/C][C]-0.113932[/C][C]-1.038[/C][C]0.15115[/C][/ROW]
[ROW][C]4[/C][C]0.067335[/C][C]0.6135[/C][C]0.270627[/C][/ROW]
[ROW][C]5[/C][C]0.085331[/C][C]0.7774[/C][C]0.219567[/C][/ROW]
[ROW][C]6[/C][C]-0.186493[/C][C]-1.699[/C][C]0.04653[/C][/ROW]
[ROW][C]7[/C][C]0.077357[/C][C]0.7048[/C][C]0.241468[/C][/ROW]
[ROW][C]8[/C][C]0.083618[/C][C]0.7618[/C][C]0.22417[/C][/ROW]
[ROW][C]9[/C][C]-0.129441[/C][C]-1.1793[/C][C]0.120832[/C][/ROW]
[ROW][C]10[/C][C]0.199117[/C][C]1.814[/C][C]0.036643[/C][/ROW]
[ROW][C]11[/C][C]-0.509982[/C][C]-4.6462[/C][C]6e-06[/C][/ROW]
[ROW][C]12[/C][C]0.739677[/C][C]6.7388[/C][C]0[/C][/ROW]
[ROW][C]13[/C][C]-0.515084[/C][C]-4.6926[/C][C]5e-06[/C][/ROW]
[ROW][C]14[/C][C]0.193685[/C][C]1.7646[/C][C]0.040659[/C][/ROW]
[ROW][C]15[/C][C]-0.097116[/C][C]-0.8848[/C][C]0.189418[/C][/ROW]
[ROW][C]16[/C][C]0.049094[/C][C]0.4473[/C][C]0.327925[/C][/ROW]
[ROW][C]17[/C][C]0.053231[/C][C]0.485[/C][C]0.314491[/C][/ROW]
[ROW][C]18[/C][C]-0.111495[/C][C]-1.0158[/C][C]0.156347[/C][/ROW]
[ROW][C]19[/C][C]0.031846[/C][C]0.2901[/C][C]0.386221[/C][/ROW]
[ROW][C]20[/C][C]0.063622[/C][C]0.5796[/C][C]0.281868[/C][/ROW]
[ROW][C]21[/C][C]-0.101406[/C][C]-0.9239[/C][C]0.179121[/C][/ROW]
[ROW][C]22[/C][C]0.165007[/C][C]1.5033[/C][C]0.068281[/C][/ROW]
[ROW][C]23[/C][C]-0.381959[/C][C]-3.4798[/C][C]0.000401[/C][/ROW]
[ROW][C]24[/C][C]0.532735[/C][C]4.8534[/C][C]3e-06[/C][/ROW]
[ROW][C]25[/C][C]-0.348679[/C][C]-3.1766[/C][C]0.001046[/C][/ROW]
[ROW][C]26[/C][C]0.141049[/C][C]1.285[/C][C]0.101181[/C][/ROW]
[ROW][C]27[/C][C]-0.083443[/C][C]-0.7602[/C][C]0.224645[/C][/ROW]
[ROW][C]28[/C][C]0.049545[/C][C]0.4514[/C][C]0.326449[/C][/ROW]
[ROW][C]29[/C][C]0.036962[/C][C]0.3367[/C][C]0.368581[/C][/ROW]
[ROW][C]30[/C][C]-0.094251[/C][C]-0.8587[/C][C]0.196499[/C][/ROW]
[ROW][C]31[/C][C]0.030932[/C][C]0.2818[/C][C]0.389398[/C][/ROW]
[ROW][C]32[/C][C]0.044719[/C][C]0.4074[/C][C]0.342377[/C][/ROW]
[ROW][C]33[/C][C]-0.068495[/C][C]-0.624[/C][C]0.267163[/C][/ROW]
[ROW][C]34[/C][C]0.127112[/C][C]1.158[/C][C]0.125084[/C][/ROW]
[ROW][C]35[/C][C]-0.314732[/C][C]-2.8673[/C][C]0.002623[/C][/ROW]
[ROW][C]36[/C][C]0.453658[/C][C]4.133[/C][C]4.3e-05[/C][/ROW]
[ROW][C]37[/C][C]-0.304421[/C][C]-2.7734[/C][C]0.003425[/C][/ROW]
[ROW][C]38[/C][C]0.110098[/C][C]1.003[/C][C]0.159378[/C][/ROW]
[ROW][C]39[/C][C]-0.060758[/C][C]-0.5535[/C][C]0.290694[/C][/ROW]
[ROW][C]40[/C][C]0.041187[/C][C]0.3752[/C][C]0.354221[/C][/ROW]
[ROW][C]41[/C][C]0.023413[/C][C]0.2133[/C][C]0.415808[/C][/ROW]
[ROW][C]42[/C][C]-0.077097[/C][C]-0.7024[/C][C]0.242201[/C][/ROW]
[ROW][C]43[/C][C]0.036955[/C][C]0.3367[/C][C]0.368604[/C][/ROW]
[ROW][C]44[/C][C]0.025042[/C][C]0.2281[/C][C]0.410049[/C][/ROW]
[ROW][C]45[/C][C]-0.046915[/C][C]-0.4274[/C][C]0.335093[/C][/ROW]
[ROW][C]46[/C][C]0.097512[/C][C]0.8884[/C][C]0.188454[/C][/ROW]
[ROW][C]47[/C][C]-0.246087[/C][C]-2.242[/C][C]0.013816[/C][/ROW]
[ROW][C]48[/C][C]0.347231[/C][C]3.1634[/C][C]0.00109[/C][/ROW]
[/TABLE]
Source: https://freestatistics.org/blog/index.php?pk=242819&T=1

Globally Unique Identifier (entire table): ba.freestatistics.org/blog/index.php?pk=242819&T=1

As an alternative you can also use a QR Code:  

The GUIDs for individual cells are displayed in the table below:

Autocorrelation Function
Time lag kACF(k)T-STATP-value
1-0.633147-5.76820
20.2065771.8820.03167
3-0.113932-1.0380.15115
40.0673350.61350.270627
50.0853310.77740.219567
6-0.186493-1.6990.04653
70.0773570.70480.241468
80.0836180.76180.22417
9-0.129441-1.17930.120832
100.1991171.8140.036643
11-0.509982-4.64626e-06
120.7396776.73880
13-0.515084-4.69265e-06
140.1936851.76460.040659
15-0.097116-0.88480.189418
160.0490940.44730.327925
170.0532310.4850.314491
18-0.111495-1.01580.156347
190.0318460.29010.386221
200.0636220.57960.281868
21-0.101406-0.92390.179121
220.1650071.50330.068281
23-0.381959-3.47980.000401
240.5327354.85343e-06
25-0.348679-3.17660.001046
260.1410491.2850.101181
27-0.083443-0.76020.224645
280.0495450.45140.326449
290.0369620.33670.368581
30-0.094251-0.85870.196499
310.0309320.28180.389398
320.0447190.40740.342377
33-0.068495-0.6240.267163
340.1271121.1580.125084
35-0.314732-2.86730.002623
360.4536584.1334.3e-05
37-0.304421-2.77340.003425
380.1100981.0030.159378
39-0.060758-0.55350.290694
400.0411870.37520.354221
410.0234130.21330.415808
42-0.077097-0.70240.242201
430.0369550.33670.368604
440.0250420.22810.410049
45-0.046915-0.42740.335093
460.0975120.88840.188454
47-0.246087-2.2420.013816
480.3472313.16340.00109


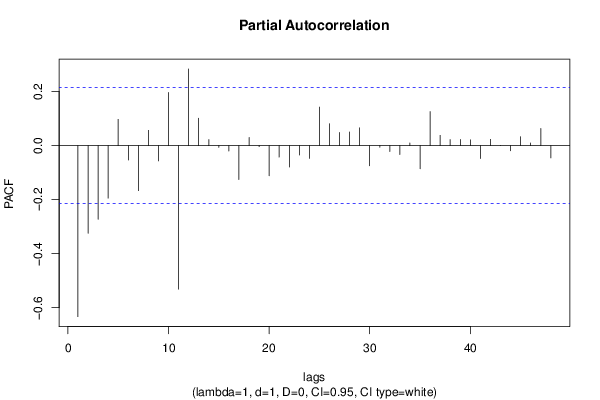
Partial Autocorrelation Function
Time lag kPACF(k)T-STATP-value
1-0.633147-5.76820
2-0.324303-2.95450.002037
3-0.272428-2.48190.007542
4-0.194562-1.77250.039987
50.0972170.88570.189172
6-0.053284-0.48540.314322
7-0.166604-1.51780.066428
80.056490.51460.304085
9-0.056456-0.51430.30419
100.1963221.78860.038666
11-0.531205-4.83953e-06
120.2837492.58510.005742
130.1014110.92390.179108
140.0221560.20180.420265
15-0.006456-0.05880.476618
16-0.020304-0.1850.426848
17-0.125248-1.14110.128562
180.0299940.27330.392668
19-0.003866-0.03520.485995
20-0.111515-1.01590.156304
21-0.042555-0.38770.349617
22-0.078989-0.71960.236889
23-0.034816-0.31720.375949
24-0.047268-0.43060.333926
250.1425611.29880.098805
260.0807870.7360.231902
270.0488360.44490.328768
280.0500970.45640.324645
290.0657310.59880.275455
30-0.074444-0.67820.249759
31-0.006393-0.05820.476847
32-0.022141-0.20170.420315
33-0.03315-0.3020.381698
340.0093630.08530.466112
35-0.085483-0.77880.219159
360.1258531.14660.127425
370.0377940.34430.365739
380.0222010.20230.420103
390.0225810.20570.418755
400.0213510.19450.423122
41-0.047934-0.43670.331731
420.0229960.20950.417284
43-0.000182-0.00170.499339
44-0.019182-0.17480.430849
450.0328570.29930.382715
460.0095530.0870.465427
470.0632510.57620.283004
48-0.045496-0.41450.339794

\begin{tabular}{lllllllll}
\hline
Partial Autocorrelation Function \tabularnewline
Time lag k & PACF(k) & T-STAT & P-value \tabularnewline
1 & -0.633147 & -5.7682 & 0 \tabularnewline
2 & -0.324303 & -2.9545 & 0.002037 \tabularnewline
3 & -0.272428 & -2.4819 & 0.007542 \tabularnewline
4 & -0.194562 & -1.7725 & 0.039987 \tabularnewline
5 & 0.097217 & 0.8857 & 0.189172 \tabularnewline
6 & -0.053284 & -0.4854 & 0.314322 \tabularnewline
7 & -0.166604 & -1.5178 & 0.066428 \tabularnewline
8 & 0.05649 & 0.5146 & 0.304085 \tabularnewline
9 & -0.056456 & -0.5143 & 0.30419 \tabularnewline
10 & 0.196322 & 1.7886 & 0.038666 \tabularnewline
11 & -0.531205 & -4.8395 & 3e-06 \tabularnewline
12 & 0.283749 & 2.5851 & 0.005742 \tabularnewline
13 & 0.101411 & 0.9239 & 0.179108 \tabularnewline
14 & 0.022156 & 0.2018 & 0.420265 \tabularnewline
15 & -0.006456 & -0.0588 & 0.476618 \tabularnewline
16 & -0.020304 & -0.185 & 0.426848 \tabularnewline
17 & -0.125248 & -1.1411 & 0.128562 \tabularnewline
18 & 0.029994 & 0.2733 & 0.392668 \tabularnewline
19 & -0.003866 & -0.0352 & 0.485995 \tabularnewline
20 & -0.111515 & -1.0159 & 0.156304 \tabularnewline
21 & -0.042555 & -0.3877 & 0.349617 \tabularnewline
22 & -0.078989 & -0.7196 & 0.236889 \tabularnewline
23 & -0.034816 & -0.3172 & 0.375949 \tabularnewline
24 & -0.047268 & -0.4306 & 0.333926 \tabularnewline
25 & 0.142561 & 1.2988 & 0.098805 \tabularnewline
26 & 0.080787 & 0.736 & 0.231902 \tabularnewline
27 & 0.048836 & 0.4449 & 0.328768 \tabularnewline
28 & 0.050097 & 0.4564 & 0.324645 \tabularnewline
29 & 0.065731 & 0.5988 & 0.275455 \tabularnewline
30 & -0.074444 & -0.6782 & 0.249759 \tabularnewline
31 & -0.006393 & -0.0582 & 0.476847 \tabularnewline
32 & -0.022141 & -0.2017 & 0.420315 \tabularnewline
33 & -0.03315 & -0.302 & 0.381698 \tabularnewline
34 & 0.009363 & 0.0853 & 0.466112 \tabularnewline
35 & -0.085483 & -0.7788 & 0.219159 \tabularnewline
36 & 0.125853 & 1.1466 & 0.127425 \tabularnewline
37 & 0.037794 & 0.3443 & 0.365739 \tabularnewline
38 & 0.022201 & 0.2023 & 0.420103 \tabularnewline
39 & 0.022581 & 0.2057 & 0.418755 \tabularnewline
40 & 0.021351 & 0.1945 & 0.423122 \tabularnewline
41 & -0.047934 & -0.4367 & 0.331731 \tabularnewline
42 & 0.022996 & 0.2095 & 0.417284 \tabularnewline
43 & -0.000182 & -0.0017 & 0.499339 \tabularnewline
44 & -0.019182 & -0.1748 & 0.430849 \tabularnewline
45 & 0.032857 & 0.2993 & 0.382715 \tabularnewline
46 & 0.009553 & 0.087 & 0.465427 \tabularnewline
47 & 0.063251 & 0.5762 & 0.283004 \tabularnewline
48 & -0.045496 & -0.4145 & 0.339794 \tabularnewline
\hline
\end{tabular}
%Source: https://freestatistics.org/blog/index.php?pk=242819&T=2

[TABLE]
[ROW][C]Partial Autocorrelation Function[/C][/ROW]
[ROW][C]Time lag k[/C][C]PACF(k)[/C][C]T-STAT[/C][C]P-value[/C][/ROW]
[ROW][C]1[/C][C]-0.633147[/C][C]-5.7682[/C][C]0[/C][/ROW]
[ROW][C]2[/C][C]-0.324303[/C][C]-2.9545[/C][C]0.002037[/C][/ROW]
[ROW][C]3[/C][C]-0.272428[/C][C]-2.4819[/C][C]0.007542[/C][/ROW]
[ROW][C]4[/C][C]-0.194562[/C][C]-1.7725[/C][C]0.039987[/C][/ROW]
[ROW][C]5[/C][C]0.097217[/C][C]0.8857[/C][C]0.189172[/C][/ROW]
[ROW][C]6[/C][C]-0.053284[/C][C]-0.4854[/C][C]0.314322[/C][/ROW]
[ROW][C]7[/C][C]-0.166604[/C][C]-1.5178[/C][C]0.066428[/C][/ROW]
[ROW][C]8[/C][C]0.05649[/C][C]0.5146[/C][C]0.304085[/C][/ROW]
[ROW][C]9[/C][C]-0.056456[/C][C]-0.5143[/C][C]0.30419[/C][/ROW]
[ROW][C]10[/C][C]0.196322[/C][C]1.7886[/C][C]0.038666[/C][/ROW]
[ROW][C]11[/C][C]-0.531205[/C][C]-4.8395[/C][C]3e-06[/C][/ROW]
[ROW][C]12[/C][C]0.283749[/C][C]2.5851[/C][C]0.005742[/C][/ROW]
[ROW][C]13[/C][C]0.101411[/C][C]0.9239[/C][C]0.179108[/C][/ROW]
[ROW][C]14[/C][C]0.022156[/C][C]0.2018[/C][C]0.420265[/C][/ROW]
[ROW][C]15[/C][C]-0.006456[/C][C]-0.0588[/C][C]0.476618[/C][/ROW]
[ROW][C]16[/C][C]-0.020304[/C][C]-0.185[/C][C]0.426848[/C][/ROW]
[ROW][C]17[/C][C]-0.125248[/C][C]-1.1411[/C][C]0.128562[/C][/ROW]
[ROW][C]18[/C][C]0.029994[/C][C]0.2733[/C][C]0.392668[/C][/ROW]
[ROW][C]19[/C][C]-0.003866[/C][C]-0.0352[/C][C]0.485995[/C][/ROW]
[ROW][C]20[/C][C]-0.111515[/C][C]-1.0159[/C][C]0.156304[/C][/ROW]
[ROW][C]21[/C][C]-0.042555[/C][C]-0.3877[/C][C]0.349617[/C][/ROW]
[ROW][C]22[/C][C]-0.078989[/C][C]-0.7196[/C][C]0.236889[/C][/ROW]
[ROW][C]23[/C][C]-0.034816[/C][C]-0.3172[/C][C]0.375949[/C][/ROW]
[ROW][C]24[/C][C]-0.047268[/C][C]-0.4306[/C][C]0.333926[/C][/ROW]
[ROW][C]25[/C][C]0.142561[/C][C]1.2988[/C][C]0.098805[/C][/ROW]
[ROW][C]26[/C][C]0.080787[/C][C]0.736[/C][C]0.231902[/C][/ROW]
[ROW][C]27[/C][C]0.048836[/C][C]0.4449[/C][C]0.328768[/C][/ROW]
[ROW][C]28[/C][C]0.050097[/C][C]0.4564[/C][C]0.324645[/C][/ROW]
[ROW][C]29[/C][C]0.065731[/C][C]0.5988[/C][C]0.275455[/C][/ROW]
[ROW][C]30[/C][C]-0.074444[/C][C]-0.6782[/C][C]0.249759[/C][/ROW]
[ROW][C]31[/C][C]-0.006393[/C][C]-0.0582[/C][C]0.476847[/C][/ROW]
[ROW][C]32[/C][C]-0.022141[/C][C]-0.2017[/C][C]0.420315[/C][/ROW]
[ROW][C]33[/C][C]-0.03315[/C][C]-0.302[/C][C]0.381698[/C][/ROW]
[ROW][C]34[/C][C]0.009363[/C][C]0.0853[/C][C]0.466112[/C][/ROW]
[ROW][C]35[/C][C]-0.085483[/C][C]-0.7788[/C][C]0.219159[/C][/ROW]
[ROW][C]36[/C][C]0.125853[/C][C]1.1466[/C][C]0.127425[/C][/ROW]
[ROW][C]37[/C][C]0.037794[/C][C]0.3443[/C][C]0.365739[/C][/ROW]
[ROW][C]38[/C][C]0.022201[/C][C]0.2023[/C][C]0.420103[/C][/ROW]
[ROW][C]39[/C][C]0.022581[/C][C]0.2057[/C][C]0.418755[/C][/ROW]
[ROW][C]40[/C][C]0.021351[/C][C]0.1945[/C][C]0.423122[/C][/ROW]
[ROW][C]41[/C][C]-0.047934[/C][C]-0.4367[/C][C]0.331731[/C][/ROW]
[ROW][C]42[/C][C]0.022996[/C][C]0.2095[/C][C]0.417284[/C][/ROW]
[ROW][C]43[/C][C]-0.000182[/C][C]-0.0017[/C][C]0.499339[/C][/ROW]
[ROW][C]44[/C][C]-0.019182[/C][C]-0.1748[/C][C]0.430849[/C][/ROW]
[ROW][C]45[/C][C]0.032857[/C][C]0.2993[/C][C]0.382715[/C][/ROW]
[ROW][C]46[/C][C]0.009553[/C][C]0.087[/C][C]0.465427[/C][/ROW]
[ROW][C]47[/C][C]0.063251[/C][C]0.5762[/C][C]0.283004[/C][/ROW]
[ROW][C]48[/C][C]-0.045496[/C][C]-0.4145[/C][C]0.339794[/C][/ROW]
[/TABLE]
Source: https://freestatistics.org/blog/index.php?pk=242819&T=2

Globally Unique Identifier (entire table): ba.freestatistics.org/blog/index.php?pk=242819&T=2

As an alternative you can also use a QR Code:  

The GUIDs for individual cells are displayed in the table below:

Partial Autocorrelation Function
Time lag kPACF(k)T-STATP-value
1-0.633147-5.76820
2-0.324303-2.95450.002037
3-0.272428-2.48190.007542
4-0.194562-1.77250.039987
50.0972170.88570.189172
6-0.053284-0.48540.314322
7-0.166604-1.51780.066428
80.056490.51460.304085
9-0.056456-0.51430.30419
100.1963221.78860.038666
11-0.531205-4.83953e-06
120.2837492.58510.005742
130.1014110.92390.179108
140.0221560.20180.420265
15-0.006456-0.05880.476618
16-0.020304-0.1850.426848
17-0.125248-1.14110.128562
180.0299940.27330.392668
19-0.003866-0.03520.485995
20-0.111515-1.01590.156304
21-0.042555-0.38770.349617
22-0.078989-0.71960.236889
23-0.034816-0.31720.375949
24-0.047268-0.43060.333926
250.1425611.29880.098805
260.0807870.7360.231902
270.0488360.44490.328768
280.0500970.45640.324645
290.0657310.59880.275455
30-0.074444-0.67820.249759
31-0.006393-0.05820.476847
32-0.022141-0.20170.420315
33-0.03315-0.3020.381698
340.0093630.08530.466112
35-0.085483-0.77880.219159
360.1258531.14660.127425
370.0377940.34430.365739
380.0222010.20230.420103
390.0225810.20570.418755
400.0213510.19450.423122
41-0.047934-0.43670.331731
420.0229960.20950.417284
43-0.000182-0.00170.499339
44-0.019182-0.17480.430849
450.0328570.29930.382715
460.0095530.0870.465427
470.0632510.57620.283004
48-0.045496-0.41450.339794


Parameters (Session):
par1 = 48 ; par2 = 1 ; par3 = 1 ; par4 = 0 ; par5 = 12 ; par6 = White Noise ; par7 = 0.95 ;
Parameters (R input):
par1 = 48 ; par2 = 1 ; par3 = 1 ; par4 = 0 ; par5 = 12 ; par6 = White Noise ; par7 = 0.95 ; par8 = ;
R code (references can be found in the software module):
par8 <- ''
par7 <- '0.95'
par6 <- 'White Noise'
par5 <- '12'
par4 <- '0'
par3 <- '0'
par2 <- '1'
par1 <- '48'
if (par1 == 'Default') {
par1 = 10*log10(length(x))
} else {
par1 <- as.numeric(par1)
}
par2 <- as.numeric(par2)
par3 <- as.numeric(par3)
par4 <- as.numeric(par4)
par5 <- as.numeric(par5)
if (par6 == 'White Noise') par6 <- 'white' else par6 <- 'ma'
par7 <- as.numeric(par7)
if (par8 != '') par8 <- as.numeric(par8)
ox <- x
if (par8 == '') {
if (par2 == 0) {
x <- log(x)
} else {
x <- (x ^ par2 - 1) / par2
}
} else {
x <- log(x,base=par8)
}
if (par3 > 0) x <- diff(x,lag=1,difference=par3)
if (par4 > 0) x <- diff(x,lag=par5,difference=par4)
bitmap(file='picts.png')
op <- par(mfrow=c(2,1))
plot(ox,type='l',main='Original Time Series',xlab='time',ylab='value')
if (par8=='') {
mytitle <- paste('Working Time Series (lambda=',par2,', d=',par3,', D=',par4,')',sep='')
mysub <- paste('(lambda=',par2,', d=',par3,', D=',par4,', CI=', par7, ', CI type=',par6,')',sep='')
} else {
mytitle <- paste('Working Time Series (base=',par8,', d=',par3,', D=',par4,')',sep='')
mysub <- paste('(base=',par8,', d=',par3,', D=',par4,', CI=', par7, ', CI type=',par6,')',sep='')
}
plot(x,type='l', main=mytitle,xlab='time',ylab='value')
par(op)
dev.off()
bitmap(file='pic1.png')
racf <- acf(x, par1, main='Autocorrelation', xlab='time lag', ylab='ACF', ci.type=par6, ci=par7, sub=mysub)
dev.off()
bitmap(file='pic2.png')
rpacf <- pacf(x,par1,main='Partial Autocorrelation',xlab='lags',ylab='PACF',sub=mysub)
dev.off()
(myacf <- c(racf$acf))
(mypacf <- c(rpacf$acf))
lengthx <- length(x)
sqrtn <- sqrt(lengthx)
load(file='createtable')
a<-table.start()
a<-table.row.start(a)
a<-table.element(a,'Autocorrelation Function',4,TRUE)
a<-table.row.end(a)
a<-table.row.start(a)
a<-table.element(a,'Time lag k',header=TRUE)
a<-table.element(a,hyperlink('basics.htm','ACF(k)','click here for more information about the Autocorrelation Function'),header=TRUE)
a<-table.element(a,'T-STAT',header=TRUE)
a<-table.element(a,'P-value',header=TRUE)
a<-table.row.end(a)
for (i in 2:(par1+1)) {
a<-table.row.start(a)
a<-table.element(a,i-1,header=TRUE)
a<-table.element(a,round(myacf[i],6))
mytstat <- myacf[i]*sqrtn
a<-table.element(a,round(mytstat,4))
a<-table.element(a,round(1-pt(abs(mytstat),lengthx),6))
a<-table.row.end(a)
}
a<-table.end(a)
table.save(a,file='mytable.tab')
a<-table.start()
a<-table.row.start(a)
a<-table.element(a,'Partial Autocorrelation Function',4,TRUE)
a<-table.row.end(a)
a<-table.row.start(a)
a<-table.element(a,'Time lag k',header=TRUE)
a<-table.element(a,hyperlink('basics.htm','PACF(k)','click here for more information about the Partial Autocorrelation Function'),header=TRUE)
a<-table.element(a,'T-STAT',header=TRUE)
a<-table.element(a,'P-value',header=TRUE)
a<-table.row.end(a)
for (i in 1:par1) {
a<-table.row.start(a)
a<-table.element(a,i,header=TRUE)
a<-table.element(a,round(mypacf[i],6))
mytstat <- mypacf[i]*sqrtn
a<-table.element(a,round(mytstat,4))
a<-table.element(a,round(1-pt(abs(mytstat),lengthx),6))
a<-table.row.end(a)
}
a<-table.end(a)
table.save(a,file='mytable1.tab')