Free Statistics

of Irreproducible Research!

Author's title

Author*Unverified author*
R Software Modulerwasp_autocorrelation.wasp
Title produced by software(Partial) Autocorrelation Function
Date of computationThu, 16 Oct 2014 18:24:02 +0100
Cite this page as followsStatistical Computations at FreeStatistics.org, Office for Research Development and Education, URL https://freestatistics.org/blog/index.php?v=date/2014/Oct/16/t1413480272xt3r314t37v4hbr.htm/, Retrieved Mon, 13 May 2024 03:59:41 +0000
Statistical Computations at FreeStatistics.org, Office for Research Development and Education, URL https://freestatistics.org/blog/index.php?pk=242816, Retrieved Mon, 13 May 2024 03:59:41 +0000
QR Codes:

Original text written by user:
IsPrivate?No (this computation is public)
User-defined keywords
Estimated Impact47
Family? (F = Feedback message, R = changed R code, M = changed R Module, P = changed Parameters, D = changed Data)
-       [(Partial) Autocorrelation Function] [] [2014-10-16 17:24:02] [d67845bcf6d8dd3cd224f69460cf281c] [Current]
Feedback Forum

Post a new message
Dataseries X:
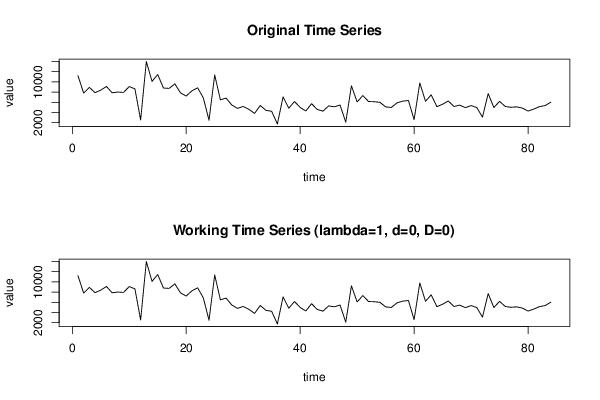
11201
7804
8918
7874
8374
9099
7860
8000
7930
9079
8620
2513
13991
10095
11445
8792
8716
9607
7843
7221
8242
8839
6874
2478
11351
6480
6809
5464
4791
5179
4605
3809
5366
4402
4225
1719
7064
4820
6150
4971
4295
5713
4588
4253
5275
5114
5450
2088
9228
6060
7322
6147
6102
5988
5095
4971
5883
6211
6352
2581
9787
6187
7456
5127
5615
6243
5161
5439
4939
5349
4959
3080
7695
4965
6179
5166
5012
5094
4855
4272
4658
5146
5346
6009


Summary of computational transaction
Raw Inputview raw input (R code)
Raw Outputview raw output of R engine
Computing time2 seconds
R Server'Sir Ronald Aylmer Fisher' @ fisher.wessa.net

\begin{tabular}{lllllllll}
\hline
Summary of computational transaction \tabularnewline
Raw Input & view raw input (R code)  \tabularnewline
Raw Output & view raw output of R engine  \tabularnewline
Computing time & 2 seconds \tabularnewline
R Server & 'Sir Ronald Aylmer Fisher' @ fisher.wessa.net \tabularnewline
\hline
\end{tabular}
%Source: https://freestatistics.org/blog/index.php?pk=242816&T=0

[TABLE]
[ROW][C]Summary of computational transaction[/C][/ROW]
[ROW][C]Raw Input[/C][C]view raw input (R code) [/C][/ROW]
[ROW][C]Raw Output[/C][C]view raw output of R engine [/C][/ROW]
[ROW][C]Computing time[/C][C]2 seconds[/C][/ROW]
[ROW][C]R Server[/C][C]'Sir Ronald Aylmer Fisher' @ fisher.wessa.net[/C][/ROW]
[/TABLE]
Source: https://freestatistics.org/blog/index.php?pk=242816&T=0

Globally Unique Identifier (entire table): ba.freestatistics.org/blog/index.php?pk=242816&T=0

As an alternative you can also use a QR Code:  

The GUIDs for individual cells are displayed in the table below:

Summary of computational transaction
Raw Inputview raw input (R code)
Raw Outputview raw output of R engine
Computing time2 seconds
R Server'Sir Ronald Aylmer Fisher' @ fisher.wessa.net


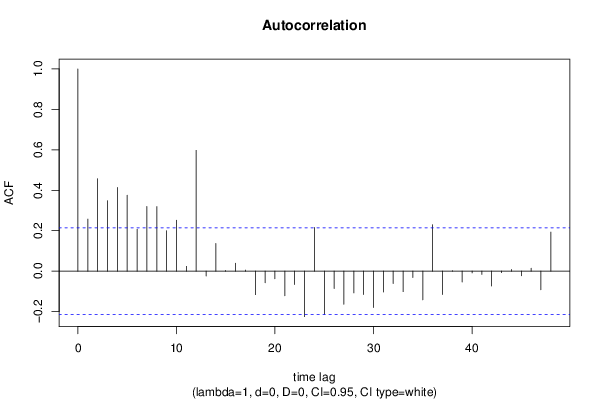
Autocorrelation Function
Time lag kACF(k)T-STATP-value
10.2570992.35630.010392
20.4570044.18853.4e-05
30.3482183.19150.000996
40.4134063.78890.000142
50.3756813.44320.000449
60.207421.9010.030363
70.3196042.92920.002187
80.319122.92480.002215
90.1996711.830.035398
100.251932.3090.0117
110.0236460.21670.414477
120.5974165.47540
13-0.023872-0.21880.413673
140.1362491.24870.107614
150.0033250.03050.487882
160.0389420.35690.361028
170.0050730.04650.481513
18-0.116212-1.06510.144942
19-0.057347-0.52560.300278
20-0.037604-0.34460.36561
21-0.121615-1.11460.134095
22-0.066429-0.60880.272139
23-0.225257-2.06450.021027
240.216091.98050.02546
25-0.213512-1.95690.026842
26-0.085933-0.78760.216577
27-0.16404-1.50340.068237
28-0.107768-0.98770.163065
29-0.11533-1.0570.146768
30-0.18038-1.65320.051011
31-0.103564-0.94920.172625
32-0.061516-0.56380.287195
33-0.1016-0.93120.177216
34-0.031645-0.290.386255
35-0.142133-1.30270.098124
360.2291512.10020.019355
37-0.116025-1.06340.145327
380.0018970.01740.493086
39-0.053644-0.49170.312122
40-0.008897-0.08150.467602
41-0.016241-0.14890.441014
42-0.073824-0.67660.250256
43-0.0076-0.06970.472316
440.0082950.0760.469788
45-0.023415-0.21460.415298
460.0143580.13160.44781
47-0.092544-0.84820.199373
480.1930821.76960.040209

\begin{tabular}{lllllllll}
\hline
Autocorrelation Function \tabularnewline
Time lag k & ACF(k) & T-STAT & P-value \tabularnewline
1 & 0.257099 & 2.3563 & 0.010392 \tabularnewline
2 & 0.457004 & 4.1885 & 3.4e-05 \tabularnewline
3 & 0.348218 & 3.1915 & 0.000996 \tabularnewline
4 & 0.413406 & 3.7889 & 0.000142 \tabularnewline
5 & 0.375681 & 3.4432 & 0.000449 \tabularnewline
6 & 0.20742 & 1.901 & 0.030363 \tabularnewline
7 & 0.319604 & 2.9292 & 0.002187 \tabularnewline
8 & 0.31912 & 2.9248 & 0.002215 \tabularnewline
9 & 0.199671 & 1.83 & 0.035398 \tabularnewline
10 & 0.25193 & 2.309 & 0.0117 \tabularnewline
11 & 0.023646 & 0.2167 & 0.414477 \tabularnewline
12 & 0.597416 & 5.4754 & 0 \tabularnewline
13 & -0.023872 & -0.2188 & 0.413673 \tabularnewline
14 & 0.136249 & 1.2487 & 0.107614 \tabularnewline
15 & 0.003325 & 0.0305 & 0.487882 \tabularnewline
16 & 0.038942 & 0.3569 & 0.361028 \tabularnewline
17 & 0.005073 & 0.0465 & 0.481513 \tabularnewline
18 & -0.116212 & -1.0651 & 0.144942 \tabularnewline
19 & -0.057347 & -0.5256 & 0.300278 \tabularnewline
20 & -0.037604 & -0.3446 & 0.36561 \tabularnewline
21 & -0.121615 & -1.1146 & 0.134095 \tabularnewline
22 & -0.066429 & -0.6088 & 0.272139 \tabularnewline
23 & -0.225257 & -2.0645 & 0.021027 \tabularnewline
24 & 0.21609 & 1.9805 & 0.02546 \tabularnewline
25 & -0.213512 & -1.9569 & 0.026842 \tabularnewline
26 & -0.085933 & -0.7876 & 0.216577 \tabularnewline
27 & -0.16404 & -1.5034 & 0.068237 \tabularnewline
28 & -0.107768 & -0.9877 & 0.163065 \tabularnewline
29 & -0.11533 & -1.057 & 0.146768 \tabularnewline
30 & -0.18038 & -1.6532 & 0.051011 \tabularnewline
31 & -0.103564 & -0.9492 & 0.172625 \tabularnewline
32 & -0.061516 & -0.5638 & 0.287195 \tabularnewline
33 & -0.1016 & -0.9312 & 0.177216 \tabularnewline
34 & -0.031645 & -0.29 & 0.386255 \tabularnewline
35 & -0.142133 & -1.3027 & 0.098124 \tabularnewline
36 & 0.229151 & 2.1002 & 0.019355 \tabularnewline
37 & -0.116025 & -1.0634 & 0.145327 \tabularnewline
38 & 0.001897 & 0.0174 & 0.493086 \tabularnewline
39 & -0.053644 & -0.4917 & 0.312122 \tabularnewline
40 & -0.008897 & -0.0815 & 0.467602 \tabularnewline
41 & -0.016241 & -0.1489 & 0.441014 \tabularnewline
42 & -0.073824 & -0.6766 & 0.250256 \tabularnewline
43 & -0.0076 & -0.0697 & 0.472316 \tabularnewline
44 & 0.008295 & 0.076 & 0.469788 \tabularnewline
45 & -0.023415 & -0.2146 & 0.415298 \tabularnewline
46 & 0.014358 & 0.1316 & 0.44781 \tabularnewline
47 & -0.092544 & -0.8482 & 0.199373 \tabularnewline
48 & 0.193082 & 1.7696 & 0.040209 \tabularnewline
\hline
\end{tabular}
%Source: https://freestatistics.org/blog/index.php?pk=242816&T=1

[TABLE]
[ROW][C]Autocorrelation Function[/C][/ROW]
[ROW][C]Time lag k[/C][C]ACF(k)[/C][C]T-STAT[/C][C]P-value[/C][/ROW]
[ROW][C]1[/C][C]0.257099[/C][C]2.3563[/C][C]0.010392[/C][/ROW]
[ROW][C]2[/C][C]0.457004[/C][C]4.1885[/C][C]3.4e-05[/C][/ROW]
[ROW][C]3[/C][C]0.348218[/C][C]3.1915[/C][C]0.000996[/C][/ROW]
[ROW][C]4[/C][C]0.413406[/C][C]3.7889[/C][C]0.000142[/C][/ROW]
[ROW][C]5[/C][C]0.375681[/C][C]3.4432[/C][C]0.000449[/C][/ROW]
[ROW][C]6[/C][C]0.20742[/C][C]1.901[/C][C]0.030363[/C][/ROW]
[ROW][C]7[/C][C]0.319604[/C][C]2.9292[/C][C]0.002187[/C][/ROW]
[ROW][C]8[/C][C]0.31912[/C][C]2.9248[/C][C]0.002215[/C][/ROW]
[ROW][C]9[/C][C]0.199671[/C][C]1.83[/C][C]0.035398[/C][/ROW]
[ROW][C]10[/C][C]0.25193[/C][C]2.309[/C][C]0.0117[/C][/ROW]
[ROW][C]11[/C][C]0.023646[/C][C]0.2167[/C][C]0.414477[/C][/ROW]
[ROW][C]12[/C][C]0.597416[/C][C]5.4754[/C][C]0[/C][/ROW]
[ROW][C]13[/C][C]-0.023872[/C][C]-0.2188[/C][C]0.413673[/C][/ROW]
[ROW][C]14[/C][C]0.136249[/C][C]1.2487[/C][C]0.107614[/C][/ROW]
[ROW][C]15[/C][C]0.003325[/C][C]0.0305[/C][C]0.487882[/C][/ROW]
[ROW][C]16[/C][C]0.038942[/C][C]0.3569[/C][C]0.361028[/C][/ROW]
[ROW][C]17[/C][C]0.005073[/C][C]0.0465[/C][C]0.481513[/C][/ROW]
[ROW][C]18[/C][C]-0.116212[/C][C]-1.0651[/C][C]0.144942[/C][/ROW]
[ROW][C]19[/C][C]-0.057347[/C][C]-0.5256[/C][C]0.300278[/C][/ROW]
[ROW][C]20[/C][C]-0.037604[/C][C]-0.3446[/C][C]0.36561[/C][/ROW]
[ROW][C]21[/C][C]-0.121615[/C][C]-1.1146[/C][C]0.134095[/C][/ROW]
[ROW][C]22[/C][C]-0.066429[/C][C]-0.6088[/C][C]0.272139[/C][/ROW]
[ROW][C]23[/C][C]-0.225257[/C][C]-2.0645[/C][C]0.021027[/C][/ROW]
[ROW][C]24[/C][C]0.21609[/C][C]1.9805[/C][C]0.02546[/C][/ROW]
[ROW][C]25[/C][C]-0.213512[/C][C]-1.9569[/C][C]0.026842[/C][/ROW]
[ROW][C]26[/C][C]-0.085933[/C][C]-0.7876[/C][C]0.216577[/C][/ROW]
[ROW][C]27[/C][C]-0.16404[/C][C]-1.5034[/C][C]0.068237[/C][/ROW]
[ROW][C]28[/C][C]-0.107768[/C][C]-0.9877[/C][C]0.163065[/C][/ROW]
[ROW][C]29[/C][C]-0.11533[/C][C]-1.057[/C][C]0.146768[/C][/ROW]
[ROW][C]30[/C][C]-0.18038[/C][C]-1.6532[/C][C]0.051011[/C][/ROW]
[ROW][C]31[/C][C]-0.103564[/C][C]-0.9492[/C][C]0.172625[/C][/ROW]
[ROW][C]32[/C][C]-0.061516[/C][C]-0.5638[/C][C]0.287195[/C][/ROW]
[ROW][C]33[/C][C]-0.1016[/C][C]-0.9312[/C][C]0.177216[/C][/ROW]
[ROW][C]34[/C][C]-0.031645[/C][C]-0.29[/C][C]0.386255[/C][/ROW]
[ROW][C]35[/C][C]-0.142133[/C][C]-1.3027[/C][C]0.098124[/C][/ROW]
[ROW][C]36[/C][C]0.229151[/C][C]2.1002[/C][C]0.019355[/C][/ROW]
[ROW][C]37[/C][C]-0.116025[/C][C]-1.0634[/C][C]0.145327[/C][/ROW]
[ROW][C]38[/C][C]0.001897[/C][C]0.0174[/C][C]0.493086[/C][/ROW]
[ROW][C]39[/C][C]-0.053644[/C][C]-0.4917[/C][C]0.312122[/C][/ROW]
[ROW][C]40[/C][C]-0.008897[/C][C]-0.0815[/C][C]0.467602[/C][/ROW]
[ROW][C]41[/C][C]-0.016241[/C][C]-0.1489[/C][C]0.441014[/C][/ROW]
[ROW][C]42[/C][C]-0.073824[/C][C]-0.6766[/C][C]0.250256[/C][/ROW]
[ROW][C]43[/C][C]-0.0076[/C][C]-0.0697[/C][C]0.472316[/C][/ROW]
[ROW][C]44[/C][C]0.008295[/C][C]0.076[/C][C]0.469788[/C][/ROW]
[ROW][C]45[/C][C]-0.023415[/C][C]-0.2146[/C][C]0.415298[/C][/ROW]
[ROW][C]46[/C][C]0.014358[/C][C]0.1316[/C][C]0.44781[/C][/ROW]
[ROW][C]47[/C][C]-0.092544[/C][C]-0.8482[/C][C]0.199373[/C][/ROW]
[ROW][C]48[/C][C]0.193082[/C][C]1.7696[/C][C]0.040209[/C][/ROW]
[/TABLE]
Source: https://freestatistics.org/blog/index.php?pk=242816&T=1

Globally Unique Identifier (entire table): ba.freestatistics.org/blog/index.php?pk=242816&T=1

As an alternative you can also use a QR Code:  

The GUIDs for individual cells are displayed in the table below:

Autocorrelation Function
Time lag kACF(k)T-STATP-value
10.2570992.35630.010392
20.4570044.18853.4e-05
30.3482183.19150.000996
40.4134063.78890.000142
50.3756813.44320.000449
60.207421.9010.030363
70.3196042.92920.002187
80.319122.92480.002215
90.1996711.830.035398
100.251932.3090.0117
110.0236460.21670.414477
120.5974165.47540
13-0.023872-0.21880.413673
140.1362491.24870.107614
150.0033250.03050.487882
160.0389420.35690.361028
170.0050730.04650.481513
18-0.116212-1.06510.144942
19-0.057347-0.52560.300278
20-0.037604-0.34460.36561
21-0.121615-1.11460.134095
22-0.066429-0.60880.272139
23-0.225257-2.06450.021027
240.216091.98050.02546
25-0.213512-1.95690.026842
26-0.085933-0.78760.216577
27-0.16404-1.50340.068237
28-0.107768-0.98770.163065
29-0.11533-1.0570.146768
30-0.18038-1.65320.051011
31-0.103564-0.94920.172625
32-0.061516-0.56380.287195
33-0.1016-0.93120.177216
34-0.031645-0.290.386255
35-0.142133-1.30270.098124
360.2291512.10020.019355
37-0.116025-1.06340.145327
380.0018970.01740.493086
39-0.053644-0.49170.312122
40-0.008897-0.08150.467602
41-0.016241-0.14890.441014
42-0.073824-0.67660.250256
43-0.0076-0.06970.472316
440.0082950.0760.469788
45-0.023415-0.21460.415298
460.0143580.13160.44781
47-0.092544-0.84820.199373
480.1930821.76960.040209


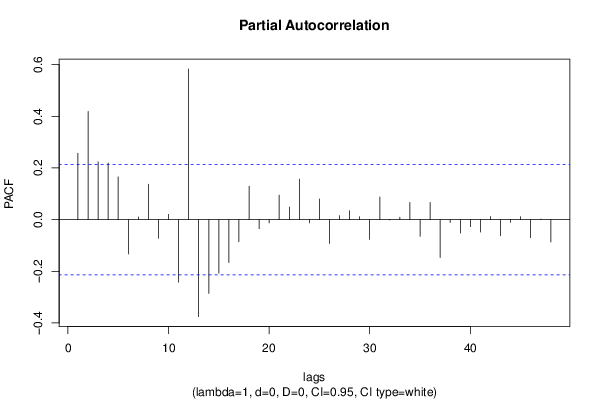
Partial Autocorrelation Function
Time lag kPACF(k)T-STATP-value
10.2570992.35630.010392
20.4185723.83630.00012
30.223672.050.021743
40.2192572.00950.023846
50.1653311.51530.066728
6-0.132664-1.21590.113717
70.0102720.09410.462608
80.1371711.25720.106084
9-0.0724-0.66360.254395
100.0202150.18530.42673
11-0.242147-2.21930.014581
120.5833295.34630
13-0.375783-3.44410.000448
14-0.285701-2.61850.005238
15-0.207333-1.90020.030416
16-0.166258-1.52380.06566
17-0.085931-0.78760.216582
180.1292531.18460.119753
19-0.034865-0.31950.375054
20-0.012612-0.11560.454127
210.0946560.86750.194059
220.0483950.44350.329257
230.1566151.43540.077444
24-0.01263-0.11580.454063
250.0800330.73350.232642
26-0.092882-0.85130.198519
270.0154310.14140.443936
280.0341140.31270.377657
290.0110780.10150.459684
30-0.07653-0.70140.242493
310.0872510.79970.21308
32-0.001667-0.01530.493924
330.0090330.08280.467109
340.0659360.60430.273633
35-0.064866-0.59450.276884
360.0661140.60590.273092
37-0.146724-1.34470.091163
38-0.011331-0.10390.458766
39-0.052099-0.47750.317126
40-0.027245-0.24970.401713
41-0.048065-0.44050.330345
420.0118710.10880.456809
43-0.062323-0.57120.284696
44-0.010879-0.09970.460407
450.0113150.10370.458825
46-0.069974-0.64130.26153
470.0020210.01850.492634
48-0.086933-0.79680.21392

\begin{tabular}{lllllllll}
\hline
Partial Autocorrelation Function \tabularnewline
Time lag k & PACF(k) & T-STAT & P-value \tabularnewline
1 & 0.257099 & 2.3563 & 0.010392 \tabularnewline
2 & 0.418572 & 3.8363 & 0.00012 \tabularnewline
3 & 0.22367 & 2.05 & 0.021743 \tabularnewline
4 & 0.219257 & 2.0095 & 0.023846 \tabularnewline
5 & 0.165331 & 1.5153 & 0.066728 \tabularnewline
6 & -0.132664 & -1.2159 & 0.113717 \tabularnewline
7 & 0.010272 & 0.0941 & 0.462608 \tabularnewline
8 & 0.137171 & 1.2572 & 0.106084 \tabularnewline
9 & -0.0724 & -0.6636 & 0.254395 \tabularnewline
10 & 0.020215 & 0.1853 & 0.42673 \tabularnewline
11 & -0.242147 & -2.2193 & 0.014581 \tabularnewline
12 & 0.583329 & 5.3463 & 0 \tabularnewline
13 & -0.375783 & -3.4441 & 0.000448 \tabularnewline
14 & -0.285701 & -2.6185 & 0.005238 \tabularnewline
15 & -0.207333 & -1.9002 & 0.030416 \tabularnewline
16 & -0.166258 & -1.5238 & 0.06566 \tabularnewline
17 & -0.085931 & -0.7876 & 0.216582 \tabularnewline
18 & 0.129253 & 1.1846 & 0.119753 \tabularnewline
19 & -0.034865 & -0.3195 & 0.375054 \tabularnewline
20 & -0.012612 & -0.1156 & 0.454127 \tabularnewline
21 & 0.094656 & 0.8675 & 0.194059 \tabularnewline
22 & 0.048395 & 0.4435 & 0.329257 \tabularnewline
23 & 0.156615 & 1.4354 & 0.077444 \tabularnewline
24 & -0.01263 & -0.1158 & 0.454063 \tabularnewline
25 & 0.080033 & 0.7335 & 0.232642 \tabularnewline
26 & -0.092882 & -0.8513 & 0.198519 \tabularnewline
27 & 0.015431 & 0.1414 & 0.443936 \tabularnewline
28 & 0.034114 & 0.3127 & 0.377657 \tabularnewline
29 & 0.011078 & 0.1015 & 0.459684 \tabularnewline
30 & -0.07653 & -0.7014 & 0.242493 \tabularnewline
31 & 0.087251 & 0.7997 & 0.21308 \tabularnewline
32 & -0.001667 & -0.0153 & 0.493924 \tabularnewline
33 & 0.009033 & 0.0828 & 0.467109 \tabularnewline
34 & 0.065936 & 0.6043 & 0.273633 \tabularnewline
35 & -0.064866 & -0.5945 & 0.276884 \tabularnewline
36 & 0.066114 & 0.6059 & 0.273092 \tabularnewline
37 & -0.146724 & -1.3447 & 0.091163 \tabularnewline
38 & -0.011331 & -0.1039 & 0.458766 \tabularnewline
39 & -0.052099 & -0.4775 & 0.317126 \tabularnewline
40 & -0.027245 & -0.2497 & 0.401713 \tabularnewline
41 & -0.048065 & -0.4405 & 0.330345 \tabularnewline
42 & 0.011871 & 0.1088 & 0.456809 \tabularnewline
43 & -0.062323 & -0.5712 & 0.284696 \tabularnewline
44 & -0.010879 & -0.0997 & 0.460407 \tabularnewline
45 & 0.011315 & 0.1037 & 0.458825 \tabularnewline
46 & -0.069974 & -0.6413 & 0.26153 \tabularnewline
47 & 0.002021 & 0.0185 & 0.492634 \tabularnewline
48 & -0.086933 & -0.7968 & 0.21392 \tabularnewline
\hline
\end{tabular}
%Source: https://freestatistics.org/blog/index.php?pk=242816&T=2

[TABLE]
[ROW][C]Partial Autocorrelation Function[/C][/ROW]
[ROW][C]Time lag k[/C][C]PACF(k)[/C][C]T-STAT[/C][C]P-value[/C][/ROW]
[ROW][C]1[/C][C]0.257099[/C][C]2.3563[/C][C]0.010392[/C][/ROW]
[ROW][C]2[/C][C]0.418572[/C][C]3.8363[/C][C]0.00012[/C][/ROW]
[ROW][C]3[/C][C]0.22367[/C][C]2.05[/C][C]0.021743[/C][/ROW]
[ROW][C]4[/C][C]0.219257[/C][C]2.0095[/C][C]0.023846[/C][/ROW]
[ROW][C]5[/C][C]0.165331[/C][C]1.5153[/C][C]0.066728[/C][/ROW]
[ROW][C]6[/C][C]-0.132664[/C][C]-1.2159[/C][C]0.113717[/C][/ROW]
[ROW][C]7[/C][C]0.010272[/C][C]0.0941[/C][C]0.462608[/C][/ROW]
[ROW][C]8[/C][C]0.137171[/C][C]1.2572[/C][C]0.106084[/C][/ROW]
[ROW][C]9[/C][C]-0.0724[/C][C]-0.6636[/C][C]0.254395[/C][/ROW]
[ROW][C]10[/C][C]0.020215[/C][C]0.1853[/C][C]0.42673[/C][/ROW]
[ROW][C]11[/C][C]-0.242147[/C][C]-2.2193[/C][C]0.014581[/C][/ROW]
[ROW][C]12[/C][C]0.583329[/C][C]5.3463[/C][C]0[/C][/ROW]
[ROW][C]13[/C][C]-0.375783[/C][C]-3.4441[/C][C]0.000448[/C][/ROW]
[ROW][C]14[/C][C]-0.285701[/C][C]-2.6185[/C][C]0.005238[/C][/ROW]
[ROW][C]15[/C][C]-0.207333[/C][C]-1.9002[/C][C]0.030416[/C][/ROW]
[ROW][C]16[/C][C]-0.166258[/C][C]-1.5238[/C][C]0.06566[/C][/ROW]
[ROW][C]17[/C][C]-0.085931[/C][C]-0.7876[/C][C]0.216582[/C][/ROW]
[ROW][C]18[/C][C]0.129253[/C][C]1.1846[/C][C]0.119753[/C][/ROW]
[ROW][C]19[/C][C]-0.034865[/C][C]-0.3195[/C][C]0.375054[/C][/ROW]
[ROW][C]20[/C][C]-0.012612[/C][C]-0.1156[/C][C]0.454127[/C][/ROW]
[ROW][C]21[/C][C]0.094656[/C][C]0.8675[/C][C]0.194059[/C][/ROW]
[ROW][C]22[/C][C]0.048395[/C][C]0.4435[/C][C]0.329257[/C][/ROW]
[ROW][C]23[/C][C]0.156615[/C][C]1.4354[/C][C]0.077444[/C][/ROW]
[ROW][C]24[/C][C]-0.01263[/C][C]-0.1158[/C][C]0.454063[/C][/ROW]
[ROW][C]25[/C][C]0.080033[/C][C]0.7335[/C][C]0.232642[/C][/ROW]
[ROW][C]26[/C][C]-0.092882[/C][C]-0.8513[/C][C]0.198519[/C][/ROW]
[ROW][C]27[/C][C]0.015431[/C][C]0.1414[/C][C]0.443936[/C][/ROW]
[ROW][C]28[/C][C]0.034114[/C][C]0.3127[/C][C]0.377657[/C][/ROW]
[ROW][C]29[/C][C]0.011078[/C][C]0.1015[/C][C]0.459684[/C][/ROW]
[ROW][C]30[/C][C]-0.07653[/C][C]-0.7014[/C][C]0.242493[/C][/ROW]
[ROW][C]31[/C][C]0.087251[/C][C]0.7997[/C][C]0.21308[/C][/ROW]
[ROW][C]32[/C][C]-0.001667[/C][C]-0.0153[/C][C]0.493924[/C][/ROW]
[ROW][C]33[/C][C]0.009033[/C][C]0.0828[/C][C]0.467109[/C][/ROW]
[ROW][C]34[/C][C]0.065936[/C][C]0.6043[/C][C]0.273633[/C][/ROW]
[ROW][C]35[/C][C]-0.064866[/C][C]-0.5945[/C][C]0.276884[/C][/ROW]
[ROW][C]36[/C][C]0.066114[/C][C]0.6059[/C][C]0.273092[/C][/ROW]
[ROW][C]37[/C][C]-0.146724[/C][C]-1.3447[/C][C]0.091163[/C][/ROW]
[ROW][C]38[/C][C]-0.011331[/C][C]-0.1039[/C][C]0.458766[/C][/ROW]
[ROW][C]39[/C][C]-0.052099[/C][C]-0.4775[/C][C]0.317126[/C][/ROW]
[ROW][C]40[/C][C]-0.027245[/C][C]-0.2497[/C][C]0.401713[/C][/ROW]
[ROW][C]41[/C][C]-0.048065[/C][C]-0.4405[/C][C]0.330345[/C][/ROW]
[ROW][C]42[/C][C]0.011871[/C][C]0.1088[/C][C]0.456809[/C][/ROW]
[ROW][C]43[/C][C]-0.062323[/C][C]-0.5712[/C][C]0.284696[/C][/ROW]
[ROW][C]44[/C][C]-0.010879[/C][C]-0.0997[/C][C]0.460407[/C][/ROW]
[ROW][C]45[/C][C]0.011315[/C][C]0.1037[/C][C]0.458825[/C][/ROW]
[ROW][C]46[/C][C]-0.069974[/C][C]-0.6413[/C][C]0.26153[/C][/ROW]
[ROW][C]47[/C][C]0.002021[/C][C]0.0185[/C][C]0.492634[/C][/ROW]
[ROW][C]48[/C][C]-0.086933[/C][C]-0.7968[/C][C]0.21392[/C][/ROW]
[/TABLE]
Source: https://freestatistics.org/blog/index.php?pk=242816&T=2

Globally Unique Identifier (entire table): ba.freestatistics.org/blog/index.php?pk=242816&T=2

As an alternative you can also use a QR Code:  

The GUIDs for individual cells are displayed in the table below:

Partial Autocorrelation Function
Time lag kPACF(k)T-STATP-value
10.2570992.35630.010392
20.4185723.83630.00012
30.223672.050.021743
40.2192572.00950.023846
50.1653311.51530.066728
6-0.132664-1.21590.113717
70.0102720.09410.462608
80.1371711.25720.106084
9-0.0724-0.66360.254395
100.0202150.18530.42673
11-0.242147-2.21930.014581
120.5833295.34630
13-0.375783-3.44410.000448
14-0.285701-2.61850.005238
15-0.207333-1.90020.030416
16-0.166258-1.52380.06566
17-0.085931-0.78760.216582
180.1292531.18460.119753
19-0.034865-0.31950.375054
20-0.012612-0.11560.454127
210.0946560.86750.194059
220.0483950.44350.329257
230.1566151.43540.077444
24-0.01263-0.11580.454063
250.0800330.73350.232642
26-0.092882-0.85130.198519
270.0154310.14140.443936
280.0341140.31270.377657
290.0110780.10150.459684
30-0.07653-0.70140.242493
310.0872510.79970.21308
32-0.001667-0.01530.493924
330.0090330.08280.467109
340.0659360.60430.273633
35-0.064866-0.59450.276884
360.0661140.60590.273092
37-0.146724-1.34470.091163
38-0.011331-0.10390.458766
39-0.052099-0.47750.317126
40-0.027245-0.24970.401713
41-0.048065-0.44050.330345
420.0118710.10880.456809
43-0.062323-0.57120.284696
44-0.010879-0.09970.460407
450.0113150.10370.458825
46-0.069974-0.64130.26153
470.0020210.01850.492634
48-0.086933-0.79680.21392


Parameters (Session):
par1 = 48 ; par2 = 1 ; par3 = 0 ; par4 = 0 ; par5 = 12 ; par6 = White Noise ; par7 = 0.95 ;
Parameters (R input):
par1 = 48 ; par2 = 1 ; par3 = 0 ; par4 = 0 ; par5 = 12 ; par6 = White Noise ; par7 = 0.95 ; par8 = ;
R code (references can be found in the software module):
if (par1 == 'Default') {
par1 = 10*log10(length(x))
} else {
par1 <- as.numeric(par1)
}
par2 <- as.numeric(par2)
par3 <- as.numeric(par3)
par4 <- as.numeric(par4)
par5 <- as.numeric(par5)
if (par6 == 'White Noise') par6 <- 'white' else par6 <- 'ma'
par7 <- as.numeric(par7)
if (par8 != '') par8 <- as.numeric(par8)
ox <- x
if (par8 == '') {
if (par2 == 0) {
x <- log(x)
} else {
x <- (x ^ par2 - 1) / par2
}
} else {
x <- log(x,base=par8)
}
if (par3 > 0) x <- diff(x,lag=1,difference=par3)
if (par4 > 0) x <- diff(x,lag=par5,difference=par4)
bitmap(file='picts.png')
op <- par(mfrow=c(2,1))
plot(ox,type='l',main='Original Time Series',xlab='time',ylab='value')
if (par8=='') {
mytitle <- paste('Working Time Series (lambda=',par2,', d=',par3,', D=',par4,')',sep='')
mysub <- paste('(lambda=',par2,', d=',par3,', D=',par4,', CI=', par7, ', CI type=',par6,')',sep='')
} else {
mytitle <- paste('Working Time Series (base=',par8,', d=',par3,', D=',par4,')',sep='')
mysub <- paste('(base=',par8,', d=',par3,', D=',par4,', CI=', par7, ', CI type=',par6,')',sep='')
}
plot(x,type='l', main=mytitle,xlab='time',ylab='value')
par(op)
dev.off()
bitmap(file='pic1.png')
racf <- acf(x, par1, main='Autocorrelation', xlab='time lag', ylab='ACF', ci.type=par6, ci=par7, sub=mysub)
dev.off()
bitmap(file='pic2.png')
rpacf <- pacf(x,par1,main='Partial Autocorrelation',xlab='lags',ylab='PACF',sub=mysub)
dev.off()
(myacf <- c(racf$acf))
(mypacf <- c(rpacf$acf))
lengthx <- length(x)
sqrtn <- sqrt(lengthx)
load(file='createtable')
a<-table.start()
a<-table.row.start(a)
a<-table.element(a,'Autocorrelation Function',4,TRUE)
a<-table.row.end(a)
a<-table.row.start(a)
a<-table.element(a,'Time lag k',header=TRUE)
a<-table.element(a,hyperlink('basics.htm','ACF(k)','click here for more information about the Autocorrelation Function'),header=TRUE)
a<-table.element(a,'T-STAT',header=TRUE)
a<-table.element(a,'P-value',header=TRUE)
a<-table.row.end(a)
for (i in 2:(par1+1)) {
a<-table.row.start(a)
a<-table.element(a,i-1,header=TRUE)
a<-table.element(a,round(myacf[i],6))
mytstat <- myacf[i]*sqrtn
a<-table.element(a,round(mytstat,4))
a<-table.element(a,round(1-pt(abs(mytstat),lengthx),6))
a<-table.row.end(a)
}
a<-table.end(a)
table.save(a,file='mytable.tab')
a<-table.start()
a<-table.row.start(a)
a<-table.element(a,'Partial Autocorrelation Function',4,TRUE)
a<-table.row.end(a)
a<-table.row.start(a)
a<-table.element(a,'Time lag k',header=TRUE)
a<-table.element(a,hyperlink('basics.htm','PACF(k)','click here for more information about the Partial Autocorrelation Function'),header=TRUE)
a<-table.element(a,'T-STAT',header=TRUE)
a<-table.element(a,'P-value',header=TRUE)
a<-table.row.end(a)
for (i in 1:par1) {
a<-table.row.start(a)
a<-table.element(a,i,header=TRUE)
a<-table.element(a,round(mypacf[i],6))
mytstat <- mypacf[i]*sqrtn
a<-table.element(a,round(mytstat,4))
a<-table.element(a,round(1-pt(abs(mytstat),lengthx),6))
a<-table.row.end(a)
}
a<-table.end(a)
table.save(a,file='mytable1.tab')