Free Statistics

of Irreproducible Research!

Author's title

Author*Unverified author*
R Software Modulerwasp_autocorrelation.wasp
Title produced by software(Partial) Autocorrelation Function
Date of computationThu, 16 Oct 2014 17:34:25 +0100
Cite this page as followsStatistical Computations at FreeStatistics.org, Office for Research Development and Education, URL https://freestatistics.org/blog/index.php?v=date/2014/Oct/16/t1413477288nq9fsjj5o3u3qz3.htm/, Retrieved Sun, 12 May 2024 20:53:24 +0000
Statistical Computations at FreeStatistics.org, Office for Research Development and Education, URL https://freestatistics.org/blog/index.php?pk=242742, Retrieved Sun, 12 May 2024 20:53:24 +0000
QR Codes:

Original text written by user:
IsPrivate?No (this computation is public)
User-defined keywords
Estimated Impact45
Family? (F = Feedback message, R = changed R code, M = changed R Module, P = changed Parameters, D = changed Data)
-       [(Partial) Autocorrelation Function] [] [2014-10-16 16:34:25] [d41d8cd98f00b204e9800998ecf8427e] [Current]
Feedback Forum

Post a new message
Dataseries X:
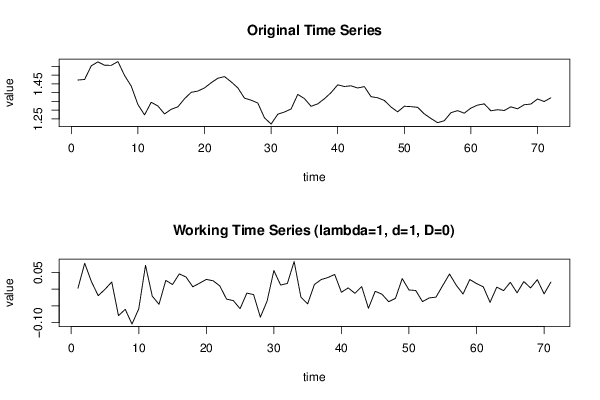
1.4718
1.4748
1.5527
1.5751
1.5557
1.5553
1.577
1.4975
1.437
1.3322
1.2732
1.3449
1.3239
1.2785
1.305
1.319
1.365
1.4016
1.4088
1.4268
1.4562
1.4816
1.4914
1.4614
1.4272
1.3686
1.3569
1.3406
1.2565
1.2209
1.277
1.2894
1.3067
1.3898
1.3661
1.322
1.336
1.3649
1.3999
1.4442
1.4349
1.4388
1.4264
1.4343
1.377
1.3706
1.3556
1.3179
1.2905
1.3224
1.3201
1.3162
1.2789
1.2526
1.2288
1.24
1.2856
1.2974
1.2828
1.3119
1.3288
1.3359
1.2964
1.3026
1.2982
1.3189
1.308
1.331
1.3348
1.3635
1.3493
1.3704


Summary of computational transaction
Raw Inputview raw input (R code)
Raw Outputview raw output of R engine
Computing time1 seconds
R Server'Sir Ronald Aylmer Fisher' @ fisher.wessa.net

\begin{tabular}{lllllllll}
\hline
Summary of computational transaction \tabularnewline
Raw Input & view raw input (R code)  \tabularnewline
Raw Output & view raw output of R engine  \tabularnewline
Computing time & 1 seconds \tabularnewline
R Server & 'Sir Ronald Aylmer Fisher' @ fisher.wessa.net \tabularnewline
\hline
\end{tabular}
%Source: https://freestatistics.org/blog/index.php?pk=242742&T=0

[TABLE]
[ROW][C]Summary of computational transaction[/C][/ROW]
[ROW][C]Raw Input[/C][C]view raw input (R code) [/C][/ROW]
[ROW][C]Raw Output[/C][C]view raw output of R engine [/C][/ROW]
[ROW][C]Computing time[/C][C]1 seconds[/C][/ROW]
[ROW][C]R Server[/C][C]'Sir Ronald Aylmer Fisher' @ fisher.wessa.net[/C][/ROW]
[/TABLE]
Source: https://freestatistics.org/blog/index.php?pk=242742&T=0

Globally Unique Identifier (entire table): ba.freestatistics.org/blog/index.php?pk=242742&T=0

As an alternative you can also use a QR Code:  

The GUIDs for individual cells are displayed in the table below:

Summary of computational transaction
Raw Inputview raw input (R code)
Raw Outputview raw output of R engine
Computing time1 seconds
R Server'Sir Ronald Aylmer Fisher' @ fisher.wessa.net


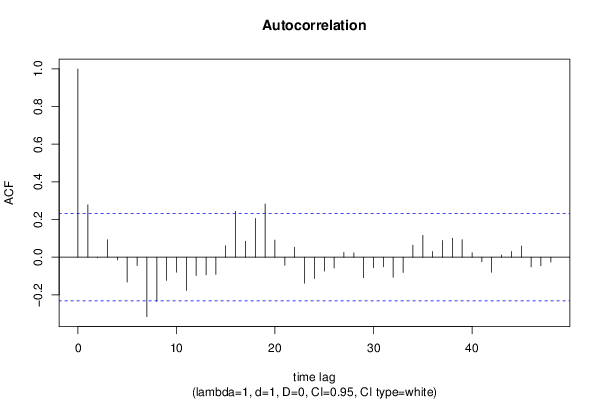
Autocorrelation Function
Time lag kACF(k)T-STATP-value
10.2778482.34120.011017
2-0.003386-0.02850.488659
30.0923110.77780.219628
4-0.014349-0.12090.452052
5-0.132365-1.11530.134235
6-0.044388-0.3740.354752
7-0.316115-2.66360.004779
8-0.233549-1.96790.026492
9-0.123371-1.03950.151041
10-0.079581-0.67060.252337
11-0.177121-1.49240.070006
12-0.097674-0.8230.206628
13-0.093684-0.78940.216256
14-0.091408-0.77020.221862
150.0607690.5120.305103
160.2434572.05140.021959
170.0847610.71420.23872
180.2049981.72730.044227
190.2821812.37770.010059
200.0905920.76330.223895
21-0.043166-0.36370.358573
220.0528690.44550.328665
23-0.138173-1.16430.124107
24-0.113859-0.95940.170308
25-0.074096-0.62430.267202
26-0.057525-0.48470.314687
270.024880.20960.417272
280.0229580.19350.423579
29-0.108956-0.91810.180842
30-0.056528-0.47630.317657
31-0.051068-0.43030.334138
32-0.10705-0.9020.185048
33-0.081645-0.6880.246862
340.0629980.53080.298596
350.1158850.97650.166075
360.0298590.25160.40104
370.0886320.74680.228818
380.1005230.8470.199916
390.0922980.77770.219659
400.0238250.20080.420733
41-0.024246-0.20430.419353
42-0.080445-0.67780.250036
430.0113040.09520.462193
440.029810.25120.401199
450.0586950.49460.311215
46-0.051526-0.43420.332742
47-0.045175-0.38070.352299
48-0.02555-0.21530.41508

\begin{tabular}{lllllllll}
\hline
Autocorrelation Function \tabularnewline
Time lag k & ACF(k) & T-STAT & P-value \tabularnewline
1 & 0.277848 & 2.3412 & 0.011017 \tabularnewline
2 & -0.003386 & -0.0285 & 0.488659 \tabularnewline
3 & 0.092311 & 0.7778 & 0.219628 \tabularnewline
4 & -0.014349 & -0.1209 & 0.452052 \tabularnewline
5 & -0.132365 & -1.1153 & 0.134235 \tabularnewline
6 & -0.044388 & -0.374 & 0.354752 \tabularnewline
7 & -0.316115 & -2.6636 & 0.004779 \tabularnewline
8 & -0.233549 & -1.9679 & 0.026492 \tabularnewline
9 & -0.123371 & -1.0395 & 0.151041 \tabularnewline
10 & -0.079581 & -0.6706 & 0.252337 \tabularnewline
11 & -0.177121 & -1.4924 & 0.070006 \tabularnewline
12 & -0.097674 & -0.823 & 0.206628 \tabularnewline
13 & -0.093684 & -0.7894 & 0.216256 \tabularnewline
14 & -0.091408 & -0.7702 & 0.221862 \tabularnewline
15 & 0.060769 & 0.512 & 0.305103 \tabularnewline
16 & 0.243457 & 2.0514 & 0.021959 \tabularnewline
17 & 0.084761 & 0.7142 & 0.23872 \tabularnewline
18 & 0.204998 & 1.7273 & 0.044227 \tabularnewline
19 & 0.282181 & 2.3777 & 0.010059 \tabularnewline
20 & 0.090592 & 0.7633 & 0.223895 \tabularnewline
21 & -0.043166 & -0.3637 & 0.358573 \tabularnewline
22 & 0.052869 & 0.4455 & 0.328665 \tabularnewline
23 & -0.138173 & -1.1643 & 0.124107 \tabularnewline
24 & -0.113859 & -0.9594 & 0.170308 \tabularnewline
25 & -0.074096 & -0.6243 & 0.267202 \tabularnewline
26 & -0.057525 & -0.4847 & 0.314687 \tabularnewline
27 & 0.02488 & 0.2096 & 0.417272 \tabularnewline
28 & 0.022958 & 0.1935 & 0.423579 \tabularnewline
29 & -0.108956 & -0.9181 & 0.180842 \tabularnewline
30 & -0.056528 & -0.4763 & 0.317657 \tabularnewline
31 & -0.051068 & -0.4303 & 0.334138 \tabularnewline
32 & -0.10705 & -0.902 & 0.185048 \tabularnewline
33 & -0.081645 & -0.688 & 0.246862 \tabularnewline
34 & 0.062998 & 0.5308 & 0.298596 \tabularnewline
35 & 0.115885 & 0.9765 & 0.166075 \tabularnewline
36 & 0.029859 & 0.2516 & 0.40104 \tabularnewline
37 & 0.088632 & 0.7468 & 0.228818 \tabularnewline
38 & 0.100523 & 0.847 & 0.199916 \tabularnewline
39 & 0.092298 & 0.7777 & 0.219659 \tabularnewline
40 & 0.023825 & 0.2008 & 0.420733 \tabularnewline
41 & -0.024246 & -0.2043 & 0.419353 \tabularnewline
42 & -0.080445 & -0.6778 & 0.250036 \tabularnewline
43 & 0.011304 & 0.0952 & 0.462193 \tabularnewline
44 & 0.02981 & 0.2512 & 0.401199 \tabularnewline
45 & 0.058695 & 0.4946 & 0.311215 \tabularnewline
46 & -0.051526 & -0.4342 & 0.332742 \tabularnewline
47 & -0.045175 & -0.3807 & 0.352299 \tabularnewline
48 & -0.02555 & -0.2153 & 0.41508 \tabularnewline
\hline
\end{tabular}
%Source: https://freestatistics.org/blog/index.php?pk=242742&T=1

[TABLE]
[ROW][C]Autocorrelation Function[/C][/ROW]
[ROW][C]Time lag k[/C][C]ACF(k)[/C][C]T-STAT[/C][C]P-value[/C][/ROW]
[ROW][C]1[/C][C]0.277848[/C][C]2.3412[/C][C]0.011017[/C][/ROW]
[ROW][C]2[/C][C]-0.003386[/C][C]-0.0285[/C][C]0.488659[/C][/ROW]
[ROW][C]3[/C][C]0.092311[/C][C]0.7778[/C][C]0.219628[/C][/ROW]
[ROW][C]4[/C][C]-0.014349[/C][C]-0.1209[/C][C]0.452052[/C][/ROW]
[ROW][C]5[/C][C]-0.132365[/C][C]-1.1153[/C][C]0.134235[/C][/ROW]
[ROW][C]6[/C][C]-0.044388[/C][C]-0.374[/C][C]0.354752[/C][/ROW]
[ROW][C]7[/C][C]-0.316115[/C][C]-2.6636[/C][C]0.004779[/C][/ROW]
[ROW][C]8[/C][C]-0.233549[/C][C]-1.9679[/C][C]0.026492[/C][/ROW]
[ROW][C]9[/C][C]-0.123371[/C][C]-1.0395[/C][C]0.151041[/C][/ROW]
[ROW][C]10[/C][C]-0.079581[/C][C]-0.6706[/C][C]0.252337[/C][/ROW]
[ROW][C]11[/C][C]-0.177121[/C][C]-1.4924[/C][C]0.070006[/C][/ROW]
[ROW][C]12[/C][C]-0.097674[/C][C]-0.823[/C][C]0.206628[/C][/ROW]
[ROW][C]13[/C][C]-0.093684[/C][C]-0.7894[/C][C]0.216256[/C][/ROW]
[ROW][C]14[/C][C]-0.091408[/C][C]-0.7702[/C][C]0.221862[/C][/ROW]
[ROW][C]15[/C][C]0.060769[/C][C]0.512[/C][C]0.305103[/C][/ROW]
[ROW][C]16[/C][C]0.243457[/C][C]2.0514[/C][C]0.021959[/C][/ROW]
[ROW][C]17[/C][C]0.084761[/C][C]0.7142[/C][C]0.23872[/C][/ROW]
[ROW][C]18[/C][C]0.204998[/C][C]1.7273[/C][C]0.044227[/C][/ROW]
[ROW][C]19[/C][C]0.282181[/C][C]2.3777[/C][C]0.010059[/C][/ROW]
[ROW][C]20[/C][C]0.090592[/C][C]0.7633[/C][C]0.223895[/C][/ROW]
[ROW][C]21[/C][C]-0.043166[/C][C]-0.3637[/C][C]0.358573[/C][/ROW]
[ROW][C]22[/C][C]0.052869[/C][C]0.4455[/C][C]0.328665[/C][/ROW]
[ROW][C]23[/C][C]-0.138173[/C][C]-1.1643[/C][C]0.124107[/C][/ROW]
[ROW][C]24[/C][C]-0.113859[/C][C]-0.9594[/C][C]0.170308[/C][/ROW]
[ROW][C]25[/C][C]-0.074096[/C][C]-0.6243[/C][C]0.267202[/C][/ROW]
[ROW][C]26[/C][C]-0.057525[/C][C]-0.4847[/C][C]0.314687[/C][/ROW]
[ROW][C]27[/C][C]0.02488[/C][C]0.2096[/C][C]0.417272[/C][/ROW]
[ROW][C]28[/C][C]0.022958[/C][C]0.1935[/C][C]0.423579[/C][/ROW]
[ROW][C]29[/C][C]-0.108956[/C][C]-0.9181[/C][C]0.180842[/C][/ROW]
[ROW][C]30[/C][C]-0.056528[/C][C]-0.4763[/C][C]0.317657[/C][/ROW]
[ROW][C]31[/C][C]-0.051068[/C][C]-0.4303[/C][C]0.334138[/C][/ROW]
[ROW][C]32[/C][C]-0.10705[/C][C]-0.902[/C][C]0.185048[/C][/ROW]
[ROW][C]33[/C][C]-0.081645[/C][C]-0.688[/C][C]0.246862[/C][/ROW]
[ROW][C]34[/C][C]0.062998[/C][C]0.5308[/C][C]0.298596[/C][/ROW]
[ROW][C]35[/C][C]0.115885[/C][C]0.9765[/C][C]0.166075[/C][/ROW]
[ROW][C]36[/C][C]0.029859[/C][C]0.2516[/C][C]0.40104[/C][/ROW]
[ROW][C]37[/C][C]0.088632[/C][C]0.7468[/C][C]0.228818[/C][/ROW]
[ROW][C]38[/C][C]0.100523[/C][C]0.847[/C][C]0.199916[/C][/ROW]
[ROW][C]39[/C][C]0.092298[/C][C]0.7777[/C][C]0.219659[/C][/ROW]
[ROW][C]40[/C][C]0.023825[/C][C]0.2008[/C][C]0.420733[/C][/ROW]
[ROW][C]41[/C][C]-0.024246[/C][C]-0.2043[/C][C]0.419353[/C][/ROW]
[ROW][C]42[/C][C]-0.080445[/C][C]-0.6778[/C][C]0.250036[/C][/ROW]
[ROW][C]43[/C][C]0.011304[/C][C]0.0952[/C][C]0.462193[/C][/ROW]
[ROW][C]44[/C][C]0.02981[/C][C]0.2512[/C][C]0.401199[/C][/ROW]
[ROW][C]45[/C][C]0.058695[/C][C]0.4946[/C][C]0.311215[/C][/ROW]
[ROW][C]46[/C][C]-0.051526[/C][C]-0.4342[/C][C]0.332742[/C][/ROW]
[ROW][C]47[/C][C]-0.045175[/C][C]-0.3807[/C][C]0.352299[/C][/ROW]
[ROW][C]48[/C][C]-0.02555[/C][C]-0.2153[/C][C]0.41508[/C][/ROW]
[/TABLE]
Source: https://freestatistics.org/blog/index.php?pk=242742&T=1

Globally Unique Identifier (entire table): ba.freestatistics.org/blog/index.php?pk=242742&T=1

As an alternative you can also use a QR Code:  

The GUIDs for individual cells are displayed in the table below:

Autocorrelation Function
Time lag kACF(k)T-STATP-value
10.2778482.34120.011017
2-0.003386-0.02850.488659
30.0923110.77780.219628
4-0.014349-0.12090.452052
5-0.132365-1.11530.134235
6-0.044388-0.3740.354752
7-0.316115-2.66360.004779
8-0.233549-1.96790.026492
9-0.123371-1.03950.151041
10-0.079581-0.67060.252337
11-0.177121-1.49240.070006
12-0.097674-0.8230.206628
13-0.093684-0.78940.216256
14-0.091408-0.77020.221862
150.0607690.5120.305103
160.2434572.05140.021959
170.0847610.71420.23872
180.2049981.72730.044227
190.2821812.37770.010059
200.0905920.76330.223895
21-0.043166-0.36370.358573
220.0528690.44550.328665
23-0.138173-1.16430.124107
24-0.113859-0.95940.170308
25-0.074096-0.62430.267202
26-0.057525-0.48470.314687
270.024880.20960.417272
280.0229580.19350.423579
29-0.108956-0.91810.180842
30-0.056528-0.47630.317657
31-0.051068-0.43030.334138
32-0.10705-0.9020.185048
33-0.081645-0.6880.246862
340.0629980.53080.298596
350.1158850.97650.166075
360.0298590.25160.40104
370.0886320.74680.228818
380.1005230.8470.199916
390.0922980.77770.219659
400.0238250.20080.420733
41-0.024246-0.20430.419353
42-0.080445-0.67780.250036
430.0113040.09520.462193
440.029810.25120.401199
450.0586950.49460.311215
46-0.051526-0.43420.332742
47-0.045175-0.38070.352299
48-0.02555-0.21530.41508


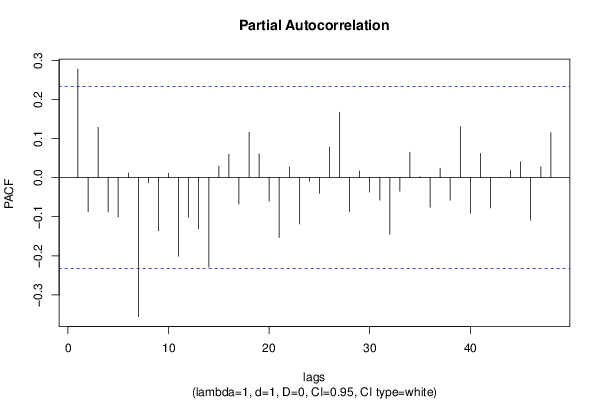
Partial Autocorrelation Function
Time lag kPACF(k)T-STATP-value
10.2778482.34120.011017
2-0.087327-0.73580.232128
30.1284151.0820.141447
4-0.088135-0.74260.230076
5-0.100733-0.84880.199425
60.0116870.09850.460915
7-0.355741-2.99750.001874
8-0.013183-0.11110.455932
9-0.136017-1.14610.127801
100.0110830.09340.46293
11-0.201095-1.69450.047281
12-0.101517-0.85540.197605
13-0.130793-1.10210.137074
14-0.228728-1.92730.028972
150.0290790.2450.403572
160.0597310.50330.308155
17-0.06758-0.56940.285427
180.1156170.97420.166631
190.0609750.51380.304498
20-0.05996-0.50520.307482
21-0.153233-1.29120.100418
220.0269430.2270.410529
23-0.118708-1.00030.160293
24-0.009116-0.07680.469494
25-0.040529-0.34150.366867
260.078290.65970.255796
270.1673281.40990.081463
28-0.087502-0.73730.231682
290.0170810.14390.442983
30-0.037167-0.31320.377532
31-0.057738-0.48650.314052
32-0.144613-1.21850.113527
33-0.035001-0.29490.384457
340.0647120.54530.293636
350.0019720.01660.493396
36-0.076082-0.64110.261768
370.0239030.20140.420476
38-0.058193-0.49030.312701
390.1306961.10130.137251
40-0.091323-0.76950.222074
410.0616920.51980.3024
42-0.077542-0.65340.257812
430.0009950.00840.496667
440.0185050.15590.438268
450.0403850.34030.367322
46-0.108932-0.91790.180894
470.0274380.23120.408914
480.1150670.96960.167776

\begin{tabular}{lllllllll}
\hline
Partial Autocorrelation Function \tabularnewline
Time lag k & PACF(k) & T-STAT & P-value \tabularnewline
1 & 0.277848 & 2.3412 & 0.011017 \tabularnewline
2 & -0.087327 & -0.7358 & 0.232128 \tabularnewline
3 & 0.128415 & 1.082 & 0.141447 \tabularnewline
4 & -0.088135 & -0.7426 & 0.230076 \tabularnewline
5 & -0.100733 & -0.8488 & 0.199425 \tabularnewline
6 & 0.011687 & 0.0985 & 0.460915 \tabularnewline
7 & -0.355741 & -2.9975 & 0.001874 \tabularnewline
8 & -0.013183 & -0.1111 & 0.455932 \tabularnewline
9 & -0.136017 & -1.1461 & 0.127801 \tabularnewline
10 & 0.011083 & 0.0934 & 0.46293 \tabularnewline
11 & -0.201095 & -1.6945 & 0.047281 \tabularnewline
12 & -0.101517 & -0.8554 & 0.197605 \tabularnewline
13 & -0.130793 & -1.1021 & 0.137074 \tabularnewline
14 & -0.228728 & -1.9273 & 0.028972 \tabularnewline
15 & 0.029079 & 0.245 & 0.403572 \tabularnewline
16 & 0.059731 & 0.5033 & 0.308155 \tabularnewline
17 & -0.06758 & -0.5694 & 0.285427 \tabularnewline
18 & 0.115617 & 0.9742 & 0.166631 \tabularnewline
19 & 0.060975 & 0.5138 & 0.304498 \tabularnewline
20 & -0.05996 & -0.5052 & 0.307482 \tabularnewline
21 & -0.153233 & -1.2912 & 0.100418 \tabularnewline
22 & 0.026943 & 0.227 & 0.410529 \tabularnewline
23 & -0.118708 & -1.0003 & 0.160293 \tabularnewline
24 & -0.009116 & -0.0768 & 0.469494 \tabularnewline
25 & -0.040529 & -0.3415 & 0.366867 \tabularnewline
26 & 0.07829 & 0.6597 & 0.255796 \tabularnewline
27 & 0.167328 & 1.4099 & 0.081463 \tabularnewline
28 & -0.087502 & -0.7373 & 0.231682 \tabularnewline
29 & 0.017081 & 0.1439 & 0.442983 \tabularnewline
30 & -0.037167 & -0.3132 & 0.377532 \tabularnewline
31 & -0.057738 & -0.4865 & 0.314052 \tabularnewline
32 & -0.144613 & -1.2185 & 0.113527 \tabularnewline
33 & -0.035001 & -0.2949 & 0.384457 \tabularnewline
34 & 0.064712 & 0.5453 & 0.293636 \tabularnewline
35 & 0.001972 & 0.0166 & 0.493396 \tabularnewline
36 & -0.076082 & -0.6411 & 0.261768 \tabularnewline
37 & 0.023903 & 0.2014 & 0.420476 \tabularnewline
38 & -0.058193 & -0.4903 & 0.312701 \tabularnewline
39 & 0.130696 & 1.1013 & 0.137251 \tabularnewline
40 & -0.091323 & -0.7695 & 0.222074 \tabularnewline
41 & 0.061692 & 0.5198 & 0.3024 \tabularnewline
42 & -0.077542 & -0.6534 & 0.257812 \tabularnewline
43 & 0.000995 & 0.0084 & 0.496667 \tabularnewline
44 & 0.018505 & 0.1559 & 0.438268 \tabularnewline
45 & 0.040385 & 0.3403 & 0.367322 \tabularnewline
46 & -0.108932 & -0.9179 & 0.180894 \tabularnewline
47 & 0.027438 & 0.2312 & 0.408914 \tabularnewline
48 & 0.115067 & 0.9696 & 0.167776 \tabularnewline
\hline
\end{tabular}
%Source: https://freestatistics.org/blog/index.php?pk=242742&T=2

[TABLE]
[ROW][C]Partial Autocorrelation Function[/C][/ROW]
[ROW][C]Time lag k[/C][C]PACF(k)[/C][C]T-STAT[/C][C]P-value[/C][/ROW]
[ROW][C]1[/C][C]0.277848[/C][C]2.3412[/C][C]0.011017[/C][/ROW]
[ROW][C]2[/C][C]-0.087327[/C][C]-0.7358[/C][C]0.232128[/C][/ROW]
[ROW][C]3[/C][C]0.128415[/C][C]1.082[/C][C]0.141447[/C][/ROW]
[ROW][C]4[/C][C]-0.088135[/C][C]-0.7426[/C][C]0.230076[/C][/ROW]
[ROW][C]5[/C][C]-0.100733[/C][C]-0.8488[/C][C]0.199425[/C][/ROW]
[ROW][C]6[/C][C]0.011687[/C][C]0.0985[/C][C]0.460915[/C][/ROW]
[ROW][C]7[/C][C]-0.355741[/C][C]-2.9975[/C][C]0.001874[/C][/ROW]
[ROW][C]8[/C][C]-0.013183[/C][C]-0.1111[/C][C]0.455932[/C][/ROW]
[ROW][C]9[/C][C]-0.136017[/C][C]-1.1461[/C][C]0.127801[/C][/ROW]
[ROW][C]10[/C][C]0.011083[/C][C]0.0934[/C][C]0.46293[/C][/ROW]
[ROW][C]11[/C][C]-0.201095[/C][C]-1.6945[/C][C]0.047281[/C][/ROW]
[ROW][C]12[/C][C]-0.101517[/C][C]-0.8554[/C][C]0.197605[/C][/ROW]
[ROW][C]13[/C][C]-0.130793[/C][C]-1.1021[/C][C]0.137074[/C][/ROW]
[ROW][C]14[/C][C]-0.228728[/C][C]-1.9273[/C][C]0.028972[/C][/ROW]
[ROW][C]15[/C][C]0.029079[/C][C]0.245[/C][C]0.403572[/C][/ROW]
[ROW][C]16[/C][C]0.059731[/C][C]0.5033[/C][C]0.308155[/C][/ROW]
[ROW][C]17[/C][C]-0.06758[/C][C]-0.5694[/C][C]0.285427[/C][/ROW]
[ROW][C]18[/C][C]0.115617[/C][C]0.9742[/C][C]0.166631[/C][/ROW]
[ROW][C]19[/C][C]0.060975[/C][C]0.5138[/C][C]0.304498[/C][/ROW]
[ROW][C]20[/C][C]-0.05996[/C][C]-0.5052[/C][C]0.307482[/C][/ROW]
[ROW][C]21[/C][C]-0.153233[/C][C]-1.2912[/C][C]0.100418[/C][/ROW]
[ROW][C]22[/C][C]0.026943[/C][C]0.227[/C][C]0.410529[/C][/ROW]
[ROW][C]23[/C][C]-0.118708[/C][C]-1.0003[/C][C]0.160293[/C][/ROW]
[ROW][C]24[/C][C]-0.009116[/C][C]-0.0768[/C][C]0.469494[/C][/ROW]
[ROW][C]25[/C][C]-0.040529[/C][C]-0.3415[/C][C]0.366867[/C][/ROW]
[ROW][C]26[/C][C]0.07829[/C][C]0.6597[/C][C]0.255796[/C][/ROW]
[ROW][C]27[/C][C]0.167328[/C][C]1.4099[/C][C]0.081463[/C][/ROW]
[ROW][C]28[/C][C]-0.087502[/C][C]-0.7373[/C][C]0.231682[/C][/ROW]
[ROW][C]29[/C][C]0.017081[/C][C]0.1439[/C][C]0.442983[/C][/ROW]
[ROW][C]30[/C][C]-0.037167[/C][C]-0.3132[/C][C]0.377532[/C][/ROW]
[ROW][C]31[/C][C]-0.057738[/C][C]-0.4865[/C][C]0.314052[/C][/ROW]
[ROW][C]32[/C][C]-0.144613[/C][C]-1.2185[/C][C]0.113527[/C][/ROW]
[ROW][C]33[/C][C]-0.035001[/C][C]-0.2949[/C][C]0.384457[/C][/ROW]
[ROW][C]34[/C][C]0.064712[/C][C]0.5453[/C][C]0.293636[/C][/ROW]
[ROW][C]35[/C][C]0.001972[/C][C]0.0166[/C][C]0.493396[/C][/ROW]
[ROW][C]36[/C][C]-0.076082[/C][C]-0.6411[/C][C]0.261768[/C][/ROW]
[ROW][C]37[/C][C]0.023903[/C][C]0.2014[/C][C]0.420476[/C][/ROW]
[ROW][C]38[/C][C]-0.058193[/C][C]-0.4903[/C][C]0.312701[/C][/ROW]
[ROW][C]39[/C][C]0.130696[/C][C]1.1013[/C][C]0.137251[/C][/ROW]
[ROW][C]40[/C][C]-0.091323[/C][C]-0.7695[/C][C]0.222074[/C][/ROW]
[ROW][C]41[/C][C]0.061692[/C][C]0.5198[/C][C]0.3024[/C][/ROW]
[ROW][C]42[/C][C]-0.077542[/C][C]-0.6534[/C][C]0.257812[/C][/ROW]
[ROW][C]43[/C][C]0.000995[/C][C]0.0084[/C][C]0.496667[/C][/ROW]
[ROW][C]44[/C][C]0.018505[/C][C]0.1559[/C][C]0.438268[/C][/ROW]
[ROW][C]45[/C][C]0.040385[/C][C]0.3403[/C][C]0.367322[/C][/ROW]
[ROW][C]46[/C][C]-0.108932[/C][C]-0.9179[/C][C]0.180894[/C][/ROW]
[ROW][C]47[/C][C]0.027438[/C][C]0.2312[/C][C]0.408914[/C][/ROW]
[ROW][C]48[/C][C]0.115067[/C][C]0.9696[/C][C]0.167776[/C][/ROW]
[/TABLE]
Source: https://freestatistics.org/blog/index.php?pk=242742&T=2

Globally Unique Identifier (entire table): ba.freestatistics.org/blog/index.php?pk=242742&T=2

As an alternative you can also use a QR Code:  

The GUIDs for individual cells are displayed in the table below:

Partial Autocorrelation Function
Time lag kPACF(k)T-STATP-value
10.2778482.34120.011017
2-0.087327-0.73580.232128
30.1284151.0820.141447
4-0.088135-0.74260.230076
5-0.100733-0.84880.199425
60.0116870.09850.460915
7-0.355741-2.99750.001874
8-0.013183-0.11110.455932
9-0.136017-1.14610.127801
100.0110830.09340.46293
11-0.201095-1.69450.047281
12-0.101517-0.85540.197605
13-0.130793-1.10210.137074
14-0.228728-1.92730.028972
150.0290790.2450.403572
160.0597310.50330.308155
17-0.06758-0.56940.285427
180.1156170.97420.166631
190.0609750.51380.304498
20-0.05996-0.50520.307482
21-0.153233-1.29120.100418
220.0269430.2270.410529
23-0.118708-1.00030.160293
24-0.009116-0.07680.469494
25-0.040529-0.34150.366867
260.078290.65970.255796
270.1673281.40990.081463
28-0.087502-0.73730.231682
290.0170810.14390.442983
30-0.037167-0.31320.377532
31-0.057738-0.48650.314052
32-0.144613-1.21850.113527
33-0.035001-0.29490.384457
340.0647120.54530.293636
350.0019720.01660.493396
36-0.076082-0.64110.261768
370.0239030.20140.420476
38-0.058193-0.49030.312701
390.1306961.10130.137251
40-0.091323-0.76950.222074
410.0616920.51980.3024
42-0.077542-0.65340.257812
430.0009950.00840.496667
440.0185050.15590.438268
450.0403850.34030.367322
46-0.108932-0.91790.180894
470.0274380.23120.408914
480.1150670.96960.167776


Parameters (Session):
par1 = 48 ; par2 = 1 ; par3 = 1 ; par4 = 0 ; par5 = 12 ; par6 = White Noise ; par7 = 0.95 ;
Parameters (R input):
par1 = 48 ; par2 = 1 ; par3 = 1 ; par4 = 0 ; par5 = 12 ; par6 = White Noise ; par7 = 0.95 ; par8 = ;
R code (references can be found in the software module):
if (par1 == 'Default') {
par1 = 10*log10(length(x))
} else {
par1 <- as.numeric(par1)
}
par2 <- as.numeric(par2)
par3 <- as.numeric(par3)
par4 <- as.numeric(par4)
par5 <- as.numeric(par5)
if (par6 == 'White Noise') par6 <- 'white' else par6 <- 'ma'
par7 <- as.numeric(par7)
if (par8 != '') par8 <- as.numeric(par8)
ox <- x
if (par8 == '') {
if (par2 == 0) {
x <- log(x)
} else {
x <- (x ^ par2 - 1) / par2
}
} else {
x <- log(x,base=par8)
}
if (par3 > 0) x <- diff(x,lag=1,difference=par3)
if (par4 > 0) x <- diff(x,lag=par5,difference=par4)
bitmap(file='picts.png')
op <- par(mfrow=c(2,1))
plot(ox,type='l',main='Original Time Series',xlab='time',ylab='value')
if (par8=='') {
mytitle <- paste('Working Time Series (lambda=',par2,', d=',par3,', D=',par4,')',sep='')
mysub <- paste('(lambda=',par2,', d=',par3,', D=',par4,', CI=', par7, ', CI type=',par6,')',sep='')
} else {
mytitle <- paste('Working Time Series (base=',par8,', d=',par3,', D=',par4,')',sep='')
mysub <- paste('(base=',par8,', d=',par3,', D=',par4,', CI=', par7, ', CI type=',par6,')',sep='')
}
plot(x,type='l', main=mytitle,xlab='time',ylab='value')
par(op)
dev.off()
bitmap(file='pic1.png')
racf <- acf(x, par1, main='Autocorrelation', xlab='time lag', ylab='ACF', ci.type=par6, ci=par7, sub=mysub)
dev.off()
bitmap(file='pic2.png')
rpacf <- pacf(x,par1,main='Partial Autocorrelation',xlab='lags',ylab='PACF',sub=mysub)
dev.off()
(myacf <- c(racf$acf))
(mypacf <- c(rpacf$acf))
lengthx <- length(x)
sqrtn <- sqrt(lengthx)
load(file='createtable')
a<-table.start()
a<-table.row.start(a)
a<-table.element(a,'Autocorrelation Function',4,TRUE)
a<-table.row.end(a)
a<-table.row.start(a)
a<-table.element(a,'Time lag k',header=TRUE)
a<-table.element(a,hyperlink('basics.htm','ACF(k)','click here for more information about the Autocorrelation Function'),header=TRUE)
a<-table.element(a,'T-STAT',header=TRUE)
a<-table.element(a,'P-value',header=TRUE)
a<-table.row.end(a)
for (i in 2:(par1+1)) {
a<-table.row.start(a)
a<-table.element(a,i-1,header=TRUE)
a<-table.element(a,round(myacf[i],6))
mytstat <- myacf[i]*sqrtn
a<-table.element(a,round(mytstat,4))
a<-table.element(a,round(1-pt(abs(mytstat),lengthx),6))
a<-table.row.end(a)
}
a<-table.end(a)
table.save(a,file='mytable.tab')
a<-table.start()
a<-table.row.start(a)
a<-table.element(a,'Partial Autocorrelation Function',4,TRUE)
a<-table.row.end(a)
a<-table.row.start(a)
a<-table.element(a,'Time lag k',header=TRUE)
a<-table.element(a,hyperlink('basics.htm','PACF(k)','click here for more information about the Partial Autocorrelation Function'),header=TRUE)
a<-table.element(a,'T-STAT',header=TRUE)
a<-table.element(a,'P-value',header=TRUE)
a<-table.row.end(a)
for (i in 1:par1) {
a<-table.row.start(a)
a<-table.element(a,i,header=TRUE)
a<-table.element(a,round(mypacf[i],6))
mytstat <- mypacf[i]*sqrtn
a<-table.element(a,round(mytstat,4))
a<-table.element(a,round(1-pt(abs(mytstat),lengthx),6))
a<-table.row.end(a)
}
a<-table.end(a)
table.save(a,file='mytable1.tab')