Free Statistics

of Irreproducible Research!

Author's title

Author*Unverified author*
R Software Modulerwasp_autocorrelation.wasp
Title produced by software(Partial) Autocorrelation Function
Date of computationThu, 16 Oct 2014 17:22:31 +0100
Cite this page as followsStatistical Computations at FreeStatistics.org, Office for Research Development and Education, URL https://freestatistics.org/blog/index.php?v=date/2014/Oct/16/t14134766043r28zwz38c446wb.htm/, Retrieved Mon, 13 May 2024 11:06:14 +0000
Statistical Computations at FreeStatistics.org, Office for Research Development and Education, URL https://freestatistics.org/blog/index.php?pk=242705, Retrieved Mon, 13 May 2024 11:06:14 +0000
QR Codes:

Original text written by user:
IsPrivate?No (this computation is public)
User-defined keywords
Estimated Impact45
Family? (F = Feedback message, R = changed R code, M = changed R Module, P = changed Parameters, D = changed Data)
-       [(Partial) Autocorrelation Function] [] [2014-10-16 16:22:31] [d41d8cd98f00b204e9800998ecf8427e] [Current]
Feedback Forum

Post a new message
Dataseries X:
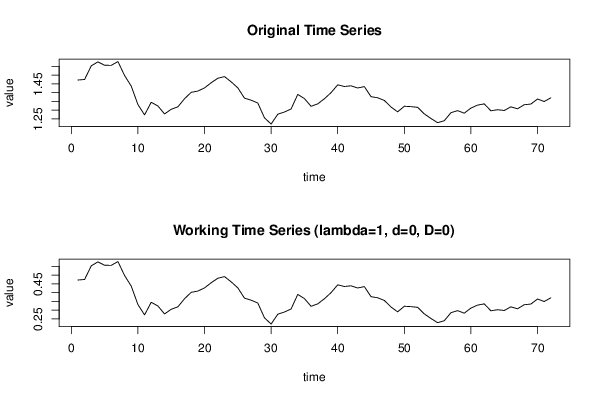
1,4718
1,4748
1,5527
1,5751
1,5557
1,5553
1,577
1,4975
1,437
1,3322
1,2732
1,3449
1,3239
1,2785
1,305
1,319
1,365
1,4016
1,4088
1,4268
1,4562
1,4816
1,4914
1,4614
1,4272
1,3686
1,3569
1,3406
1,2565
1,2209
1,277
1,2894
1,3067
1,3898
1,3661
1,322
1,336
1,3649
1,3999
1,4442
1,4349
1,4388
1,4264
1,4343
1,377
1,3706
1,3556
1,3179
1,2905
1,3224
1,3201
1,3162
1,2789
1,2526
1,2288
1,24
1,2856
1,2974
1,2828
1,3119
1,3288
1,3359
1,2964
1,3026
1,2982
1,3189
1,308
1,331
1,3348
1,3635
1,3493
1,3704


Summary of computational transaction
Raw Inputview raw input (R code)
Raw Outputview raw output of R engine
Computing time2 seconds
R Server'Herman Ole Andreas Wold' @ wold.wessa.net

\begin{tabular}{lllllllll}
\hline
Summary of computational transaction \tabularnewline
Raw Input & view raw input (R code)  \tabularnewline
Raw Output & view raw output of R engine  \tabularnewline
Computing time & 2 seconds \tabularnewline
R Server & 'Herman Ole Andreas Wold' @ wold.wessa.net \tabularnewline
\hline
\end{tabular}
%Source: https://freestatistics.org/blog/index.php?pk=242705&T=0

[TABLE]
[ROW][C]Summary of computational transaction[/C][/ROW]
[ROW][C]Raw Input[/C][C]view raw input (R code) [/C][/ROW]
[ROW][C]Raw Output[/C][C]view raw output of R engine [/C][/ROW]
[ROW][C]Computing time[/C][C]2 seconds[/C][/ROW]
[ROW][C]R Server[/C][C]'Herman Ole Andreas Wold' @ wold.wessa.net[/C][/ROW]
[/TABLE]
Source: https://freestatistics.org/blog/index.php?pk=242705&T=0

Globally Unique Identifier (entire table): ba.freestatistics.org/blog/index.php?pk=242705&T=0

As an alternative you can also use a QR Code:  

The GUIDs for individual cells are displayed in the table below:

Summary of computational transaction
Raw Inputview raw input (R code)
Raw Outputview raw output of R engine
Computing time2 seconds
R Server'Herman Ole Andreas Wold' @ wold.wessa.net


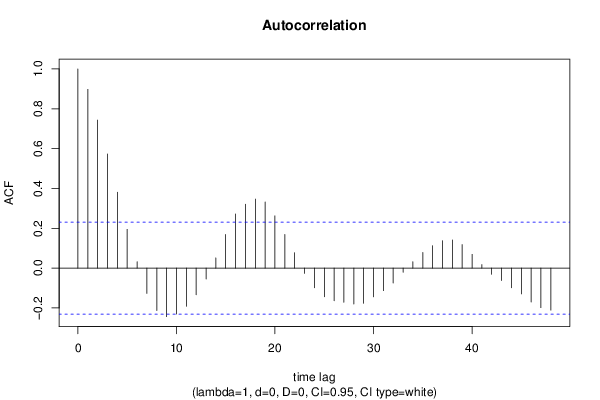
Autocorrelation Function
Time lag kACF(k)T-STATP-value
10.8974257.61490
20.7431596.30590
30.5729434.86163e-06
40.3808033.23120.00093
50.1946551.65170.051476
60.0323310.27430.392305
7-0.127123-1.07870.142167
8-0.212814-1.80580.037566
9-0.243791-2.06860.021086
10-0.230828-1.95860.027014
11-0.191427-1.62430.054339
12-0.134256-1.13920.129197
13-0.054836-0.46530.321561
140.0512340.43470.332527
150.1684361.42920.078632
160.2715922.30450.01204
170.3207192.72140.004073
180.3463872.93920.00221
190.3323222.81980.003101
200.2621732.22460.014621
210.1686371.43090.078387
220.0772580.65560.2571
23-0.026384-0.22390.411746
24-0.098871-0.83890.202138
25-0.144135-1.2230.112653
26-0.164302-1.39410.08378
27-0.171729-1.45720.074708
28-0.180444-1.53110.065061
29-0.176282-1.49580.069538
30-0.144362-1.2250.112293
31-0.113327-0.96160.169731
32-0.075158-0.63770.262835
33-0.020736-0.1760.430412
340.0319330.2710.393598
350.0780630.66240.25492
360.1121180.95140.172303
370.137781.16910.123109
380.1407811.19460.118088
390.1178340.99990.160365
400.0690930.58630.279764
410.0174740.14830.441272
42-0.031003-0.26310.396624
43-0.062465-0.530.298861
44-0.098573-0.83640.202842
45-0.129418-1.09820.137899
46-0.170062-1.4430.076675
47-0.198444-1.68390.04827
48-0.211224-1.79230.038643

\begin{tabular}{lllllllll}
\hline
Autocorrelation Function \tabularnewline
Time lag k & ACF(k) & T-STAT & P-value \tabularnewline
1 & 0.897425 & 7.6149 & 0 \tabularnewline
2 & 0.743159 & 6.3059 & 0 \tabularnewline
3 & 0.572943 & 4.8616 & 3e-06 \tabularnewline
4 & 0.380803 & 3.2312 & 0.00093 \tabularnewline
5 & 0.194655 & 1.6517 & 0.051476 \tabularnewline
6 & 0.032331 & 0.2743 & 0.392305 \tabularnewline
7 & -0.127123 & -1.0787 & 0.142167 \tabularnewline
8 & -0.212814 & -1.8058 & 0.037566 \tabularnewline
9 & -0.243791 & -2.0686 & 0.021086 \tabularnewline
10 & -0.230828 & -1.9586 & 0.027014 \tabularnewline
11 & -0.191427 & -1.6243 & 0.054339 \tabularnewline
12 & -0.134256 & -1.1392 & 0.129197 \tabularnewline
13 & -0.054836 & -0.4653 & 0.321561 \tabularnewline
14 & 0.051234 & 0.4347 & 0.332527 \tabularnewline
15 & 0.168436 & 1.4292 & 0.078632 \tabularnewline
16 & 0.271592 & 2.3045 & 0.01204 \tabularnewline
17 & 0.320719 & 2.7214 & 0.004073 \tabularnewline
18 & 0.346387 & 2.9392 & 0.00221 \tabularnewline
19 & 0.332322 & 2.8198 & 0.003101 \tabularnewline
20 & 0.262173 & 2.2246 & 0.014621 \tabularnewline
21 & 0.168637 & 1.4309 & 0.078387 \tabularnewline
22 & 0.077258 & 0.6556 & 0.2571 \tabularnewline
23 & -0.026384 & -0.2239 & 0.411746 \tabularnewline
24 & -0.098871 & -0.8389 & 0.202138 \tabularnewline
25 & -0.144135 & -1.223 & 0.112653 \tabularnewline
26 & -0.164302 & -1.3941 & 0.08378 \tabularnewline
27 & -0.171729 & -1.4572 & 0.074708 \tabularnewline
28 & -0.180444 & -1.5311 & 0.065061 \tabularnewline
29 & -0.176282 & -1.4958 & 0.069538 \tabularnewline
30 & -0.144362 & -1.225 & 0.112293 \tabularnewline
31 & -0.113327 & -0.9616 & 0.169731 \tabularnewline
32 & -0.075158 & -0.6377 & 0.262835 \tabularnewline
33 & -0.020736 & -0.176 & 0.430412 \tabularnewline
34 & 0.031933 & 0.271 & 0.393598 \tabularnewline
35 & 0.078063 & 0.6624 & 0.25492 \tabularnewline
36 & 0.112118 & 0.9514 & 0.172303 \tabularnewline
37 & 0.13778 & 1.1691 & 0.123109 \tabularnewline
38 & 0.140781 & 1.1946 & 0.118088 \tabularnewline
39 & 0.117834 & 0.9999 & 0.160365 \tabularnewline
40 & 0.069093 & 0.5863 & 0.279764 \tabularnewline
41 & 0.017474 & 0.1483 & 0.441272 \tabularnewline
42 & -0.031003 & -0.2631 & 0.396624 \tabularnewline
43 & -0.062465 & -0.53 & 0.298861 \tabularnewline
44 & -0.098573 & -0.8364 & 0.202842 \tabularnewline
45 & -0.129418 & -1.0982 & 0.137899 \tabularnewline
46 & -0.170062 & -1.443 & 0.076675 \tabularnewline
47 & -0.198444 & -1.6839 & 0.04827 \tabularnewline
48 & -0.211224 & -1.7923 & 0.038643 \tabularnewline
\hline
\end{tabular}
%Source: https://freestatistics.org/blog/index.php?pk=242705&T=1

[TABLE]
[ROW][C]Autocorrelation Function[/C][/ROW]
[ROW][C]Time lag k[/C][C]ACF(k)[/C][C]T-STAT[/C][C]P-value[/C][/ROW]
[ROW][C]1[/C][C]0.897425[/C][C]7.6149[/C][C]0[/C][/ROW]
[ROW][C]2[/C][C]0.743159[/C][C]6.3059[/C][C]0[/C][/ROW]
[ROW][C]3[/C][C]0.572943[/C][C]4.8616[/C][C]3e-06[/C][/ROW]
[ROW][C]4[/C][C]0.380803[/C][C]3.2312[/C][C]0.00093[/C][/ROW]
[ROW][C]5[/C][C]0.194655[/C][C]1.6517[/C][C]0.051476[/C][/ROW]
[ROW][C]6[/C][C]0.032331[/C][C]0.2743[/C][C]0.392305[/C][/ROW]
[ROW][C]7[/C][C]-0.127123[/C][C]-1.0787[/C][C]0.142167[/C][/ROW]
[ROW][C]8[/C][C]-0.212814[/C][C]-1.8058[/C][C]0.037566[/C][/ROW]
[ROW][C]9[/C][C]-0.243791[/C][C]-2.0686[/C][C]0.021086[/C][/ROW]
[ROW][C]10[/C][C]-0.230828[/C][C]-1.9586[/C][C]0.027014[/C][/ROW]
[ROW][C]11[/C][C]-0.191427[/C][C]-1.6243[/C][C]0.054339[/C][/ROW]
[ROW][C]12[/C][C]-0.134256[/C][C]-1.1392[/C][C]0.129197[/C][/ROW]
[ROW][C]13[/C][C]-0.054836[/C][C]-0.4653[/C][C]0.321561[/C][/ROW]
[ROW][C]14[/C][C]0.051234[/C][C]0.4347[/C][C]0.332527[/C][/ROW]
[ROW][C]15[/C][C]0.168436[/C][C]1.4292[/C][C]0.078632[/C][/ROW]
[ROW][C]16[/C][C]0.271592[/C][C]2.3045[/C][C]0.01204[/C][/ROW]
[ROW][C]17[/C][C]0.320719[/C][C]2.7214[/C][C]0.004073[/C][/ROW]
[ROW][C]18[/C][C]0.346387[/C][C]2.9392[/C][C]0.00221[/C][/ROW]
[ROW][C]19[/C][C]0.332322[/C][C]2.8198[/C][C]0.003101[/C][/ROW]
[ROW][C]20[/C][C]0.262173[/C][C]2.2246[/C][C]0.014621[/C][/ROW]
[ROW][C]21[/C][C]0.168637[/C][C]1.4309[/C][C]0.078387[/C][/ROW]
[ROW][C]22[/C][C]0.077258[/C][C]0.6556[/C][C]0.2571[/C][/ROW]
[ROW][C]23[/C][C]-0.026384[/C][C]-0.2239[/C][C]0.411746[/C][/ROW]
[ROW][C]24[/C][C]-0.098871[/C][C]-0.8389[/C][C]0.202138[/C][/ROW]
[ROW][C]25[/C][C]-0.144135[/C][C]-1.223[/C][C]0.112653[/C][/ROW]
[ROW][C]26[/C][C]-0.164302[/C][C]-1.3941[/C][C]0.08378[/C][/ROW]
[ROW][C]27[/C][C]-0.171729[/C][C]-1.4572[/C][C]0.074708[/C][/ROW]
[ROW][C]28[/C][C]-0.180444[/C][C]-1.5311[/C][C]0.065061[/C][/ROW]
[ROW][C]29[/C][C]-0.176282[/C][C]-1.4958[/C][C]0.069538[/C][/ROW]
[ROW][C]30[/C][C]-0.144362[/C][C]-1.225[/C][C]0.112293[/C][/ROW]
[ROW][C]31[/C][C]-0.113327[/C][C]-0.9616[/C][C]0.169731[/C][/ROW]
[ROW][C]32[/C][C]-0.075158[/C][C]-0.6377[/C][C]0.262835[/C][/ROW]
[ROW][C]33[/C][C]-0.020736[/C][C]-0.176[/C][C]0.430412[/C][/ROW]
[ROW][C]34[/C][C]0.031933[/C][C]0.271[/C][C]0.393598[/C][/ROW]
[ROW][C]35[/C][C]0.078063[/C][C]0.6624[/C][C]0.25492[/C][/ROW]
[ROW][C]36[/C][C]0.112118[/C][C]0.9514[/C][C]0.172303[/C][/ROW]
[ROW][C]37[/C][C]0.13778[/C][C]1.1691[/C][C]0.123109[/C][/ROW]
[ROW][C]38[/C][C]0.140781[/C][C]1.1946[/C][C]0.118088[/C][/ROW]
[ROW][C]39[/C][C]0.117834[/C][C]0.9999[/C][C]0.160365[/C][/ROW]
[ROW][C]40[/C][C]0.069093[/C][C]0.5863[/C][C]0.279764[/C][/ROW]
[ROW][C]41[/C][C]0.017474[/C][C]0.1483[/C][C]0.441272[/C][/ROW]
[ROW][C]42[/C][C]-0.031003[/C][C]-0.2631[/C][C]0.396624[/C][/ROW]
[ROW][C]43[/C][C]-0.062465[/C][C]-0.53[/C][C]0.298861[/C][/ROW]
[ROW][C]44[/C][C]-0.098573[/C][C]-0.8364[/C][C]0.202842[/C][/ROW]
[ROW][C]45[/C][C]-0.129418[/C][C]-1.0982[/C][C]0.137899[/C][/ROW]
[ROW][C]46[/C][C]-0.170062[/C][C]-1.443[/C][C]0.076675[/C][/ROW]
[ROW][C]47[/C][C]-0.198444[/C][C]-1.6839[/C][C]0.04827[/C][/ROW]
[ROW][C]48[/C][C]-0.211224[/C][C]-1.7923[/C][C]0.038643[/C][/ROW]
[/TABLE]
Source: https://freestatistics.org/blog/index.php?pk=242705&T=1

Globally Unique Identifier (entire table): ba.freestatistics.org/blog/index.php?pk=242705&T=1

As an alternative you can also use a QR Code:  

The GUIDs for individual cells are displayed in the table below:

Autocorrelation Function
Time lag kACF(k)T-STATP-value
10.8974257.61490
20.7431596.30590
30.5729434.86163e-06
40.3808033.23120.00093
50.1946551.65170.051476
60.0323310.27430.392305
7-0.127123-1.07870.142167
8-0.212814-1.80580.037566
9-0.243791-2.06860.021086
10-0.230828-1.95860.027014
11-0.191427-1.62430.054339
12-0.134256-1.13920.129197
13-0.054836-0.46530.321561
140.0512340.43470.332527
150.1684361.42920.078632
160.2715922.30450.01204
170.3207192.72140.004073
180.3463872.93920.00221
190.3323222.81980.003101
200.2621732.22460.014621
210.1686371.43090.078387
220.0772580.65560.2571
23-0.026384-0.22390.411746
24-0.098871-0.83890.202138
25-0.144135-1.2230.112653
26-0.164302-1.39410.08378
27-0.171729-1.45720.074708
28-0.180444-1.53110.065061
29-0.176282-1.49580.069538
30-0.144362-1.2250.112293
31-0.113327-0.96160.169731
32-0.075158-0.63770.262835
33-0.020736-0.1760.430412
340.0319330.2710.393598
350.0780630.66240.25492
360.1121180.95140.172303
370.137781.16910.123109
380.1407811.19460.118088
390.1178340.99990.160365
400.0690930.58630.279764
410.0174740.14830.441272
42-0.031003-0.26310.396624
43-0.062465-0.530.298861
44-0.098573-0.83640.202842
45-0.129418-1.09820.137899
46-0.170062-1.4430.076675
47-0.198444-1.68390.04827
48-0.211224-1.79230.038643


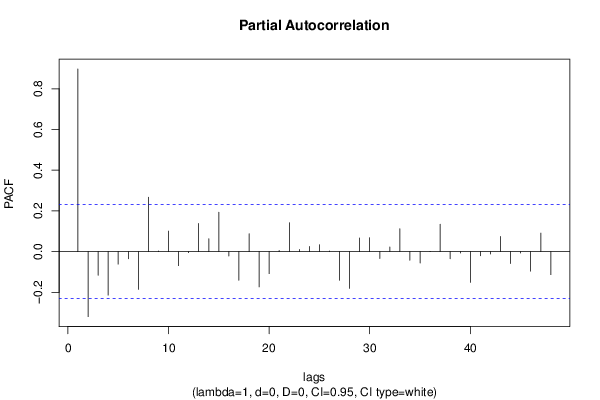
Partial Autocorrelation Function
Time lag kPACF(k)T-STATP-value
10.8974257.61490
2-0.319648-2.71230.004176
3-0.116224-0.98620.163671
4-0.213927-1.81520.036826
5-0.061646-0.52310.301261
6-0.035227-0.29890.382934
7-0.185723-1.57590.059715
80.2670612.26610.013226
90.0026930.02290.490915
100.100730.85470.19777
11-0.068895-0.58460.280325
12-0.005134-0.04360.482686
130.1380921.17180.12258
140.063440.53830.296014
150.1936891.64350.052319
16-0.02141-0.18170.428176
17-0.141149-1.19770.117483
180.0874270.74180.230298
19-0.173384-1.47120.072795
20-0.108402-0.91980.180369
210.0058180.04940.480382
220.1414041.19990.117065
230.0105150.08920.464575
240.024690.20950.417324
250.0334680.2840.388619
260.003090.02620.489579
27-0.140605-1.19310.118378
28-0.180837-1.53450.06465
290.0672150.57030.285112
300.0677940.57530.283456
31-0.034163-0.28990.386369
320.022610.19190.424198
330.1120770.9510.172392
34-0.042402-0.35980.360029
35-0.055835-0.47380.318547
360.0012530.01060.495774
370.1343351.13990.129059
38-0.035568-0.30180.381837
39-0.007033-0.05970.476289
40-0.151378-1.28450.101545
41-0.020232-0.17170.432089
42-0.012267-0.10410.458694
430.0742180.62980.265423
44-0.058648-0.49760.310126
45-0.007181-0.06090.475791
46-0.096061-0.81510.208851
470.0907590.77010.221876
48-0.113345-0.96180.169693

\begin{tabular}{lllllllll}
\hline
Partial Autocorrelation Function \tabularnewline
Time lag k & PACF(k) & T-STAT & P-value \tabularnewline
1 & 0.897425 & 7.6149 & 0 \tabularnewline
2 & -0.319648 & -2.7123 & 0.004176 \tabularnewline
3 & -0.116224 & -0.9862 & 0.163671 \tabularnewline
4 & -0.213927 & -1.8152 & 0.036826 \tabularnewline
5 & -0.061646 & -0.5231 & 0.301261 \tabularnewline
6 & -0.035227 & -0.2989 & 0.382934 \tabularnewline
7 & -0.185723 & -1.5759 & 0.059715 \tabularnewline
8 & 0.267061 & 2.2661 & 0.013226 \tabularnewline
9 & 0.002693 & 0.0229 & 0.490915 \tabularnewline
10 & 0.10073 & 0.8547 & 0.19777 \tabularnewline
11 & -0.068895 & -0.5846 & 0.280325 \tabularnewline
12 & -0.005134 & -0.0436 & 0.482686 \tabularnewline
13 & 0.138092 & 1.1718 & 0.12258 \tabularnewline
14 & 0.06344 & 0.5383 & 0.296014 \tabularnewline
15 & 0.193689 & 1.6435 & 0.052319 \tabularnewline
16 & -0.02141 & -0.1817 & 0.428176 \tabularnewline
17 & -0.141149 & -1.1977 & 0.117483 \tabularnewline
18 & 0.087427 & 0.7418 & 0.230298 \tabularnewline
19 & -0.173384 & -1.4712 & 0.072795 \tabularnewline
20 & -0.108402 & -0.9198 & 0.180369 \tabularnewline
21 & 0.005818 & 0.0494 & 0.480382 \tabularnewline
22 & 0.141404 & 1.1999 & 0.117065 \tabularnewline
23 & 0.010515 & 0.0892 & 0.464575 \tabularnewline
24 & 0.02469 & 0.2095 & 0.417324 \tabularnewline
25 & 0.033468 & 0.284 & 0.388619 \tabularnewline
26 & 0.00309 & 0.0262 & 0.489579 \tabularnewline
27 & -0.140605 & -1.1931 & 0.118378 \tabularnewline
28 & -0.180837 & -1.5345 & 0.06465 \tabularnewline
29 & 0.067215 & 0.5703 & 0.285112 \tabularnewline
30 & 0.067794 & 0.5753 & 0.283456 \tabularnewline
31 & -0.034163 & -0.2899 & 0.386369 \tabularnewline
32 & 0.02261 & 0.1919 & 0.424198 \tabularnewline
33 & 0.112077 & 0.951 & 0.172392 \tabularnewline
34 & -0.042402 & -0.3598 & 0.360029 \tabularnewline
35 & -0.055835 & -0.4738 & 0.318547 \tabularnewline
36 & 0.001253 & 0.0106 & 0.495774 \tabularnewline
37 & 0.134335 & 1.1399 & 0.129059 \tabularnewline
38 & -0.035568 & -0.3018 & 0.381837 \tabularnewline
39 & -0.007033 & -0.0597 & 0.476289 \tabularnewline
40 & -0.151378 & -1.2845 & 0.101545 \tabularnewline
41 & -0.020232 & -0.1717 & 0.432089 \tabularnewline
42 & -0.012267 & -0.1041 & 0.458694 \tabularnewline
43 & 0.074218 & 0.6298 & 0.265423 \tabularnewline
44 & -0.058648 & -0.4976 & 0.310126 \tabularnewline
45 & -0.007181 & -0.0609 & 0.475791 \tabularnewline
46 & -0.096061 & -0.8151 & 0.208851 \tabularnewline
47 & 0.090759 & 0.7701 & 0.221876 \tabularnewline
48 & -0.113345 & -0.9618 & 0.169693 \tabularnewline
\hline
\end{tabular}
%Source: https://freestatistics.org/blog/index.php?pk=242705&T=2

[TABLE]
[ROW][C]Partial Autocorrelation Function[/C][/ROW]
[ROW][C]Time lag k[/C][C]PACF(k)[/C][C]T-STAT[/C][C]P-value[/C][/ROW]
[ROW][C]1[/C][C]0.897425[/C][C]7.6149[/C][C]0[/C][/ROW]
[ROW][C]2[/C][C]-0.319648[/C][C]-2.7123[/C][C]0.004176[/C][/ROW]
[ROW][C]3[/C][C]-0.116224[/C][C]-0.9862[/C][C]0.163671[/C][/ROW]
[ROW][C]4[/C][C]-0.213927[/C][C]-1.8152[/C][C]0.036826[/C][/ROW]
[ROW][C]5[/C][C]-0.061646[/C][C]-0.5231[/C][C]0.301261[/C][/ROW]
[ROW][C]6[/C][C]-0.035227[/C][C]-0.2989[/C][C]0.382934[/C][/ROW]
[ROW][C]7[/C][C]-0.185723[/C][C]-1.5759[/C][C]0.059715[/C][/ROW]
[ROW][C]8[/C][C]0.267061[/C][C]2.2661[/C][C]0.013226[/C][/ROW]
[ROW][C]9[/C][C]0.002693[/C][C]0.0229[/C][C]0.490915[/C][/ROW]
[ROW][C]10[/C][C]0.10073[/C][C]0.8547[/C][C]0.19777[/C][/ROW]
[ROW][C]11[/C][C]-0.068895[/C][C]-0.5846[/C][C]0.280325[/C][/ROW]
[ROW][C]12[/C][C]-0.005134[/C][C]-0.0436[/C][C]0.482686[/C][/ROW]
[ROW][C]13[/C][C]0.138092[/C][C]1.1718[/C][C]0.12258[/C][/ROW]
[ROW][C]14[/C][C]0.06344[/C][C]0.5383[/C][C]0.296014[/C][/ROW]
[ROW][C]15[/C][C]0.193689[/C][C]1.6435[/C][C]0.052319[/C][/ROW]
[ROW][C]16[/C][C]-0.02141[/C][C]-0.1817[/C][C]0.428176[/C][/ROW]
[ROW][C]17[/C][C]-0.141149[/C][C]-1.1977[/C][C]0.117483[/C][/ROW]
[ROW][C]18[/C][C]0.087427[/C][C]0.7418[/C][C]0.230298[/C][/ROW]
[ROW][C]19[/C][C]-0.173384[/C][C]-1.4712[/C][C]0.072795[/C][/ROW]
[ROW][C]20[/C][C]-0.108402[/C][C]-0.9198[/C][C]0.180369[/C][/ROW]
[ROW][C]21[/C][C]0.005818[/C][C]0.0494[/C][C]0.480382[/C][/ROW]
[ROW][C]22[/C][C]0.141404[/C][C]1.1999[/C][C]0.117065[/C][/ROW]
[ROW][C]23[/C][C]0.010515[/C][C]0.0892[/C][C]0.464575[/C][/ROW]
[ROW][C]24[/C][C]0.02469[/C][C]0.2095[/C][C]0.417324[/C][/ROW]
[ROW][C]25[/C][C]0.033468[/C][C]0.284[/C][C]0.388619[/C][/ROW]
[ROW][C]26[/C][C]0.00309[/C][C]0.0262[/C][C]0.489579[/C][/ROW]
[ROW][C]27[/C][C]-0.140605[/C][C]-1.1931[/C][C]0.118378[/C][/ROW]
[ROW][C]28[/C][C]-0.180837[/C][C]-1.5345[/C][C]0.06465[/C][/ROW]
[ROW][C]29[/C][C]0.067215[/C][C]0.5703[/C][C]0.285112[/C][/ROW]
[ROW][C]30[/C][C]0.067794[/C][C]0.5753[/C][C]0.283456[/C][/ROW]
[ROW][C]31[/C][C]-0.034163[/C][C]-0.2899[/C][C]0.386369[/C][/ROW]
[ROW][C]32[/C][C]0.02261[/C][C]0.1919[/C][C]0.424198[/C][/ROW]
[ROW][C]33[/C][C]0.112077[/C][C]0.951[/C][C]0.172392[/C][/ROW]
[ROW][C]34[/C][C]-0.042402[/C][C]-0.3598[/C][C]0.360029[/C][/ROW]
[ROW][C]35[/C][C]-0.055835[/C][C]-0.4738[/C][C]0.318547[/C][/ROW]
[ROW][C]36[/C][C]0.001253[/C][C]0.0106[/C][C]0.495774[/C][/ROW]
[ROW][C]37[/C][C]0.134335[/C][C]1.1399[/C][C]0.129059[/C][/ROW]
[ROW][C]38[/C][C]-0.035568[/C][C]-0.3018[/C][C]0.381837[/C][/ROW]
[ROW][C]39[/C][C]-0.007033[/C][C]-0.0597[/C][C]0.476289[/C][/ROW]
[ROW][C]40[/C][C]-0.151378[/C][C]-1.2845[/C][C]0.101545[/C][/ROW]
[ROW][C]41[/C][C]-0.020232[/C][C]-0.1717[/C][C]0.432089[/C][/ROW]
[ROW][C]42[/C][C]-0.012267[/C][C]-0.1041[/C][C]0.458694[/C][/ROW]
[ROW][C]43[/C][C]0.074218[/C][C]0.6298[/C][C]0.265423[/C][/ROW]
[ROW][C]44[/C][C]-0.058648[/C][C]-0.4976[/C][C]0.310126[/C][/ROW]
[ROW][C]45[/C][C]-0.007181[/C][C]-0.0609[/C][C]0.475791[/C][/ROW]
[ROW][C]46[/C][C]-0.096061[/C][C]-0.8151[/C][C]0.208851[/C][/ROW]
[ROW][C]47[/C][C]0.090759[/C][C]0.7701[/C][C]0.221876[/C][/ROW]
[ROW][C]48[/C][C]-0.113345[/C][C]-0.9618[/C][C]0.169693[/C][/ROW]
[/TABLE]
Source: https://freestatistics.org/blog/index.php?pk=242705&T=2

Globally Unique Identifier (entire table): ba.freestatistics.org/blog/index.php?pk=242705&T=2

As an alternative you can also use a QR Code:  

The GUIDs for individual cells are displayed in the table below:

Partial Autocorrelation Function
Time lag kPACF(k)T-STATP-value
10.8974257.61490
2-0.319648-2.71230.004176
3-0.116224-0.98620.163671
4-0.213927-1.81520.036826
5-0.061646-0.52310.301261
6-0.035227-0.29890.382934
7-0.185723-1.57590.059715
80.2670612.26610.013226
90.0026930.02290.490915
100.100730.85470.19777
11-0.068895-0.58460.280325
12-0.005134-0.04360.482686
130.1380921.17180.12258
140.063440.53830.296014
150.1936891.64350.052319
16-0.02141-0.18170.428176
17-0.141149-1.19770.117483
180.0874270.74180.230298
19-0.173384-1.47120.072795
20-0.108402-0.91980.180369
210.0058180.04940.480382
220.1414041.19990.117065
230.0105150.08920.464575
240.024690.20950.417324
250.0334680.2840.388619
260.003090.02620.489579
27-0.140605-1.19310.118378
28-0.180837-1.53450.06465
290.0672150.57030.285112
300.0677940.57530.283456
31-0.034163-0.28990.386369
320.022610.19190.424198
330.1120770.9510.172392
34-0.042402-0.35980.360029
35-0.055835-0.47380.318547
360.0012530.01060.495774
370.1343351.13990.129059
38-0.035568-0.30180.381837
39-0.007033-0.05970.476289
40-0.151378-1.28450.101545
41-0.020232-0.17170.432089
42-0.012267-0.10410.458694
430.0742180.62980.265423
44-0.058648-0.49760.310126
45-0.007181-0.06090.475791
46-0.096061-0.81510.208851
470.0907590.77010.221876
48-0.113345-0.96180.169693


Parameters (Session):
par1 = 48 ; par2 = 1 ; par3 = 0 ; par4 = 0 ; par5 = 12 ; par6 = White Noise ; par7 = 0.95 ;
Parameters (R input):
par1 = 48 ; par2 = 1 ; par3 = 0 ; par4 = 0 ; par5 = 12 ; par6 = White Noise ; par7 = 0.95 ; par8 = ;
R code (references can be found in the software module):
if (par1 == 'Default') {
par1 = 10*log10(length(x))
} else {
par1 <- as.numeric(par1)
}
par2 <- as.numeric(par2)
par3 <- as.numeric(par3)
par4 <- as.numeric(par4)
par5 <- as.numeric(par5)
if (par6 == 'White Noise') par6 <- 'white' else par6 <- 'ma'
par7 <- as.numeric(par7)
if (par8 != '') par8 <- as.numeric(par8)
ox <- x
if (par8 == '') {
if (par2 == 0) {
x <- log(x)
} else {
x <- (x ^ par2 - 1) / par2
}
} else {
x <- log(x,base=par8)
}
if (par3 > 0) x <- diff(x,lag=1,difference=par3)
if (par4 > 0) x <- diff(x,lag=par5,difference=par4)
bitmap(file='picts.png')
op <- par(mfrow=c(2,1))
plot(ox,type='l',main='Original Time Series',xlab='time',ylab='value')
if (par8=='') {
mytitle <- paste('Working Time Series (lambda=',par2,', d=',par3,', D=',par4,')',sep='')
mysub <- paste('(lambda=',par2,', d=',par3,', D=',par4,', CI=', par7, ', CI type=',par6,')',sep='')
} else {
mytitle <- paste('Working Time Series (base=',par8,', d=',par3,', D=',par4,')',sep='')
mysub <- paste('(base=',par8,', d=',par3,', D=',par4,', CI=', par7, ', CI type=',par6,')',sep='')
}
plot(x,type='l', main=mytitle,xlab='time',ylab='value')
par(op)
dev.off()
bitmap(file='pic1.png')
racf <- acf(x, par1, main='Autocorrelation', xlab='time lag', ylab='ACF', ci.type=par6, ci=par7, sub=mysub)
dev.off()
bitmap(file='pic2.png')
rpacf <- pacf(x,par1,main='Partial Autocorrelation',xlab='lags',ylab='PACF',sub=mysub)
dev.off()
(myacf <- c(racf$acf))
(mypacf <- c(rpacf$acf))
lengthx <- length(x)
sqrtn <- sqrt(lengthx)
load(file='createtable')
a<-table.start()
a<-table.row.start(a)
a<-table.element(a,'Autocorrelation Function',4,TRUE)
a<-table.row.end(a)
a<-table.row.start(a)
a<-table.element(a,'Time lag k',header=TRUE)
a<-table.element(a,hyperlink('basics.htm','ACF(k)','click here for more information about the Autocorrelation Function'),header=TRUE)
a<-table.element(a,'T-STAT',header=TRUE)
a<-table.element(a,'P-value',header=TRUE)
a<-table.row.end(a)
for (i in 2:(par1+1)) {
a<-table.row.start(a)
a<-table.element(a,i-1,header=TRUE)
a<-table.element(a,round(myacf[i],6))
mytstat <- myacf[i]*sqrtn
a<-table.element(a,round(mytstat,4))
a<-table.element(a,round(1-pt(abs(mytstat),lengthx),6))
a<-table.row.end(a)
}
a<-table.end(a)
table.save(a,file='mytable.tab')
a<-table.start()
a<-table.row.start(a)
a<-table.element(a,'Partial Autocorrelation Function',4,TRUE)
a<-table.row.end(a)
a<-table.row.start(a)
a<-table.element(a,'Time lag k',header=TRUE)
a<-table.element(a,hyperlink('basics.htm','PACF(k)','click here for more information about the Partial Autocorrelation Function'),header=TRUE)
a<-table.element(a,'T-STAT',header=TRUE)
a<-table.element(a,'P-value',header=TRUE)
a<-table.row.end(a)
for (i in 1:par1) {
a<-table.row.start(a)
a<-table.element(a,i,header=TRUE)
a<-table.element(a,round(mypacf[i],6))
mytstat <- mypacf[i]*sqrtn
a<-table.element(a,round(mytstat,4))
a<-table.element(a,round(1-pt(abs(mytstat),lengthx),6))
a<-table.row.end(a)
}
a<-table.end(a)
table.save(a,file='mytable1.tab')