Free Statistics

of Irreproducible Research!

Author's title

Author*Unverified author*
R Software Modulerwasp_autocorrelation.wasp
Title produced by software(Partial) Autocorrelation Function
Date of computationThu, 16 Oct 2014 16:27:01 +0100
Cite this page as followsStatistical Computations at FreeStatistics.org, Office for Research Development and Education, URL https://freestatistics.org/blog/index.php?v=date/2014/Oct/16/t141347326418gapyh5sa9efv9.htm/, Retrieved Mon, 13 May 2024 09:44:32 +0000
Statistical Computations at FreeStatistics.org, Office for Research Development and Education, URL https://freestatistics.org/blog/index.php?pk=242469, Retrieved Mon, 13 May 2024 09:44:32 +0000
QR Codes:

Original text written by user:
IsPrivate?No (this computation is public)
User-defined keywords
Estimated Impact63
Family? (F = Feedback message, R = changed R code, M = changed R Module, P = changed Parameters, D = changed Data)
-       [(Partial) Autocorrelation Function] [Opgave 7 (3) - Ju...] [2014-10-16 15:27:01] [115da6a797a228c0404960d99697d46c] [Current]
Feedback Forum

Post a new message
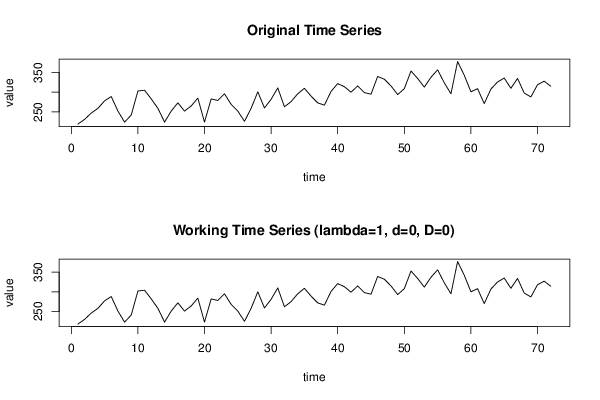
Dataseries X:
219
231
247
259
278
289
252
224
242
303
305
283
259
224
252
273
252
265
285
224
283
279
296
269
252
226
259
301
260
282
311
263
276
296
310
290
273
267
302
322
314
300
316
299
295
340
333
316
294
309
354
335
313
338
357
324
296
378
343
301
309
271
308
326
336
310
335
298
288
319
328
315


Summary of computational transaction
Raw Inputview raw input (R code)
Raw Outputview raw output of R engine
Computing time1 seconds
R Server'Sir Maurice George Kendall' @ kendall.wessa.net

\begin{tabular}{lllllllll}
\hline
Summary of computational transaction \tabularnewline
Raw Input & view raw input (R code)  \tabularnewline
Raw Output & view raw output of R engine  \tabularnewline
Computing time & 1 seconds \tabularnewline
R Server & 'Sir Maurice George Kendall' @ kendall.wessa.net \tabularnewline
\hline
\end{tabular}
%Source: https://freestatistics.org/blog/index.php?pk=242469&T=0

[TABLE]
[ROW][C]Summary of computational transaction[/C][/ROW]
[ROW][C]Raw Input[/C][C]view raw input (R code) [/C][/ROW]
[ROW][C]Raw Output[/C][C]view raw output of R engine [/C][/ROW]
[ROW][C]Computing time[/C][C]1 seconds[/C][/ROW]
[ROW][C]R Server[/C][C]'Sir Maurice George Kendall' @ kendall.wessa.net[/C][/ROW]
[/TABLE]
Source: https://freestatistics.org/blog/index.php?pk=242469&T=0

Globally Unique Identifier (entire table): ba.freestatistics.org/blog/index.php?pk=242469&T=0

As an alternative you can also use a QR Code:  

The GUIDs for individual cells are displayed in the table below:

Summary of computational transaction
Raw Inputview raw input (R code)
Raw Outputview raw output of R engine
Computing time1 seconds
R Server'Sir Maurice George Kendall' @ kendall.wessa.net


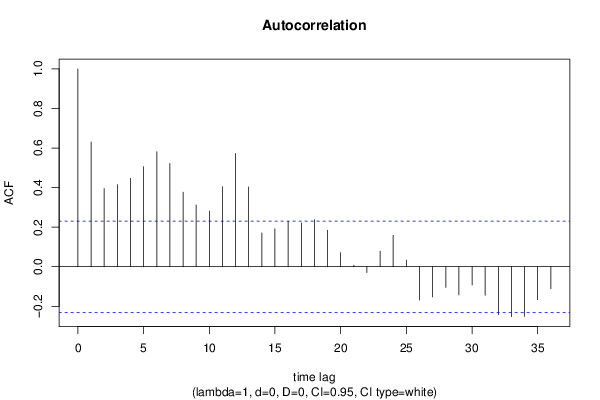
Autocorrelation Function
Time lag kACF(k)T-STATP-value
10.630335.34851e-06
20.3949113.35090.000643
30.4152053.52310.000373
40.4467243.79060.000155
50.5063744.29672.7e-05
60.5813774.93313e-06
70.5220954.43011.6e-05
80.377073.19950.001024
90.3117772.64550.005005
100.2810732.3850.009857
110.4052533.43870.000488
120.5727854.86023e-06
130.4035133.42390.000511
140.1708071.44930.075791
150.1918651.6280.053943
160.2293751.94630.02776
170.220791.87350.032531
180.237822.0180.023661
190.1847211.56740.060702
200.0714540.60630.273109
210.0074890.06350.474754
22-0.029186-0.24770.402554
230.07820.66350.25455
240.1585261.34510.091401
250.0335760.28490.388269
26-0.168526-1.430.078523
27-0.152357-1.29280.100108
28-0.104578-0.88740.188916
29-0.142498-1.20910.115284
30-0.092239-0.78270.218193
31-0.14465-1.22740.111836
32-0.242304-2.0560.021704
33-0.2524-2.14170.017802
34-0.251035-2.13010.01829
35-0.167236-1.4190.0801
36-0.110825-0.94040.175082

\begin{tabular}{lllllllll}
\hline
Autocorrelation Function \tabularnewline
Time lag k & ACF(k) & T-STAT & P-value \tabularnewline
1 & 0.63033 & 5.3485 & 1e-06 \tabularnewline
2 & 0.394911 & 3.3509 & 0.000643 \tabularnewline
3 & 0.415205 & 3.5231 & 0.000373 \tabularnewline
4 & 0.446724 & 3.7906 & 0.000155 \tabularnewline
5 & 0.506374 & 4.2967 & 2.7e-05 \tabularnewline
6 & 0.581377 & 4.9331 & 3e-06 \tabularnewline
7 & 0.522095 & 4.4301 & 1.6e-05 \tabularnewline
8 & 0.37707 & 3.1995 & 0.001024 \tabularnewline
9 & 0.311777 & 2.6455 & 0.005005 \tabularnewline
10 & 0.281073 & 2.385 & 0.009857 \tabularnewline
11 & 0.405253 & 3.4387 & 0.000488 \tabularnewline
12 & 0.572785 & 4.8602 & 3e-06 \tabularnewline
13 & 0.403513 & 3.4239 & 0.000511 \tabularnewline
14 & 0.170807 & 1.4493 & 0.075791 \tabularnewline
15 & 0.191865 & 1.628 & 0.053943 \tabularnewline
16 & 0.229375 & 1.9463 & 0.02776 \tabularnewline
17 & 0.22079 & 1.8735 & 0.032531 \tabularnewline
18 & 0.23782 & 2.018 & 0.023661 \tabularnewline
19 & 0.184721 & 1.5674 & 0.060702 \tabularnewline
20 & 0.071454 & 0.6063 & 0.273109 \tabularnewline
21 & 0.007489 & 0.0635 & 0.474754 \tabularnewline
22 & -0.029186 & -0.2477 & 0.402554 \tabularnewline
23 & 0.0782 & 0.6635 & 0.25455 \tabularnewline
24 & 0.158526 & 1.3451 & 0.091401 \tabularnewline
25 & 0.033576 & 0.2849 & 0.388269 \tabularnewline
26 & -0.168526 & -1.43 & 0.078523 \tabularnewline
27 & -0.152357 & -1.2928 & 0.100108 \tabularnewline
28 & -0.104578 & -0.8874 & 0.188916 \tabularnewline
29 & -0.142498 & -1.2091 & 0.115284 \tabularnewline
30 & -0.092239 & -0.7827 & 0.218193 \tabularnewline
31 & -0.14465 & -1.2274 & 0.111836 \tabularnewline
32 & -0.242304 & -2.056 & 0.021704 \tabularnewline
33 & -0.2524 & -2.1417 & 0.017802 \tabularnewline
34 & -0.251035 & -2.1301 & 0.01829 \tabularnewline
35 & -0.167236 & -1.419 & 0.0801 \tabularnewline
36 & -0.110825 & -0.9404 & 0.175082 \tabularnewline
\hline
\end{tabular}
%Source: https://freestatistics.org/blog/index.php?pk=242469&T=1

[TABLE]
[ROW][C]Autocorrelation Function[/C][/ROW]
[ROW][C]Time lag k[/C][C]ACF(k)[/C][C]T-STAT[/C][C]P-value[/C][/ROW]
[ROW][C]1[/C][C]0.63033[/C][C]5.3485[/C][C]1e-06[/C][/ROW]
[ROW][C]2[/C][C]0.394911[/C][C]3.3509[/C][C]0.000643[/C][/ROW]
[ROW][C]3[/C][C]0.415205[/C][C]3.5231[/C][C]0.000373[/C][/ROW]
[ROW][C]4[/C][C]0.446724[/C][C]3.7906[/C][C]0.000155[/C][/ROW]
[ROW][C]5[/C][C]0.506374[/C][C]4.2967[/C][C]2.7e-05[/C][/ROW]
[ROW][C]6[/C][C]0.581377[/C][C]4.9331[/C][C]3e-06[/C][/ROW]
[ROW][C]7[/C][C]0.522095[/C][C]4.4301[/C][C]1.6e-05[/C][/ROW]
[ROW][C]8[/C][C]0.37707[/C][C]3.1995[/C][C]0.001024[/C][/ROW]
[ROW][C]9[/C][C]0.311777[/C][C]2.6455[/C][C]0.005005[/C][/ROW]
[ROW][C]10[/C][C]0.281073[/C][C]2.385[/C][C]0.009857[/C][/ROW]
[ROW][C]11[/C][C]0.405253[/C][C]3.4387[/C][C]0.000488[/C][/ROW]
[ROW][C]12[/C][C]0.572785[/C][C]4.8602[/C][C]3e-06[/C][/ROW]
[ROW][C]13[/C][C]0.403513[/C][C]3.4239[/C][C]0.000511[/C][/ROW]
[ROW][C]14[/C][C]0.170807[/C][C]1.4493[/C][C]0.075791[/C][/ROW]
[ROW][C]15[/C][C]0.191865[/C][C]1.628[/C][C]0.053943[/C][/ROW]
[ROW][C]16[/C][C]0.229375[/C][C]1.9463[/C][C]0.02776[/C][/ROW]
[ROW][C]17[/C][C]0.22079[/C][C]1.8735[/C][C]0.032531[/C][/ROW]
[ROW][C]18[/C][C]0.23782[/C][C]2.018[/C][C]0.023661[/C][/ROW]
[ROW][C]19[/C][C]0.184721[/C][C]1.5674[/C][C]0.060702[/C][/ROW]
[ROW][C]20[/C][C]0.071454[/C][C]0.6063[/C][C]0.273109[/C][/ROW]
[ROW][C]21[/C][C]0.007489[/C][C]0.0635[/C][C]0.474754[/C][/ROW]
[ROW][C]22[/C][C]-0.029186[/C][C]-0.2477[/C][C]0.402554[/C][/ROW]
[ROW][C]23[/C][C]0.0782[/C][C]0.6635[/C][C]0.25455[/C][/ROW]
[ROW][C]24[/C][C]0.158526[/C][C]1.3451[/C][C]0.091401[/C][/ROW]
[ROW][C]25[/C][C]0.033576[/C][C]0.2849[/C][C]0.388269[/C][/ROW]
[ROW][C]26[/C][C]-0.168526[/C][C]-1.43[/C][C]0.078523[/C][/ROW]
[ROW][C]27[/C][C]-0.152357[/C][C]-1.2928[/C][C]0.100108[/C][/ROW]
[ROW][C]28[/C][C]-0.104578[/C][C]-0.8874[/C][C]0.188916[/C][/ROW]
[ROW][C]29[/C][C]-0.142498[/C][C]-1.2091[/C][C]0.115284[/C][/ROW]
[ROW][C]30[/C][C]-0.092239[/C][C]-0.7827[/C][C]0.218193[/C][/ROW]
[ROW][C]31[/C][C]-0.14465[/C][C]-1.2274[/C][C]0.111836[/C][/ROW]
[ROW][C]32[/C][C]-0.242304[/C][C]-2.056[/C][C]0.021704[/C][/ROW]
[ROW][C]33[/C][C]-0.2524[/C][C]-2.1417[/C][C]0.017802[/C][/ROW]
[ROW][C]34[/C][C]-0.251035[/C][C]-2.1301[/C][C]0.01829[/C][/ROW]
[ROW][C]35[/C][C]-0.167236[/C][C]-1.419[/C][C]0.0801[/C][/ROW]
[ROW][C]36[/C][C]-0.110825[/C][C]-0.9404[/C][C]0.175082[/C][/ROW]
[/TABLE]
Source: https://freestatistics.org/blog/index.php?pk=242469&T=1

Globally Unique Identifier (entire table): ba.freestatistics.org/blog/index.php?pk=242469&T=1

As an alternative you can also use a QR Code:  

The GUIDs for individual cells are displayed in the table below:

Autocorrelation Function
Time lag kACF(k)T-STATP-value
10.630335.34851e-06
20.3949113.35090.000643
30.4152053.52310.000373
40.4467243.79060.000155
50.5063744.29672.7e-05
60.5813774.93313e-06
70.5220954.43011.6e-05
80.377073.19950.001024
90.3117772.64550.005005
100.2810732.3850.009857
110.4052533.43870.000488
120.5727854.86023e-06
130.4035133.42390.000511
140.1708071.44930.075791
150.1918651.6280.053943
160.2293751.94630.02776
170.220791.87350.032531
180.237822.0180.023661
190.1847211.56740.060702
200.0714540.60630.273109
210.0074890.06350.474754
22-0.029186-0.24770.402554
230.07820.66350.25455
240.1585261.34510.091401
250.0335760.28490.388269
26-0.168526-1.430.078523
27-0.152357-1.29280.100108
28-0.104578-0.88740.188916
29-0.142498-1.20910.115284
30-0.092239-0.78270.218193
31-0.14465-1.22740.111836
32-0.242304-2.0560.021704
33-0.2524-2.14170.017802
34-0.251035-2.13010.01829
35-0.167236-1.4190.0801
36-0.110825-0.94040.175082


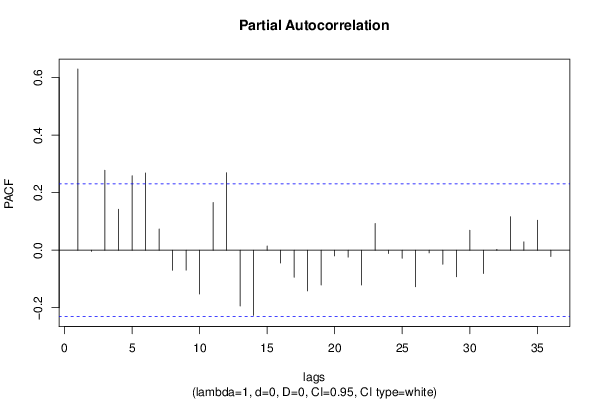
Partial Autocorrelation Function
Time lag kPACF(k)T-STATP-value
10.630335.34851e-06
2-0.003989-0.03390.486544
30.278432.36260.010427
40.1423851.20820.115467
50.2588442.19640.015644
60.2686352.27940.012803
70.074050.62830.265885
8-0.069944-0.59350.277354
9-0.069315-0.58820.279134
10-0.152187-1.29140.100356
110.1660711.40920.081547
120.2691982.28420.012654
13-0.194228-1.64810.051847
14-0.226457-1.92160.02931
150.0145140.12320.451164
16-0.044729-0.37950.352704
17-0.093751-0.79550.214467
18-0.141448-1.20020.116993
19-0.120758-1.02470.154476
20-0.019754-0.16760.433677
21-0.024018-0.20380.419542
22-0.121202-1.02840.153593
230.0928060.78750.216791
24-0.011156-0.09470.462423
25-0.027708-0.23510.407396
26-0.127045-1.0780.142313
27-0.009364-0.07950.468444
28-0.048882-0.41480.33977
29-0.092464-0.78460.217635
300.069570.59030.278413
31-0.081239-0.68930.246415
320.0031010.02630.489542
330.116620.98960.162853
340.0290050.24610.403145
350.1042090.88420.189754
36-0.022041-0.1870.426084

\begin{tabular}{lllllllll}
\hline
Partial Autocorrelation Function \tabularnewline
Time lag k & PACF(k) & T-STAT & P-value \tabularnewline
1 & 0.63033 & 5.3485 & 1e-06 \tabularnewline
2 & -0.003989 & -0.0339 & 0.486544 \tabularnewline
3 & 0.27843 & 2.3626 & 0.010427 \tabularnewline
4 & 0.142385 & 1.2082 & 0.115467 \tabularnewline
5 & 0.258844 & 2.1964 & 0.015644 \tabularnewline
6 & 0.268635 & 2.2794 & 0.012803 \tabularnewline
7 & 0.07405 & 0.6283 & 0.265885 \tabularnewline
8 & -0.069944 & -0.5935 & 0.277354 \tabularnewline
9 & -0.069315 & -0.5882 & 0.279134 \tabularnewline
10 & -0.152187 & -1.2914 & 0.100356 \tabularnewline
11 & 0.166071 & 1.4092 & 0.081547 \tabularnewline
12 & 0.269198 & 2.2842 & 0.012654 \tabularnewline
13 & -0.194228 & -1.6481 & 0.051847 \tabularnewline
14 & -0.226457 & -1.9216 & 0.02931 \tabularnewline
15 & 0.014514 & 0.1232 & 0.451164 \tabularnewline
16 & -0.044729 & -0.3795 & 0.352704 \tabularnewline
17 & -0.093751 & -0.7955 & 0.214467 \tabularnewline
18 & -0.141448 & -1.2002 & 0.116993 \tabularnewline
19 & -0.120758 & -1.0247 & 0.154476 \tabularnewline
20 & -0.019754 & -0.1676 & 0.433677 \tabularnewline
21 & -0.024018 & -0.2038 & 0.419542 \tabularnewline
22 & -0.121202 & -1.0284 & 0.153593 \tabularnewline
23 & 0.092806 & 0.7875 & 0.216791 \tabularnewline
24 & -0.011156 & -0.0947 & 0.462423 \tabularnewline
25 & -0.027708 & -0.2351 & 0.407396 \tabularnewline
26 & -0.127045 & -1.078 & 0.142313 \tabularnewline
27 & -0.009364 & -0.0795 & 0.468444 \tabularnewline
28 & -0.048882 & -0.4148 & 0.33977 \tabularnewline
29 & -0.092464 & -0.7846 & 0.217635 \tabularnewline
30 & 0.06957 & 0.5903 & 0.278413 \tabularnewline
31 & -0.081239 & -0.6893 & 0.246415 \tabularnewline
32 & 0.003101 & 0.0263 & 0.489542 \tabularnewline
33 & 0.11662 & 0.9896 & 0.162853 \tabularnewline
34 & 0.029005 & 0.2461 & 0.403145 \tabularnewline
35 & 0.104209 & 0.8842 & 0.189754 \tabularnewline
36 & -0.022041 & -0.187 & 0.426084 \tabularnewline
\hline
\end{tabular}
%Source: https://freestatistics.org/blog/index.php?pk=242469&T=2

[TABLE]
[ROW][C]Partial Autocorrelation Function[/C][/ROW]
[ROW][C]Time lag k[/C][C]PACF(k)[/C][C]T-STAT[/C][C]P-value[/C][/ROW]
[ROW][C]1[/C][C]0.63033[/C][C]5.3485[/C][C]1e-06[/C][/ROW]
[ROW][C]2[/C][C]-0.003989[/C][C]-0.0339[/C][C]0.486544[/C][/ROW]
[ROW][C]3[/C][C]0.27843[/C][C]2.3626[/C][C]0.010427[/C][/ROW]
[ROW][C]4[/C][C]0.142385[/C][C]1.2082[/C][C]0.115467[/C][/ROW]
[ROW][C]5[/C][C]0.258844[/C][C]2.1964[/C][C]0.015644[/C][/ROW]
[ROW][C]6[/C][C]0.268635[/C][C]2.2794[/C][C]0.012803[/C][/ROW]
[ROW][C]7[/C][C]0.07405[/C][C]0.6283[/C][C]0.265885[/C][/ROW]
[ROW][C]8[/C][C]-0.069944[/C][C]-0.5935[/C][C]0.277354[/C][/ROW]
[ROW][C]9[/C][C]-0.069315[/C][C]-0.5882[/C][C]0.279134[/C][/ROW]
[ROW][C]10[/C][C]-0.152187[/C][C]-1.2914[/C][C]0.100356[/C][/ROW]
[ROW][C]11[/C][C]0.166071[/C][C]1.4092[/C][C]0.081547[/C][/ROW]
[ROW][C]12[/C][C]0.269198[/C][C]2.2842[/C][C]0.012654[/C][/ROW]
[ROW][C]13[/C][C]-0.194228[/C][C]-1.6481[/C][C]0.051847[/C][/ROW]
[ROW][C]14[/C][C]-0.226457[/C][C]-1.9216[/C][C]0.02931[/C][/ROW]
[ROW][C]15[/C][C]0.014514[/C][C]0.1232[/C][C]0.451164[/C][/ROW]
[ROW][C]16[/C][C]-0.044729[/C][C]-0.3795[/C][C]0.352704[/C][/ROW]
[ROW][C]17[/C][C]-0.093751[/C][C]-0.7955[/C][C]0.214467[/C][/ROW]
[ROW][C]18[/C][C]-0.141448[/C][C]-1.2002[/C][C]0.116993[/C][/ROW]
[ROW][C]19[/C][C]-0.120758[/C][C]-1.0247[/C][C]0.154476[/C][/ROW]
[ROW][C]20[/C][C]-0.019754[/C][C]-0.1676[/C][C]0.433677[/C][/ROW]
[ROW][C]21[/C][C]-0.024018[/C][C]-0.2038[/C][C]0.419542[/C][/ROW]
[ROW][C]22[/C][C]-0.121202[/C][C]-1.0284[/C][C]0.153593[/C][/ROW]
[ROW][C]23[/C][C]0.092806[/C][C]0.7875[/C][C]0.216791[/C][/ROW]
[ROW][C]24[/C][C]-0.011156[/C][C]-0.0947[/C][C]0.462423[/C][/ROW]
[ROW][C]25[/C][C]-0.027708[/C][C]-0.2351[/C][C]0.407396[/C][/ROW]
[ROW][C]26[/C][C]-0.127045[/C][C]-1.078[/C][C]0.142313[/C][/ROW]
[ROW][C]27[/C][C]-0.009364[/C][C]-0.0795[/C][C]0.468444[/C][/ROW]
[ROW][C]28[/C][C]-0.048882[/C][C]-0.4148[/C][C]0.33977[/C][/ROW]
[ROW][C]29[/C][C]-0.092464[/C][C]-0.7846[/C][C]0.217635[/C][/ROW]
[ROW][C]30[/C][C]0.06957[/C][C]0.5903[/C][C]0.278413[/C][/ROW]
[ROW][C]31[/C][C]-0.081239[/C][C]-0.6893[/C][C]0.246415[/C][/ROW]
[ROW][C]32[/C][C]0.003101[/C][C]0.0263[/C][C]0.489542[/C][/ROW]
[ROW][C]33[/C][C]0.11662[/C][C]0.9896[/C][C]0.162853[/C][/ROW]
[ROW][C]34[/C][C]0.029005[/C][C]0.2461[/C][C]0.403145[/C][/ROW]
[ROW][C]35[/C][C]0.104209[/C][C]0.8842[/C][C]0.189754[/C][/ROW]
[ROW][C]36[/C][C]-0.022041[/C][C]-0.187[/C][C]0.426084[/C][/ROW]
[/TABLE]
Source: https://freestatistics.org/blog/index.php?pk=242469&T=2

Globally Unique Identifier (entire table): ba.freestatistics.org/blog/index.php?pk=242469&T=2

As an alternative you can also use a QR Code:  

The GUIDs for individual cells are displayed in the table below:

Partial Autocorrelation Function
Time lag kPACF(k)T-STATP-value
10.630335.34851e-06
2-0.003989-0.03390.486544
30.278432.36260.010427
40.1423851.20820.115467
50.2588442.19640.015644
60.2686352.27940.012803
70.074050.62830.265885
8-0.069944-0.59350.277354
9-0.069315-0.58820.279134
10-0.152187-1.29140.100356
110.1660711.40920.081547
120.2691982.28420.012654
13-0.194228-1.64810.051847
14-0.226457-1.92160.02931
150.0145140.12320.451164
16-0.044729-0.37950.352704
17-0.093751-0.79550.214467
18-0.141448-1.20020.116993
19-0.120758-1.02470.154476
20-0.019754-0.16760.433677
21-0.024018-0.20380.419542
22-0.121202-1.02840.153593
230.0928060.78750.216791
24-0.011156-0.09470.462423
25-0.027708-0.23510.407396
26-0.127045-1.0780.142313
27-0.009364-0.07950.468444
28-0.048882-0.41480.33977
29-0.092464-0.78460.217635
300.069570.59030.278413
31-0.081239-0.68930.246415
320.0031010.02630.489542
330.116620.98960.162853
340.0290050.24610.403145
350.1042090.88420.189754
36-0.022041-0.1870.426084


Parameters (Session):
par1 = 36 ; par2 = 1 ; par3 = 0 ; par4 = 0 ; par5 = 12 ; par6 = White Noise ; par7 = 0.95 ;
Parameters (R input):
par1 = 36 ; par2 = 1 ; par3 = 0 ; par4 = 0 ; par5 = 12 ; par6 = White Noise ; par7 = 0.95 ; par8 = ;
R code (references can be found in the software module):
if (par1 == 'Default') {
par1 = 10*log10(length(x))
} else {
par1 <- as.numeric(par1)
}
par2 <- as.numeric(par2)
par3 <- as.numeric(par3)
par4 <- as.numeric(par4)
par5 <- as.numeric(par5)
if (par6 == 'White Noise') par6 <- 'white' else par6 <- 'ma'
par7 <- as.numeric(par7)
if (par8 != '') par8 <- as.numeric(par8)
ox <- x
if (par8 == '') {
if (par2 == 0) {
x <- log(x)
} else {
x <- (x ^ par2 - 1) / par2
}
} else {
x <- log(x,base=par8)
}
if (par3 > 0) x <- diff(x,lag=1,difference=par3)
if (par4 > 0) x <- diff(x,lag=par5,difference=par4)
bitmap(file='picts.png')
op <- par(mfrow=c(2,1))
plot(ox,type='l',main='Original Time Series',xlab='time',ylab='value')
if (par8=='') {
mytitle <- paste('Working Time Series (lambda=',par2,', d=',par3,', D=',par4,')',sep='')
mysub <- paste('(lambda=',par2,', d=',par3,', D=',par4,', CI=', par7, ', CI type=',par6,')',sep='')
} else {
mytitle <- paste('Working Time Series (base=',par8,', d=',par3,', D=',par4,')',sep='')
mysub <- paste('(base=',par8,', d=',par3,', D=',par4,', CI=', par7, ', CI type=',par6,')',sep='')
}
plot(x,type='l', main=mytitle,xlab='time',ylab='value')
par(op)
dev.off()
bitmap(file='pic1.png')
racf <- acf(x, par1, main='Autocorrelation', xlab='time lag', ylab='ACF', ci.type=par6, ci=par7, sub=mysub)
dev.off()
bitmap(file='pic2.png')
rpacf <- pacf(x,par1,main='Partial Autocorrelation',xlab='lags',ylab='PACF',sub=mysub)
dev.off()
(myacf <- c(racf$acf))
(mypacf <- c(rpacf$acf))
lengthx <- length(x)
sqrtn <- sqrt(lengthx)
load(file='createtable')
a<-table.start()
a<-table.row.start(a)
a<-table.element(a,'Autocorrelation Function',4,TRUE)
a<-table.row.end(a)
a<-table.row.start(a)
a<-table.element(a,'Time lag k',header=TRUE)
a<-table.element(a,hyperlink('basics.htm','ACF(k)','click here for more information about the Autocorrelation Function'),header=TRUE)
a<-table.element(a,'T-STAT',header=TRUE)
a<-table.element(a,'P-value',header=TRUE)
a<-table.row.end(a)
for (i in 2:(par1+1)) {
a<-table.row.start(a)
a<-table.element(a,i-1,header=TRUE)
a<-table.element(a,round(myacf[i],6))
mytstat <- myacf[i]*sqrtn
a<-table.element(a,round(mytstat,4))
a<-table.element(a,round(1-pt(abs(mytstat),lengthx),6))
a<-table.row.end(a)
}
a<-table.end(a)
table.save(a,file='mytable.tab')
a<-table.start()
a<-table.row.start(a)
a<-table.element(a,'Partial Autocorrelation Function',4,TRUE)
a<-table.row.end(a)
a<-table.row.start(a)
a<-table.element(a,'Time lag k',header=TRUE)
a<-table.element(a,hyperlink('basics.htm','PACF(k)','click here for more information about the Partial Autocorrelation Function'),header=TRUE)
a<-table.element(a,'T-STAT',header=TRUE)
a<-table.element(a,'P-value',header=TRUE)
a<-table.row.end(a)
for (i in 1:par1) {
a<-table.row.start(a)
a<-table.element(a,i,header=TRUE)
a<-table.element(a,round(mypacf[i],6))
mytstat <- mypacf[i]*sqrtn
a<-table.element(a,round(mytstat,4))
a<-table.element(a,round(1-pt(abs(mytstat),lengthx),6))
a<-table.row.end(a)
}
a<-table.end(a)
table.save(a,file='mytable1.tab')