Free Statistics

of Irreproducible Research!

Author's title

Author*Unverified author*
R Software Modulerwasp_autocorrelation.wasp
Title produced by software(Partial) Autocorrelation Function
Date of computationThu, 16 Oct 2014 14:50:29 +0100
Cite this page as followsStatistical Computations at FreeStatistics.org, Office for Research Development and Education, URL https://freestatistics.org/blog/index.php?v=date/2014/Oct/16/t1413467512lrvmp7hvcm6n96d.htm/, Retrieved Mon, 13 May 2024 09:27:02 +0000
Statistical Computations at FreeStatistics.org, Office for Research Development and Education, URL https://freestatistics.org/blog/index.php?pk=242393, Retrieved Mon, 13 May 2024 09:27:02 +0000
QR Codes:

Original text written by user:
IsPrivate?No (this computation is public)
User-defined keywords
Estimated Impact57
Family? (F = Feedback message, R = changed R code, M = changed R Module, P = changed Parameters, D = changed Data)
-       [(Partial) Autocorrelation Function] [] [2014-10-16 13:50:29] [345c72938773a86f996d724d064c8f2d] [Current]
Feedback Forum

Post a new message
Dataseries X:
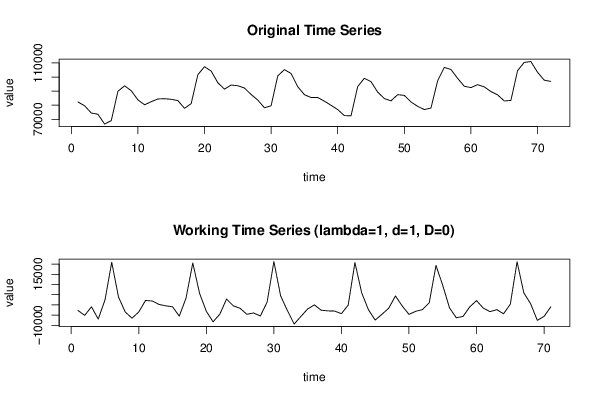
82303
79596
74472
73562
66618
69029
89899
93774
90305
83799
80320
82497
84420
84646
84186
83269
77793
81145
101691
107357
104253
95963
91432
94324
93855
92183
87600
83641
78195
79604
100846
105293
102518
93132
87479
85476
85460
82868
79941
76909
72613
72496
93244
99126
96748
89318
84724
83111
87497
86961
82319
79196
76898
77971
97335
106855
105401
99108
93456
92506
94602
93027
89722
87391
83030
83390
104501
110393
111017
103434
97817
96893


Summary of computational transaction
Raw Inputview raw input (R code)
Raw Outputview raw output of R engine
Computing time1 seconds
R Server'Sir Maurice George Kendall' @ kendall.wessa.net

\begin{tabular}{lllllllll}
\hline
Summary of computational transaction \tabularnewline
Raw Input & view raw input (R code)  \tabularnewline
Raw Output & view raw output of R engine  \tabularnewline
Computing time & 1 seconds \tabularnewline
R Server & 'Sir Maurice George Kendall' @ kendall.wessa.net \tabularnewline
\hline
\end{tabular}
%Source: https://freestatistics.org/blog/index.php?pk=242393&T=0

[TABLE]
[ROW][C]Summary of computational transaction[/C][/ROW]
[ROW][C]Raw Input[/C][C]view raw input (R code) [/C][/ROW]
[ROW][C]Raw Output[/C][C]view raw output of R engine [/C][/ROW]
[ROW][C]Computing time[/C][C]1 seconds[/C][/ROW]
[ROW][C]R Server[/C][C]'Sir Maurice George Kendall' @ kendall.wessa.net[/C][/ROW]
[/TABLE]
Source: https://freestatistics.org/blog/index.php?pk=242393&T=0

Globally Unique Identifier (entire table): ba.freestatistics.org/blog/index.php?pk=242393&T=0

As an alternative you can also use a QR Code:  

The GUIDs for individual cells are displayed in the table below:

Summary of computational transaction
Raw Inputview raw input (R code)
Raw Outputview raw output of R engine
Computing time1 seconds
R Server'Sir Maurice George Kendall' @ kendall.wessa.net


Autocorrelation Function
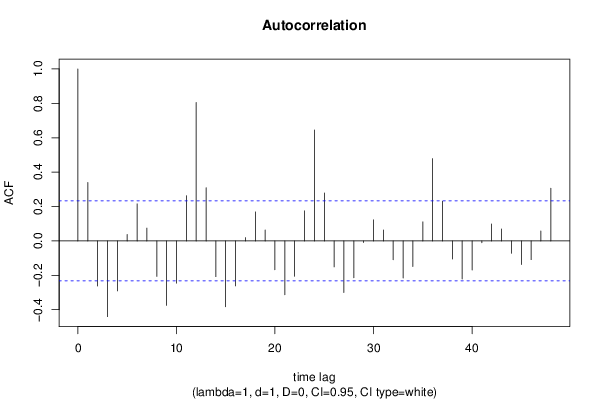
Time lag kACF(k)T-STATP-value
10.3397322.86260.002759
2-0.262273-2.20990.015167
3-0.440188-3.70910.000205
4-0.290287-2.4460.008463
50.037780.31830.375582
60.2157081.81760.036673
70.0747270.62970.265467
8-0.206089-1.73650.043403
9-0.374471-3.15530.001176
10-0.245423-2.0680.021144
110.2624222.21120.015121
120.8053586.78610
130.3091062.60460.005598
14-0.207735-1.75040.042184
15-0.382485-3.22290.000959
16-0.261188-2.20080.015501
170.0192890.16250.435674
180.1688621.42290.079579
190.0640430.53960.295569
20-0.167208-1.40890.081611
21-0.313072-2.6380.00512
22-0.205618-1.73260.043757
230.1750691.47520.072295
240.6455695.43970
250.2792952.35340.010688
26-0.150972-1.27210.103742
27-0.299591-2.52440.006913
28-0.214238-1.80520.037642
29-0.008693-0.07320.470909
300.1224271.03160.152882
310.0641570.54060.295239
32-0.109147-0.91970.180426
33-0.215273-1.81390.036957
34-0.149138-1.25670.106498
350.1109320.93470.176547
360.4784684.03166.9e-05
370.2312051.94820.027674
38-0.105368-0.88780.18881
39-0.220937-1.86160.033396
40-0.168875-1.4230.079563
41-0.010728-0.09040.464114
420.0983480.82870.205028
430.0693970.58470.280286
44-0.071864-0.60550.273377
45-0.137093-1.15520.125948
46-0.108555-0.91470.181723
470.0577340.48650.314064
480.3063582.58140.005953

\begin{tabular}{lllllllll}
\hline
Autocorrelation Function \tabularnewline
Time lag k & ACF(k) & T-STAT & P-value \tabularnewline
1 & 0.339732 & 2.8626 & 0.002759 \tabularnewline
2 & -0.262273 & -2.2099 & 0.015167 \tabularnewline
3 & -0.440188 & -3.7091 & 0.000205 \tabularnewline
4 & -0.290287 & -2.446 & 0.008463 \tabularnewline
5 & 0.03778 & 0.3183 & 0.375582 \tabularnewline
6 & 0.215708 & 1.8176 & 0.036673 \tabularnewline
7 & 0.074727 & 0.6297 & 0.265467 \tabularnewline
8 & -0.206089 & -1.7365 & 0.043403 \tabularnewline
9 & -0.374471 & -3.1553 & 0.001176 \tabularnewline
10 & -0.245423 & -2.068 & 0.021144 \tabularnewline
11 & 0.262422 & 2.2112 & 0.015121 \tabularnewline
12 & 0.805358 & 6.7861 & 0 \tabularnewline
13 & 0.309106 & 2.6046 & 0.005598 \tabularnewline
14 & -0.207735 & -1.7504 & 0.042184 \tabularnewline
15 & -0.382485 & -3.2229 & 0.000959 \tabularnewline
16 & -0.261188 & -2.2008 & 0.015501 \tabularnewline
17 & 0.019289 & 0.1625 & 0.435674 \tabularnewline
18 & 0.168862 & 1.4229 & 0.079579 \tabularnewline
19 & 0.064043 & 0.5396 & 0.295569 \tabularnewline
20 & -0.167208 & -1.4089 & 0.081611 \tabularnewline
21 & -0.313072 & -2.638 & 0.00512 \tabularnewline
22 & -0.205618 & -1.7326 & 0.043757 \tabularnewline
23 & 0.175069 & 1.4752 & 0.072295 \tabularnewline
24 & 0.645569 & 5.4397 & 0 \tabularnewline
25 & 0.279295 & 2.3534 & 0.010688 \tabularnewline
26 & -0.150972 & -1.2721 & 0.103742 \tabularnewline
27 & -0.299591 & -2.5244 & 0.006913 \tabularnewline
28 & -0.214238 & -1.8052 & 0.037642 \tabularnewline
29 & -0.008693 & -0.0732 & 0.470909 \tabularnewline
30 & 0.122427 & 1.0316 & 0.152882 \tabularnewline
31 & 0.064157 & 0.5406 & 0.295239 \tabularnewline
32 & -0.109147 & -0.9197 & 0.180426 \tabularnewline
33 & -0.215273 & -1.8139 & 0.036957 \tabularnewline
34 & -0.149138 & -1.2567 & 0.106498 \tabularnewline
35 & 0.110932 & 0.9347 & 0.176547 \tabularnewline
36 & 0.478468 & 4.0316 & 6.9e-05 \tabularnewline
37 & 0.231205 & 1.9482 & 0.027674 \tabularnewline
38 & -0.105368 & -0.8878 & 0.18881 \tabularnewline
39 & -0.220937 & -1.8616 & 0.033396 \tabularnewline
40 & -0.168875 & -1.423 & 0.079563 \tabularnewline
41 & -0.010728 & -0.0904 & 0.464114 \tabularnewline
42 & 0.098348 & 0.8287 & 0.205028 \tabularnewline
43 & 0.069397 & 0.5847 & 0.280286 \tabularnewline
44 & -0.071864 & -0.6055 & 0.273377 \tabularnewline
45 & -0.137093 & -1.1552 & 0.125948 \tabularnewline
46 & -0.108555 & -0.9147 & 0.181723 \tabularnewline
47 & 0.057734 & 0.4865 & 0.314064 \tabularnewline
48 & 0.306358 & 2.5814 & 0.005953 \tabularnewline
\hline
\end{tabular}
%Source: https://freestatistics.org/blog/index.php?pk=242393&T=1

[TABLE]
[ROW][C]Autocorrelation Function[/C][/ROW]
[ROW][C]Time lag k[/C][C]ACF(k)[/C][C]T-STAT[/C][C]P-value[/C][/ROW]
[ROW][C]1[/C][C]0.339732[/C][C]2.8626[/C][C]0.002759[/C][/ROW]
[ROW][C]2[/C][C]-0.262273[/C][C]-2.2099[/C][C]0.015167[/C][/ROW]
[ROW][C]3[/C][C]-0.440188[/C][C]-3.7091[/C][C]0.000205[/C][/ROW]
[ROW][C]4[/C][C]-0.290287[/C][C]-2.446[/C][C]0.008463[/C][/ROW]
[ROW][C]5[/C][C]0.03778[/C][C]0.3183[/C][C]0.375582[/C][/ROW]
[ROW][C]6[/C][C]0.215708[/C][C]1.8176[/C][C]0.036673[/C][/ROW]
[ROW][C]7[/C][C]0.074727[/C][C]0.6297[/C][C]0.265467[/C][/ROW]
[ROW][C]8[/C][C]-0.206089[/C][C]-1.7365[/C][C]0.043403[/C][/ROW]
[ROW][C]9[/C][C]-0.374471[/C][C]-3.1553[/C][C]0.001176[/C][/ROW]
[ROW][C]10[/C][C]-0.245423[/C][C]-2.068[/C][C]0.021144[/C][/ROW]
[ROW][C]11[/C][C]0.262422[/C][C]2.2112[/C][C]0.015121[/C][/ROW]
[ROW][C]12[/C][C]0.805358[/C][C]6.7861[/C][C]0[/C][/ROW]
[ROW][C]13[/C][C]0.309106[/C][C]2.6046[/C][C]0.005598[/C][/ROW]
[ROW][C]14[/C][C]-0.207735[/C][C]-1.7504[/C][C]0.042184[/C][/ROW]
[ROW][C]15[/C][C]-0.382485[/C][C]-3.2229[/C][C]0.000959[/C][/ROW]
[ROW][C]16[/C][C]-0.261188[/C][C]-2.2008[/C][C]0.015501[/C][/ROW]
[ROW][C]17[/C][C]0.019289[/C][C]0.1625[/C][C]0.435674[/C][/ROW]
[ROW][C]18[/C][C]0.168862[/C][C]1.4229[/C][C]0.079579[/C][/ROW]
[ROW][C]19[/C][C]0.064043[/C][C]0.5396[/C][C]0.295569[/C][/ROW]
[ROW][C]20[/C][C]-0.167208[/C][C]-1.4089[/C][C]0.081611[/C][/ROW]
[ROW][C]21[/C][C]-0.313072[/C][C]-2.638[/C][C]0.00512[/C][/ROW]
[ROW][C]22[/C][C]-0.205618[/C][C]-1.7326[/C][C]0.043757[/C][/ROW]
[ROW][C]23[/C][C]0.175069[/C][C]1.4752[/C][C]0.072295[/C][/ROW]
[ROW][C]24[/C][C]0.645569[/C][C]5.4397[/C][C]0[/C][/ROW]
[ROW][C]25[/C][C]0.279295[/C][C]2.3534[/C][C]0.010688[/C][/ROW]
[ROW][C]26[/C][C]-0.150972[/C][C]-1.2721[/C][C]0.103742[/C][/ROW]
[ROW][C]27[/C][C]-0.299591[/C][C]-2.5244[/C][C]0.006913[/C][/ROW]
[ROW][C]28[/C][C]-0.214238[/C][C]-1.8052[/C][C]0.037642[/C][/ROW]
[ROW][C]29[/C][C]-0.008693[/C][C]-0.0732[/C][C]0.470909[/C][/ROW]
[ROW][C]30[/C][C]0.122427[/C][C]1.0316[/C][C]0.152882[/C][/ROW]
[ROW][C]31[/C][C]0.064157[/C][C]0.5406[/C][C]0.295239[/C][/ROW]
[ROW][C]32[/C][C]-0.109147[/C][C]-0.9197[/C][C]0.180426[/C][/ROW]
[ROW][C]33[/C][C]-0.215273[/C][C]-1.8139[/C][C]0.036957[/C][/ROW]
[ROW][C]34[/C][C]-0.149138[/C][C]-1.2567[/C][C]0.106498[/C][/ROW]
[ROW][C]35[/C][C]0.110932[/C][C]0.9347[/C][C]0.176547[/C][/ROW]
[ROW][C]36[/C][C]0.478468[/C][C]4.0316[/C][C]6.9e-05[/C][/ROW]
[ROW][C]37[/C][C]0.231205[/C][C]1.9482[/C][C]0.027674[/C][/ROW]
[ROW][C]38[/C][C]-0.105368[/C][C]-0.8878[/C][C]0.18881[/C][/ROW]
[ROW][C]39[/C][C]-0.220937[/C][C]-1.8616[/C][C]0.033396[/C][/ROW]
[ROW][C]40[/C][C]-0.168875[/C][C]-1.423[/C][C]0.079563[/C][/ROW]
[ROW][C]41[/C][C]-0.010728[/C][C]-0.0904[/C][C]0.464114[/C][/ROW]
[ROW][C]42[/C][C]0.098348[/C][C]0.8287[/C][C]0.205028[/C][/ROW]
[ROW][C]43[/C][C]0.069397[/C][C]0.5847[/C][C]0.280286[/C][/ROW]
[ROW][C]44[/C][C]-0.071864[/C][C]-0.6055[/C][C]0.273377[/C][/ROW]
[ROW][C]45[/C][C]-0.137093[/C][C]-1.1552[/C][C]0.125948[/C][/ROW]
[ROW][C]46[/C][C]-0.108555[/C][C]-0.9147[/C][C]0.181723[/C][/ROW]
[ROW][C]47[/C][C]0.057734[/C][C]0.4865[/C][C]0.314064[/C][/ROW]
[ROW][C]48[/C][C]0.306358[/C][C]2.5814[/C][C]0.005953[/C][/ROW]
[/TABLE]
Source: https://freestatistics.org/blog/index.php?pk=242393&T=1

Globally Unique Identifier (entire table): ba.freestatistics.org/blog/index.php?pk=242393&T=1

As an alternative you can also use a QR Code:  

The GUIDs for individual cells are displayed in the table below:

Autocorrelation Function
Time lag kACF(k)T-STATP-value
10.3397322.86260.002759
2-0.262273-2.20990.015167
3-0.440188-3.70910.000205
4-0.290287-2.4460.008463
50.037780.31830.375582
60.2157081.81760.036673
70.0747270.62970.265467
8-0.206089-1.73650.043403
9-0.374471-3.15530.001176
10-0.245423-2.0680.021144
110.2624222.21120.015121
120.8053586.78610
130.3091062.60460.005598
14-0.207735-1.75040.042184
15-0.382485-3.22290.000959
16-0.261188-2.20080.015501
170.0192890.16250.435674
180.1688621.42290.079579
190.0640430.53960.295569
20-0.167208-1.40890.081611
21-0.313072-2.6380.00512
22-0.205618-1.73260.043757
230.1750691.47520.072295
240.6455695.43970
250.2792952.35340.010688
26-0.150972-1.27210.103742
27-0.299591-2.52440.006913
28-0.214238-1.80520.037642
29-0.008693-0.07320.470909
300.1224271.03160.152882
310.0641570.54060.295239
32-0.109147-0.91970.180426
33-0.215273-1.81390.036957
34-0.149138-1.25670.106498
350.1109320.93470.176547
360.4784684.03166.9e-05
370.2312051.94820.027674
38-0.105368-0.88780.18881
39-0.220937-1.86160.033396
40-0.168875-1.4230.079563
41-0.010728-0.09040.464114
420.0983480.82870.205028
430.0693970.58470.280286
44-0.071864-0.60550.273377
45-0.137093-1.15520.125948
46-0.108555-0.91470.181723
470.0577340.48650.314064
480.3063582.58140.005953


Partial Autocorrelation Function
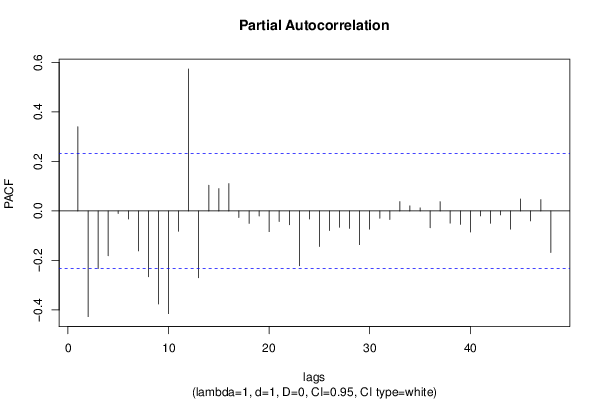
Time lag kPACF(k)T-STATP-value
10.3397322.86260.002759
2-0.42697-3.59770.000295
3-0.232244-1.95690.027145
4-0.181339-1.5280.065479
5-0.010501-0.08850.464871
6-0.032815-0.27650.391482
7-0.161408-1.360.089059
8-0.265556-2.23760.014193
9-0.376048-3.16860.00113
10-0.414841-3.49550.00041
11-0.082117-0.69190.245619
120.5734524.8324e-06
13-0.270195-2.27670.01291
140.1039840.87620.191943
150.0902590.76050.224726
160.1103940.93020.177712
17-0.026368-0.22220.412405
18-0.05028-0.42370.336545
19-0.020452-0.17230.431832
20-0.08371-0.70540.241449
21-0.042908-0.36150.359382
22-0.055971-0.47160.319322
23-0.221293-1.86460.033182
24-0.032688-0.27540.391892
25-0.143478-1.2090.115343
26-0.078729-0.66340.254618
27-0.065784-0.55430.290555
28-0.070475-0.59380.277255
29-0.136138-1.14710.127592
30-0.073552-0.61980.2687
31-0.02939-0.24760.402563
32-0.034958-0.29460.384595
330.0377480.31810.375682
340.0205870.17350.431387
350.0124850.10520.458258
36-0.068157-0.57430.283789
370.037510.31610.37644
38-0.049302-0.41540.339541
39-0.054484-0.45910.323784
40-0.084974-0.7160.238169
41-0.020076-0.16920.433074
42-0.049462-0.41680.339051
43-0.015852-0.13360.44706
44-0.073618-0.62030.268517
450.04850.40870.342006
46-0.040217-0.33890.367851
470.045690.3850.350699
48-0.168179-1.41710.080413

\begin{tabular}{lllllllll}
\hline
Partial Autocorrelation Function \tabularnewline
Time lag k & PACF(k) & T-STAT & P-value \tabularnewline
1 & 0.339732 & 2.8626 & 0.002759 \tabularnewline
2 & -0.42697 & -3.5977 & 0.000295 \tabularnewline
3 & -0.232244 & -1.9569 & 0.027145 \tabularnewline
4 & -0.181339 & -1.528 & 0.065479 \tabularnewline
5 & -0.010501 & -0.0885 & 0.464871 \tabularnewline
6 & -0.032815 & -0.2765 & 0.391482 \tabularnewline
7 & -0.161408 & -1.36 & 0.089059 \tabularnewline
8 & -0.265556 & -2.2376 & 0.014193 \tabularnewline
9 & -0.376048 & -3.1686 & 0.00113 \tabularnewline
10 & -0.414841 & -3.4955 & 0.00041 \tabularnewline
11 & -0.082117 & -0.6919 & 0.245619 \tabularnewline
12 & 0.573452 & 4.832 & 4e-06 \tabularnewline
13 & -0.270195 & -2.2767 & 0.01291 \tabularnewline
14 & 0.103984 & 0.8762 & 0.191943 \tabularnewline
15 & 0.090259 & 0.7605 & 0.224726 \tabularnewline
16 & 0.110394 & 0.9302 & 0.177712 \tabularnewline
17 & -0.026368 & -0.2222 & 0.412405 \tabularnewline
18 & -0.05028 & -0.4237 & 0.336545 \tabularnewline
19 & -0.020452 & -0.1723 & 0.431832 \tabularnewline
20 & -0.08371 & -0.7054 & 0.241449 \tabularnewline
21 & -0.042908 & -0.3615 & 0.359382 \tabularnewline
22 & -0.055971 & -0.4716 & 0.319322 \tabularnewline
23 & -0.221293 & -1.8646 & 0.033182 \tabularnewline
24 & -0.032688 & -0.2754 & 0.391892 \tabularnewline
25 & -0.143478 & -1.209 & 0.115343 \tabularnewline
26 & -0.078729 & -0.6634 & 0.254618 \tabularnewline
27 & -0.065784 & -0.5543 & 0.290555 \tabularnewline
28 & -0.070475 & -0.5938 & 0.277255 \tabularnewline
29 & -0.136138 & -1.1471 & 0.127592 \tabularnewline
30 & -0.073552 & -0.6198 & 0.2687 \tabularnewline
31 & -0.02939 & -0.2476 & 0.402563 \tabularnewline
32 & -0.034958 & -0.2946 & 0.384595 \tabularnewline
33 & 0.037748 & 0.3181 & 0.375682 \tabularnewline
34 & 0.020587 & 0.1735 & 0.431387 \tabularnewline
35 & 0.012485 & 0.1052 & 0.458258 \tabularnewline
36 & -0.068157 & -0.5743 & 0.283789 \tabularnewline
37 & 0.03751 & 0.3161 & 0.37644 \tabularnewline
38 & -0.049302 & -0.4154 & 0.339541 \tabularnewline
39 & -0.054484 & -0.4591 & 0.323784 \tabularnewline
40 & -0.084974 & -0.716 & 0.238169 \tabularnewline
41 & -0.020076 & -0.1692 & 0.433074 \tabularnewline
42 & -0.049462 & -0.4168 & 0.339051 \tabularnewline
43 & -0.015852 & -0.1336 & 0.44706 \tabularnewline
44 & -0.073618 & -0.6203 & 0.268517 \tabularnewline
45 & 0.0485 & 0.4087 & 0.342006 \tabularnewline
46 & -0.040217 & -0.3389 & 0.367851 \tabularnewline
47 & 0.04569 & 0.385 & 0.350699 \tabularnewline
48 & -0.168179 & -1.4171 & 0.080413 \tabularnewline
\hline
\end{tabular}
%Source: https://freestatistics.org/blog/index.php?pk=242393&T=2

[TABLE]
[ROW][C]Partial Autocorrelation Function[/C][/ROW]
[ROW][C]Time lag k[/C][C]PACF(k)[/C][C]T-STAT[/C][C]P-value[/C][/ROW]
[ROW][C]1[/C][C]0.339732[/C][C]2.8626[/C][C]0.002759[/C][/ROW]
[ROW][C]2[/C][C]-0.42697[/C][C]-3.5977[/C][C]0.000295[/C][/ROW]
[ROW][C]3[/C][C]-0.232244[/C][C]-1.9569[/C][C]0.027145[/C][/ROW]
[ROW][C]4[/C][C]-0.181339[/C][C]-1.528[/C][C]0.065479[/C][/ROW]
[ROW][C]5[/C][C]-0.010501[/C][C]-0.0885[/C][C]0.464871[/C][/ROW]
[ROW][C]6[/C][C]-0.032815[/C][C]-0.2765[/C][C]0.391482[/C][/ROW]
[ROW][C]7[/C][C]-0.161408[/C][C]-1.36[/C][C]0.089059[/C][/ROW]
[ROW][C]8[/C][C]-0.265556[/C][C]-2.2376[/C][C]0.014193[/C][/ROW]
[ROW][C]9[/C][C]-0.376048[/C][C]-3.1686[/C][C]0.00113[/C][/ROW]
[ROW][C]10[/C][C]-0.414841[/C][C]-3.4955[/C][C]0.00041[/C][/ROW]
[ROW][C]11[/C][C]-0.082117[/C][C]-0.6919[/C][C]0.245619[/C][/ROW]
[ROW][C]12[/C][C]0.573452[/C][C]4.832[/C][C]4e-06[/C][/ROW]
[ROW][C]13[/C][C]-0.270195[/C][C]-2.2767[/C][C]0.01291[/C][/ROW]
[ROW][C]14[/C][C]0.103984[/C][C]0.8762[/C][C]0.191943[/C][/ROW]
[ROW][C]15[/C][C]0.090259[/C][C]0.7605[/C][C]0.224726[/C][/ROW]
[ROW][C]16[/C][C]0.110394[/C][C]0.9302[/C][C]0.177712[/C][/ROW]
[ROW][C]17[/C][C]-0.026368[/C][C]-0.2222[/C][C]0.412405[/C][/ROW]
[ROW][C]18[/C][C]-0.05028[/C][C]-0.4237[/C][C]0.336545[/C][/ROW]
[ROW][C]19[/C][C]-0.020452[/C][C]-0.1723[/C][C]0.431832[/C][/ROW]
[ROW][C]20[/C][C]-0.08371[/C][C]-0.7054[/C][C]0.241449[/C][/ROW]
[ROW][C]21[/C][C]-0.042908[/C][C]-0.3615[/C][C]0.359382[/C][/ROW]
[ROW][C]22[/C][C]-0.055971[/C][C]-0.4716[/C][C]0.319322[/C][/ROW]
[ROW][C]23[/C][C]-0.221293[/C][C]-1.8646[/C][C]0.033182[/C][/ROW]
[ROW][C]24[/C][C]-0.032688[/C][C]-0.2754[/C][C]0.391892[/C][/ROW]
[ROW][C]25[/C][C]-0.143478[/C][C]-1.209[/C][C]0.115343[/C][/ROW]
[ROW][C]26[/C][C]-0.078729[/C][C]-0.6634[/C][C]0.254618[/C][/ROW]
[ROW][C]27[/C][C]-0.065784[/C][C]-0.5543[/C][C]0.290555[/C][/ROW]
[ROW][C]28[/C][C]-0.070475[/C][C]-0.5938[/C][C]0.277255[/C][/ROW]
[ROW][C]29[/C][C]-0.136138[/C][C]-1.1471[/C][C]0.127592[/C][/ROW]
[ROW][C]30[/C][C]-0.073552[/C][C]-0.6198[/C][C]0.2687[/C][/ROW]
[ROW][C]31[/C][C]-0.02939[/C][C]-0.2476[/C][C]0.402563[/C][/ROW]
[ROW][C]32[/C][C]-0.034958[/C][C]-0.2946[/C][C]0.384595[/C][/ROW]
[ROW][C]33[/C][C]0.037748[/C][C]0.3181[/C][C]0.375682[/C][/ROW]
[ROW][C]34[/C][C]0.020587[/C][C]0.1735[/C][C]0.431387[/C][/ROW]
[ROW][C]35[/C][C]0.012485[/C][C]0.1052[/C][C]0.458258[/C][/ROW]
[ROW][C]36[/C][C]-0.068157[/C][C]-0.5743[/C][C]0.283789[/C][/ROW]
[ROW][C]37[/C][C]0.03751[/C][C]0.3161[/C][C]0.37644[/C][/ROW]
[ROW][C]38[/C][C]-0.049302[/C][C]-0.4154[/C][C]0.339541[/C][/ROW]
[ROW][C]39[/C][C]-0.054484[/C][C]-0.4591[/C][C]0.323784[/C][/ROW]
[ROW][C]40[/C][C]-0.084974[/C][C]-0.716[/C][C]0.238169[/C][/ROW]
[ROW][C]41[/C][C]-0.020076[/C][C]-0.1692[/C][C]0.433074[/C][/ROW]
[ROW][C]42[/C][C]-0.049462[/C][C]-0.4168[/C][C]0.339051[/C][/ROW]
[ROW][C]43[/C][C]-0.015852[/C][C]-0.1336[/C][C]0.44706[/C][/ROW]
[ROW][C]44[/C][C]-0.073618[/C][C]-0.6203[/C][C]0.268517[/C][/ROW]
[ROW][C]45[/C][C]0.0485[/C][C]0.4087[/C][C]0.342006[/C][/ROW]
[ROW][C]46[/C][C]-0.040217[/C][C]-0.3389[/C][C]0.367851[/C][/ROW]
[ROW][C]47[/C][C]0.04569[/C][C]0.385[/C][C]0.350699[/C][/ROW]
[ROW][C]48[/C][C]-0.168179[/C][C]-1.4171[/C][C]0.080413[/C][/ROW]
[/TABLE]
Source: https://freestatistics.org/blog/index.php?pk=242393&T=2

Globally Unique Identifier (entire table): ba.freestatistics.org/blog/index.php?pk=242393&T=2

As an alternative you can also use a QR Code:  

The GUIDs for individual cells are displayed in the table below:

Partial Autocorrelation Function
Time lag kPACF(k)T-STATP-value
10.3397322.86260.002759
2-0.42697-3.59770.000295
3-0.232244-1.95690.027145
4-0.181339-1.5280.065479
5-0.010501-0.08850.464871
6-0.032815-0.27650.391482
7-0.161408-1.360.089059
8-0.265556-2.23760.014193
9-0.376048-3.16860.00113
10-0.414841-3.49550.00041
11-0.082117-0.69190.245619
120.5734524.8324e-06
13-0.270195-2.27670.01291
140.1039840.87620.191943
150.0902590.76050.224726
160.1103940.93020.177712
17-0.026368-0.22220.412405
18-0.05028-0.42370.336545
19-0.020452-0.17230.431832
20-0.08371-0.70540.241449
21-0.042908-0.36150.359382
22-0.055971-0.47160.319322
23-0.221293-1.86460.033182
24-0.032688-0.27540.391892
25-0.143478-1.2090.115343
26-0.078729-0.66340.254618
27-0.065784-0.55430.290555
28-0.070475-0.59380.277255
29-0.136138-1.14710.127592
30-0.073552-0.61980.2687
31-0.02939-0.24760.402563
32-0.034958-0.29460.384595
330.0377480.31810.375682
340.0205870.17350.431387
350.0124850.10520.458258
36-0.068157-0.57430.283789
370.037510.31610.37644
38-0.049302-0.41540.339541
39-0.054484-0.45910.323784
40-0.084974-0.7160.238169
41-0.020076-0.16920.433074
42-0.049462-0.41680.339051
43-0.015852-0.13360.44706
44-0.073618-0.62030.268517
450.04850.40870.342006
46-0.040217-0.33890.367851
470.045690.3850.350699
48-0.168179-1.41710.080413


Parameters (Session):
par1 = 48 ; par2 = 1 ; par3 = 1 ; par4 = 0 ; par5 = 12 ; par6 = White Noise ; par7 = 0.95 ;
Parameters (R input):
par1 = 48 ; par2 = 1 ; par3 = 1 ; par4 = 0 ; par5 = 12 ; par6 = White Noise ; par7 = 0.95 ; par8 = ;
R code (references can be found in the software module):
par8 <- ''
par7 <- '0.95'
par6 <- 'White Noise'
par5 <- '12'
par4 <- '0'
par3 <- '0'
par2 <- '1'
par1 <- '48'
if (par1 == 'Default') {
par1 = 10*log10(length(x))
} else {
par1 <- as.numeric(par1)
}
par2 <- as.numeric(par2)
par3 <- as.numeric(par3)
par4 <- as.numeric(par4)
par5 <- as.numeric(par5)
if (par6 == 'White Noise') par6 <- 'white' else par6 <- 'ma'
par7 <- as.numeric(par7)
if (par8 != '') par8 <- as.numeric(par8)
ox <- x
if (par8 == '') {
if (par2 == 0) {
x <- log(x)
} else {
x <- (x ^ par2 - 1) / par2
}
} else {
x <- log(x,base=par8)
}
if (par3 > 0) x <- diff(x,lag=1,difference=par3)
if (par4 > 0) x <- diff(x,lag=par5,difference=par4)
bitmap(file='picts.png')
op <- par(mfrow=c(2,1))
plot(ox,type='l',main='Original Time Series',xlab='time',ylab='value')
if (par8=='') {
mytitle <- paste('Working Time Series (lambda=',par2,', d=',par3,', D=',par4,')',sep='')
mysub <- paste('(lambda=',par2,', d=',par3,', D=',par4,', CI=', par7, ', CI type=',par6,')',sep='')
} else {
mytitle <- paste('Working Time Series (base=',par8,', d=',par3,', D=',par4,')',sep='')
mysub <- paste('(base=',par8,', d=',par3,', D=',par4,', CI=', par7, ', CI type=',par6,')',sep='')
}
plot(x,type='l', main=mytitle,xlab='time',ylab='value')
par(op)
dev.off()
bitmap(file='pic1.png')
racf <- acf(x, par1, main='Autocorrelation', xlab='time lag', ylab='ACF', ci.type=par6, ci=par7, sub=mysub)
dev.off()
bitmap(file='pic2.png')
rpacf <- pacf(x,par1,main='Partial Autocorrelation',xlab='lags',ylab='PACF',sub=mysub)
dev.off()
(myacf <- c(racf$acf))
(mypacf <- c(rpacf$acf))
lengthx <- length(x)
sqrtn <- sqrt(lengthx)
load(file='createtable')
a<-table.start()
a<-table.row.start(a)
a<-table.element(a,'Autocorrelation Function',4,TRUE)
a<-table.row.end(a)
a<-table.row.start(a)
a<-table.element(a,'Time lag k',header=TRUE)
a<-table.element(a,hyperlink('basics.htm','ACF(k)','click here for more information about the Autocorrelation Function'),header=TRUE)
a<-table.element(a,'T-STAT',header=TRUE)
a<-table.element(a,'P-value',header=TRUE)
a<-table.row.end(a)
for (i in 2:(par1+1)) {
a<-table.row.start(a)
a<-table.element(a,i-1,header=TRUE)
a<-table.element(a,round(myacf[i],6))
mytstat <- myacf[i]*sqrtn
a<-table.element(a,round(mytstat,4))
a<-table.element(a,round(1-pt(abs(mytstat),lengthx),6))
a<-table.row.end(a)
}
a<-table.end(a)
table.save(a,file='mytable.tab')
a<-table.start()
a<-table.row.start(a)
a<-table.element(a,'Partial Autocorrelation Function',4,TRUE)
a<-table.row.end(a)
a<-table.row.start(a)
a<-table.element(a,'Time lag k',header=TRUE)
a<-table.element(a,hyperlink('basics.htm','PACF(k)','click here for more information about the Partial Autocorrelation Function'),header=TRUE)
a<-table.element(a,'T-STAT',header=TRUE)
a<-table.element(a,'P-value',header=TRUE)
a<-table.row.end(a)
for (i in 1:par1) {
a<-table.row.start(a)
a<-table.element(a,i,header=TRUE)
a<-table.element(a,round(mypacf[i],6))
mytstat <- mypacf[i]*sqrtn
a<-table.element(a,round(mytstat,4))
a<-table.element(a,round(1-pt(abs(mytstat),lengthx),6))
a<-table.row.end(a)
}
a<-table.end(a)
table.save(a,file='mytable1.tab')