Free Statistics

of Irreproducible Research!

Author's title

Author*Unverified author*
R Software Modulerwasp_autocorrelation.wasp
Title produced by software(Partial) Autocorrelation Function
Date of computationThu, 16 Oct 2014 14:45:46 +0100
Cite this page as followsStatistical Computations at FreeStatistics.org, Office for Research Development and Education, URL https://freestatistics.org/blog/index.php?v=date/2014/Oct/16/t1413467177foblsijsnkuhtmu.htm/, Retrieved Sun, 12 May 2024 19:26:45 +0000
Statistical Computations at FreeStatistics.org, Office for Research Development and Education, URL https://freestatistics.org/blog/index.php?pk=242389, Retrieved Sun, 12 May 2024 19:26:45 +0000
QR Codes:

Original text written by user:
IsPrivate?No (this computation is public)
User-defined keywords
Estimated Impact63
Family? (F = Feedback message, R = changed R code, M = changed R Module, P = changed Parameters, D = changed Data)
-       [(Partial) Autocorrelation Function] [] [2014-10-16 13:45:46] [345c72938773a86f996d724d064c8f2d] [Current]
Feedback Forum

Post a new message
Dataseries X:
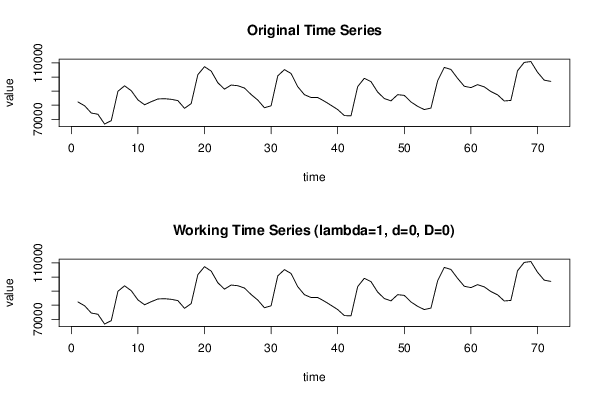
82303
79596
74472
73562
66618
69029
89899
93774
90305
83799
80320
82497
84420
84646
84186
83269
77793
81145
101691
107357
104253
95963
91432
94324
93855
92183
87600
83641
78195
79604
100846
105293
102518
93132
87479
85476
85460
82868
79941
76909
72613
72496
93244
99126
96748
89318
84724
83111
87497
86961
82319
79196
76898
77971
97335
106855
105401
99108
93456
92506
94602
93027
89722
87391
83030
83390
104501
110393
111017
103434
97817
96893


Summary of computational transaction
Raw Inputview raw input (R code)
Raw Outputview raw output of R engine
Computing time1 seconds
R Server'Herman Ole Andreas Wold' @ wold.wessa.net

\begin{tabular}{lllllllll}
\hline
Summary of computational transaction \tabularnewline
Raw Input & view raw input (R code)  \tabularnewline
Raw Output & view raw output of R engine  \tabularnewline
Computing time & 1 seconds \tabularnewline
R Server & 'Herman Ole Andreas Wold' @ wold.wessa.net \tabularnewline
\hline
\end{tabular}
%Source: https://freestatistics.org/blog/index.php?pk=242389&T=0

[TABLE]
[ROW][C]Summary of computational transaction[/C][/ROW]
[ROW][C]Raw Input[/C][C]view raw input (R code) [/C][/ROW]
[ROW][C]Raw Output[/C][C]view raw output of R engine [/C][/ROW]
[ROW][C]Computing time[/C][C]1 seconds[/C][/ROW]
[ROW][C]R Server[/C][C]'Herman Ole Andreas Wold' @ wold.wessa.net[/C][/ROW]
[/TABLE]
Source: https://freestatistics.org/blog/index.php?pk=242389&T=0

Globally Unique Identifier (entire table): ba.freestatistics.org/blog/index.php?pk=242389&T=0

As an alternative you can also use a QR Code:  

The GUIDs for individual cells are displayed in the table below:

Summary of computational transaction
Raw Inputview raw input (R code)
Raw Outputview raw output of R engine
Computing time1 seconds
R Server'Herman Ole Andreas Wold' @ wold.wessa.net


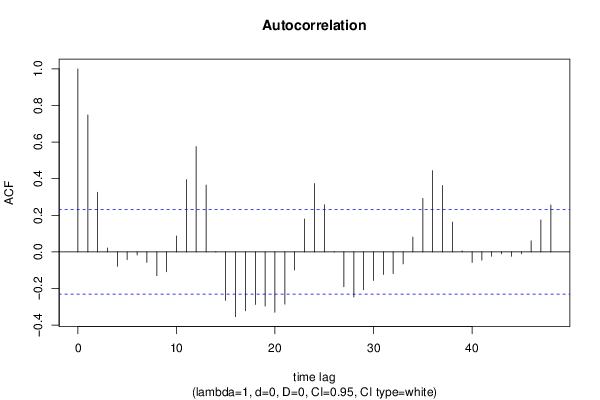
Autocorrelation Function
Time lag kACF(k)T-STATP-value
10.7481096.34790
20.3261762.76770.003586
30.0213140.18090.428493
4-0.078048-0.66230.254959
5-0.042076-0.3570.361057
6-0.01725-0.14640.442018
7-0.0572-0.48540.314449
8-0.129662-1.10020.13745
9-0.108924-0.92430.179221
100.0866030.73490.232408
110.395243.35370.000637
120.5753724.88223e-06
130.3651623.09850.001387
140.0026310.02230.491124
15-0.265126-2.24970.013764
16-0.353907-3.0030.001837
17-0.322153-2.73360.00394
18-0.287391-2.43860.008606
19-0.296214-2.51350.007097
20-0.329527-2.79610.003314
21-0.285628-2.42360.00894
22-0.098912-0.83930.202041
230.1795091.52320.066047
240.3743273.17630.001099
250.257722.18680.016002
260.0013850.01180.495328
27-0.190163-1.61360.055496
28-0.246979-2.09570.019813
29-0.207019-1.75660.041618
30-0.155904-1.32290.09503
31-0.123529-1.04820.149032
32-0.118033-1.00150.159959
33-0.065595-0.55660.289766
340.0808730.68620.247387
350.2921732.47920.007756
360.4445213.77190.000165
370.3625853.07660.00148
380.1628281.38160.085677
390.0055120.04680.481413
40-0.0572-0.48540.314447
41-0.04512-0.38290.351476
42-0.024211-0.20540.418904
43-0.010645-0.09030.464138
44-0.024039-0.2040.419474
45-0.009997-0.08480.466315
460.0601940.51080.305539
470.1741581.47780.071914
480.2561442.17350.016518

\begin{tabular}{lllllllll}
\hline
Autocorrelation Function \tabularnewline
Time lag k & ACF(k) & T-STAT & P-value \tabularnewline
1 & 0.748109 & 6.3479 & 0 \tabularnewline
2 & 0.326176 & 2.7677 & 0.003586 \tabularnewline
3 & 0.021314 & 0.1809 & 0.428493 \tabularnewline
4 & -0.078048 & -0.6623 & 0.254959 \tabularnewline
5 & -0.042076 & -0.357 & 0.361057 \tabularnewline
6 & -0.01725 & -0.1464 & 0.442018 \tabularnewline
7 & -0.0572 & -0.4854 & 0.314449 \tabularnewline
8 & -0.129662 & -1.1002 & 0.13745 \tabularnewline
9 & -0.108924 & -0.9243 & 0.179221 \tabularnewline
10 & 0.086603 & 0.7349 & 0.232408 \tabularnewline
11 & 0.39524 & 3.3537 & 0.000637 \tabularnewline
12 & 0.575372 & 4.8822 & 3e-06 \tabularnewline
13 & 0.365162 & 3.0985 & 0.001387 \tabularnewline
14 & 0.002631 & 0.0223 & 0.491124 \tabularnewline
15 & -0.265126 & -2.2497 & 0.013764 \tabularnewline
16 & -0.353907 & -3.003 & 0.001837 \tabularnewline
17 & -0.322153 & -2.7336 & 0.00394 \tabularnewline
18 & -0.287391 & -2.4386 & 0.008606 \tabularnewline
19 & -0.296214 & -2.5135 & 0.007097 \tabularnewline
20 & -0.329527 & -2.7961 & 0.003314 \tabularnewline
21 & -0.285628 & -2.4236 & 0.00894 \tabularnewline
22 & -0.098912 & -0.8393 & 0.202041 \tabularnewline
23 & 0.179509 & 1.5232 & 0.066047 \tabularnewline
24 & 0.374327 & 3.1763 & 0.001099 \tabularnewline
25 & 0.25772 & 2.1868 & 0.016002 \tabularnewline
26 & 0.001385 & 0.0118 & 0.495328 \tabularnewline
27 & -0.190163 & -1.6136 & 0.055496 \tabularnewline
28 & -0.246979 & -2.0957 & 0.019813 \tabularnewline
29 & -0.207019 & -1.7566 & 0.041618 \tabularnewline
30 & -0.155904 & -1.3229 & 0.09503 \tabularnewline
31 & -0.123529 & -1.0482 & 0.149032 \tabularnewline
32 & -0.118033 & -1.0015 & 0.159959 \tabularnewline
33 & -0.065595 & -0.5566 & 0.289766 \tabularnewline
34 & 0.080873 & 0.6862 & 0.247387 \tabularnewline
35 & 0.292173 & 2.4792 & 0.007756 \tabularnewline
36 & 0.444521 & 3.7719 & 0.000165 \tabularnewline
37 & 0.362585 & 3.0766 & 0.00148 \tabularnewline
38 & 0.162828 & 1.3816 & 0.085677 \tabularnewline
39 & 0.005512 & 0.0468 & 0.481413 \tabularnewline
40 & -0.0572 & -0.4854 & 0.314447 \tabularnewline
41 & -0.04512 & -0.3829 & 0.351476 \tabularnewline
42 & -0.024211 & -0.2054 & 0.418904 \tabularnewline
43 & -0.010645 & -0.0903 & 0.464138 \tabularnewline
44 & -0.024039 & -0.204 & 0.419474 \tabularnewline
45 & -0.009997 & -0.0848 & 0.466315 \tabularnewline
46 & 0.060194 & 0.5108 & 0.305539 \tabularnewline
47 & 0.174158 & 1.4778 & 0.071914 \tabularnewline
48 & 0.256144 & 2.1735 & 0.016518 \tabularnewline
\hline
\end{tabular}
%Source: https://freestatistics.org/blog/index.php?pk=242389&T=1

[TABLE]
[ROW][C]Autocorrelation Function[/C][/ROW]
[ROW][C]Time lag k[/C][C]ACF(k)[/C][C]T-STAT[/C][C]P-value[/C][/ROW]
[ROW][C]1[/C][C]0.748109[/C][C]6.3479[/C][C]0[/C][/ROW]
[ROW][C]2[/C][C]0.326176[/C][C]2.7677[/C][C]0.003586[/C][/ROW]
[ROW][C]3[/C][C]0.021314[/C][C]0.1809[/C][C]0.428493[/C][/ROW]
[ROW][C]4[/C][C]-0.078048[/C][C]-0.6623[/C][C]0.254959[/C][/ROW]
[ROW][C]5[/C][C]-0.042076[/C][C]-0.357[/C][C]0.361057[/C][/ROW]
[ROW][C]6[/C][C]-0.01725[/C][C]-0.1464[/C][C]0.442018[/C][/ROW]
[ROW][C]7[/C][C]-0.0572[/C][C]-0.4854[/C][C]0.314449[/C][/ROW]
[ROW][C]8[/C][C]-0.129662[/C][C]-1.1002[/C][C]0.13745[/C][/ROW]
[ROW][C]9[/C][C]-0.108924[/C][C]-0.9243[/C][C]0.179221[/C][/ROW]
[ROW][C]10[/C][C]0.086603[/C][C]0.7349[/C][C]0.232408[/C][/ROW]
[ROW][C]11[/C][C]0.39524[/C][C]3.3537[/C][C]0.000637[/C][/ROW]
[ROW][C]12[/C][C]0.575372[/C][C]4.8822[/C][C]3e-06[/C][/ROW]
[ROW][C]13[/C][C]0.365162[/C][C]3.0985[/C][C]0.001387[/C][/ROW]
[ROW][C]14[/C][C]0.002631[/C][C]0.0223[/C][C]0.491124[/C][/ROW]
[ROW][C]15[/C][C]-0.265126[/C][C]-2.2497[/C][C]0.013764[/C][/ROW]
[ROW][C]16[/C][C]-0.353907[/C][C]-3.003[/C][C]0.001837[/C][/ROW]
[ROW][C]17[/C][C]-0.322153[/C][C]-2.7336[/C][C]0.00394[/C][/ROW]
[ROW][C]18[/C][C]-0.287391[/C][C]-2.4386[/C][C]0.008606[/C][/ROW]
[ROW][C]19[/C][C]-0.296214[/C][C]-2.5135[/C][C]0.007097[/C][/ROW]
[ROW][C]20[/C][C]-0.329527[/C][C]-2.7961[/C][C]0.003314[/C][/ROW]
[ROW][C]21[/C][C]-0.285628[/C][C]-2.4236[/C][C]0.00894[/C][/ROW]
[ROW][C]22[/C][C]-0.098912[/C][C]-0.8393[/C][C]0.202041[/C][/ROW]
[ROW][C]23[/C][C]0.179509[/C][C]1.5232[/C][C]0.066047[/C][/ROW]
[ROW][C]24[/C][C]0.374327[/C][C]3.1763[/C][C]0.001099[/C][/ROW]
[ROW][C]25[/C][C]0.25772[/C][C]2.1868[/C][C]0.016002[/C][/ROW]
[ROW][C]26[/C][C]0.001385[/C][C]0.0118[/C][C]0.495328[/C][/ROW]
[ROW][C]27[/C][C]-0.190163[/C][C]-1.6136[/C][C]0.055496[/C][/ROW]
[ROW][C]28[/C][C]-0.246979[/C][C]-2.0957[/C][C]0.019813[/C][/ROW]
[ROW][C]29[/C][C]-0.207019[/C][C]-1.7566[/C][C]0.041618[/C][/ROW]
[ROW][C]30[/C][C]-0.155904[/C][C]-1.3229[/C][C]0.09503[/C][/ROW]
[ROW][C]31[/C][C]-0.123529[/C][C]-1.0482[/C][C]0.149032[/C][/ROW]
[ROW][C]32[/C][C]-0.118033[/C][C]-1.0015[/C][C]0.159959[/C][/ROW]
[ROW][C]33[/C][C]-0.065595[/C][C]-0.5566[/C][C]0.289766[/C][/ROW]
[ROW][C]34[/C][C]0.080873[/C][C]0.6862[/C][C]0.247387[/C][/ROW]
[ROW][C]35[/C][C]0.292173[/C][C]2.4792[/C][C]0.007756[/C][/ROW]
[ROW][C]36[/C][C]0.444521[/C][C]3.7719[/C][C]0.000165[/C][/ROW]
[ROW][C]37[/C][C]0.362585[/C][C]3.0766[/C][C]0.00148[/C][/ROW]
[ROW][C]38[/C][C]0.162828[/C][C]1.3816[/C][C]0.085677[/C][/ROW]
[ROW][C]39[/C][C]0.005512[/C][C]0.0468[/C][C]0.481413[/C][/ROW]
[ROW][C]40[/C][C]-0.0572[/C][C]-0.4854[/C][C]0.314447[/C][/ROW]
[ROW][C]41[/C][C]-0.04512[/C][C]-0.3829[/C][C]0.351476[/C][/ROW]
[ROW][C]42[/C][C]-0.024211[/C][C]-0.2054[/C][C]0.418904[/C][/ROW]
[ROW][C]43[/C][C]-0.010645[/C][C]-0.0903[/C][C]0.464138[/C][/ROW]
[ROW][C]44[/C][C]-0.024039[/C][C]-0.204[/C][C]0.419474[/C][/ROW]
[ROW][C]45[/C][C]-0.009997[/C][C]-0.0848[/C][C]0.466315[/C][/ROW]
[ROW][C]46[/C][C]0.060194[/C][C]0.5108[/C][C]0.305539[/C][/ROW]
[ROW][C]47[/C][C]0.174158[/C][C]1.4778[/C][C]0.071914[/C][/ROW]
[ROW][C]48[/C][C]0.256144[/C][C]2.1735[/C][C]0.016518[/C][/ROW]
[/TABLE]
Source: https://freestatistics.org/blog/index.php?pk=242389&T=1

Globally Unique Identifier (entire table): ba.freestatistics.org/blog/index.php?pk=242389&T=1

As an alternative you can also use a QR Code:  

The GUIDs for individual cells are displayed in the table below:

Autocorrelation Function
Time lag kACF(k)T-STATP-value
10.7481096.34790
20.3261762.76770.003586
30.0213140.18090.428493
4-0.078048-0.66230.254959
5-0.042076-0.3570.361057
6-0.01725-0.14640.442018
7-0.0572-0.48540.314449
8-0.129662-1.10020.13745
9-0.108924-0.92430.179221
100.0866030.73490.232408
110.395243.35370.000637
120.5753724.88223e-06
130.3651623.09850.001387
140.0026310.02230.491124
15-0.265126-2.24970.013764
16-0.353907-3.0030.001837
17-0.322153-2.73360.00394
18-0.287391-2.43860.008606
19-0.296214-2.51350.007097
20-0.329527-2.79610.003314
21-0.285628-2.42360.00894
22-0.098912-0.83930.202041
230.1795091.52320.066047
240.3743273.17630.001099
250.257722.18680.016002
260.0013850.01180.495328
27-0.190163-1.61360.055496
28-0.246979-2.09570.019813
29-0.207019-1.75660.041618
30-0.155904-1.32290.09503
31-0.123529-1.04820.149032
32-0.118033-1.00150.159959
33-0.065595-0.55660.289766
340.0808730.68620.247387
350.2921732.47920.007756
360.4445213.77190.000165
370.3625853.07660.00148
380.1628281.38160.085677
390.0055120.04680.481413
40-0.0572-0.48540.314447
41-0.04512-0.38290.351476
42-0.024211-0.20540.418904
43-0.010645-0.09030.464138
44-0.024039-0.2040.419474
45-0.009997-0.08480.466315
460.0601940.51080.305539
470.1741581.47780.071914
480.2561442.17350.016518


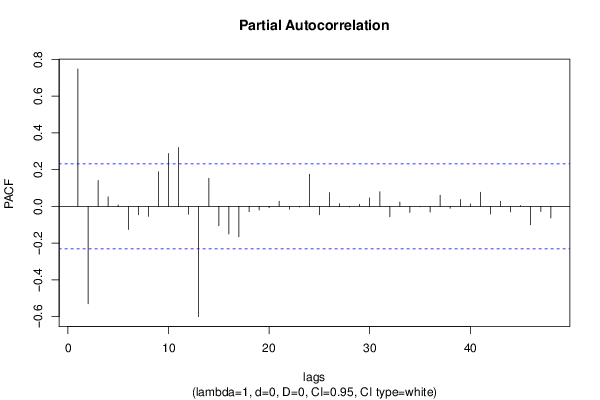
Partial Autocorrelation Function
Time lag kPACF(k)T-STATP-value
10.7481096.34790
2-0.53026-4.49941.3e-05
30.1409061.19560.117883
40.0519580.44090.330311
50.0075810.06430.474444
6-0.125603-1.06580.145042
7-0.045073-0.38250.351626
8-0.054553-0.46290.322416
90.1888531.60250.056715
100.2877942.4420.008531
110.3209182.72310.004055
12-0.042467-0.36030.359823
13-0.600081-5.09191e-06
140.153051.29870.099099
15-0.105216-0.89280.187473
16-0.149985-1.27270.103615
17-0.165056-1.40050.082823
18-0.028502-0.24190.404791
19-0.019427-0.16480.434766
20-0.007789-0.06610.473745
210.0284480.24140.40497
22-0.01475-0.12520.450373
23-0.003383-0.02870.488591
240.1752761.48730.070656
25-0.045301-0.38440.350911
260.0750680.6370.263082
270.0142620.1210.452007
28-0.002839-0.02410.490423
290.0110520.09380.462773
300.0454730.38590.350371
310.0800670.67940.249533
32-0.056005-0.47520.318035
330.0235880.20010.420965
34-0.033234-0.2820.389376
35-0.001688-0.01430.494306
36-0.030731-0.26080.39751
370.060450.51290.304783
38-0.010397-0.08820.464973
390.0373990.31730.375952
400.0131280.11140.455806
410.0770990.65420.25753
42-0.040968-0.34760.364569
430.0281910.23920.40581
44-0.030057-0.2550.399708
450.0050080.04250.483111
46-0.09996-0.84820.199571
47-0.027518-0.23350.40802
48-0.063348-0.53750.296281

\begin{tabular}{lllllllll}
\hline
Partial Autocorrelation Function \tabularnewline
Time lag k & PACF(k) & T-STAT & P-value \tabularnewline
1 & 0.748109 & 6.3479 & 0 \tabularnewline
2 & -0.53026 & -4.4994 & 1.3e-05 \tabularnewline
3 & 0.140906 & 1.1956 & 0.117883 \tabularnewline
4 & 0.051958 & 0.4409 & 0.330311 \tabularnewline
5 & 0.007581 & 0.0643 & 0.474444 \tabularnewline
6 & -0.125603 & -1.0658 & 0.145042 \tabularnewline
7 & -0.045073 & -0.3825 & 0.351626 \tabularnewline
8 & -0.054553 & -0.4629 & 0.322416 \tabularnewline
9 & 0.188853 & 1.6025 & 0.056715 \tabularnewline
10 & 0.287794 & 2.442 & 0.008531 \tabularnewline
11 & 0.320918 & 2.7231 & 0.004055 \tabularnewline
12 & -0.042467 & -0.3603 & 0.359823 \tabularnewline
13 & -0.600081 & -5.0919 & 1e-06 \tabularnewline
14 & 0.15305 & 1.2987 & 0.099099 \tabularnewline
15 & -0.105216 & -0.8928 & 0.187473 \tabularnewline
16 & -0.149985 & -1.2727 & 0.103615 \tabularnewline
17 & -0.165056 & -1.4005 & 0.082823 \tabularnewline
18 & -0.028502 & -0.2419 & 0.404791 \tabularnewline
19 & -0.019427 & -0.1648 & 0.434766 \tabularnewline
20 & -0.007789 & -0.0661 & 0.473745 \tabularnewline
21 & 0.028448 & 0.2414 & 0.40497 \tabularnewline
22 & -0.01475 & -0.1252 & 0.450373 \tabularnewline
23 & -0.003383 & -0.0287 & 0.488591 \tabularnewline
24 & 0.175276 & 1.4873 & 0.070656 \tabularnewline
25 & -0.045301 & -0.3844 & 0.350911 \tabularnewline
26 & 0.075068 & 0.637 & 0.263082 \tabularnewline
27 & 0.014262 & 0.121 & 0.452007 \tabularnewline
28 & -0.002839 & -0.0241 & 0.490423 \tabularnewline
29 & 0.011052 & 0.0938 & 0.462773 \tabularnewline
30 & 0.045473 & 0.3859 & 0.350371 \tabularnewline
31 & 0.080067 & 0.6794 & 0.249533 \tabularnewline
32 & -0.056005 & -0.4752 & 0.318035 \tabularnewline
33 & 0.023588 & 0.2001 & 0.420965 \tabularnewline
34 & -0.033234 & -0.282 & 0.389376 \tabularnewline
35 & -0.001688 & -0.0143 & 0.494306 \tabularnewline
36 & -0.030731 & -0.2608 & 0.39751 \tabularnewline
37 & 0.06045 & 0.5129 & 0.304783 \tabularnewline
38 & -0.010397 & -0.0882 & 0.464973 \tabularnewline
39 & 0.037399 & 0.3173 & 0.375952 \tabularnewline
40 & 0.013128 & 0.1114 & 0.455806 \tabularnewline
41 & 0.077099 & 0.6542 & 0.25753 \tabularnewline
42 & -0.040968 & -0.3476 & 0.364569 \tabularnewline
43 & 0.028191 & 0.2392 & 0.40581 \tabularnewline
44 & -0.030057 & -0.255 & 0.399708 \tabularnewline
45 & 0.005008 & 0.0425 & 0.483111 \tabularnewline
46 & -0.09996 & -0.8482 & 0.199571 \tabularnewline
47 & -0.027518 & -0.2335 & 0.40802 \tabularnewline
48 & -0.063348 & -0.5375 & 0.296281 \tabularnewline
\hline
\end{tabular}
%Source: https://freestatistics.org/blog/index.php?pk=242389&T=2

[TABLE]
[ROW][C]Partial Autocorrelation Function[/C][/ROW]
[ROW][C]Time lag k[/C][C]PACF(k)[/C][C]T-STAT[/C][C]P-value[/C][/ROW]
[ROW][C]1[/C][C]0.748109[/C][C]6.3479[/C][C]0[/C][/ROW]
[ROW][C]2[/C][C]-0.53026[/C][C]-4.4994[/C][C]1.3e-05[/C][/ROW]
[ROW][C]3[/C][C]0.140906[/C][C]1.1956[/C][C]0.117883[/C][/ROW]
[ROW][C]4[/C][C]0.051958[/C][C]0.4409[/C][C]0.330311[/C][/ROW]
[ROW][C]5[/C][C]0.007581[/C][C]0.0643[/C][C]0.474444[/C][/ROW]
[ROW][C]6[/C][C]-0.125603[/C][C]-1.0658[/C][C]0.145042[/C][/ROW]
[ROW][C]7[/C][C]-0.045073[/C][C]-0.3825[/C][C]0.351626[/C][/ROW]
[ROW][C]8[/C][C]-0.054553[/C][C]-0.4629[/C][C]0.322416[/C][/ROW]
[ROW][C]9[/C][C]0.188853[/C][C]1.6025[/C][C]0.056715[/C][/ROW]
[ROW][C]10[/C][C]0.287794[/C][C]2.442[/C][C]0.008531[/C][/ROW]
[ROW][C]11[/C][C]0.320918[/C][C]2.7231[/C][C]0.004055[/C][/ROW]
[ROW][C]12[/C][C]-0.042467[/C][C]-0.3603[/C][C]0.359823[/C][/ROW]
[ROW][C]13[/C][C]-0.600081[/C][C]-5.0919[/C][C]1e-06[/C][/ROW]
[ROW][C]14[/C][C]0.15305[/C][C]1.2987[/C][C]0.099099[/C][/ROW]
[ROW][C]15[/C][C]-0.105216[/C][C]-0.8928[/C][C]0.187473[/C][/ROW]
[ROW][C]16[/C][C]-0.149985[/C][C]-1.2727[/C][C]0.103615[/C][/ROW]
[ROW][C]17[/C][C]-0.165056[/C][C]-1.4005[/C][C]0.082823[/C][/ROW]
[ROW][C]18[/C][C]-0.028502[/C][C]-0.2419[/C][C]0.404791[/C][/ROW]
[ROW][C]19[/C][C]-0.019427[/C][C]-0.1648[/C][C]0.434766[/C][/ROW]
[ROW][C]20[/C][C]-0.007789[/C][C]-0.0661[/C][C]0.473745[/C][/ROW]
[ROW][C]21[/C][C]0.028448[/C][C]0.2414[/C][C]0.40497[/C][/ROW]
[ROW][C]22[/C][C]-0.01475[/C][C]-0.1252[/C][C]0.450373[/C][/ROW]
[ROW][C]23[/C][C]-0.003383[/C][C]-0.0287[/C][C]0.488591[/C][/ROW]
[ROW][C]24[/C][C]0.175276[/C][C]1.4873[/C][C]0.070656[/C][/ROW]
[ROW][C]25[/C][C]-0.045301[/C][C]-0.3844[/C][C]0.350911[/C][/ROW]
[ROW][C]26[/C][C]0.075068[/C][C]0.637[/C][C]0.263082[/C][/ROW]
[ROW][C]27[/C][C]0.014262[/C][C]0.121[/C][C]0.452007[/C][/ROW]
[ROW][C]28[/C][C]-0.002839[/C][C]-0.0241[/C][C]0.490423[/C][/ROW]
[ROW][C]29[/C][C]0.011052[/C][C]0.0938[/C][C]0.462773[/C][/ROW]
[ROW][C]30[/C][C]0.045473[/C][C]0.3859[/C][C]0.350371[/C][/ROW]
[ROW][C]31[/C][C]0.080067[/C][C]0.6794[/C][C]0.249533[/C][/ROW]
[ROW][C]32[/C][C]-0.056005[/C][C]-0.4752[/C][C]0.318035[/C][/ROW]
[ROW][C]33[/C][C]0.023588[/C][C]0.2001[/C][C]0.420965[/C][/ROW]
[ROW][C]34[/C][C]-0.033234[/C][C]-0.282[/C][C]0.389376[/C][/ROW]
[ROW][C]35[/C][C]-0.001688[/C][C]-0.0143[/C][C]0.494306[/C][/ROW]
[ROW][C]36[/C][C]-0.030731[/C][C]-0.2608[/C][C]0.39751[/C][/ROW]
[ROW][C]37[/C][C]0.06045[/C][C]0.5129[/C][C]0.304783[/C][/ROW]
[ROW][C]38[/C][C]-0.010397[/C][C]-0.0882[/C][C]0.464973[/C][/ROW]
[ROW][C]39[/C][C]0.037399[/C][C]0.3173[/C][C]0.375952[/C][/ROW]
[ROW][C]40[/C][C]0.013128[/C][C]0.1114[/C][C]0.455806[/C][/ROW]
[ROW][C]41[/C][C]0.077099[/C][C]0.6542[/C][C]0.25753[/C][/ROW]
[ROW][C]42[/C][C]-0.040968[/C][C]-0.3476[/C][C]0.364569[/C][/ROW]
[ROW][C]43[/C][C]0.028191[/C][C]0.2392[/C][C]0.40581[/C][/ROW]
[ROW][C]44[/C][C]-0.030057[/C][C]-0.255[/C][C]0.399708[/C][/ROW]
[ROW][C]45[/C][C]0.005008[/C][C]0.0425[/C][C]0.483111[/C][/ROW]
[ROW][C]46[/C][C]-0.09996[/C][C]-0.8482[/C][C]0.199571[/C][/ROW]
[ROW][C]47[/C][C]-0.027518[/C][C]-0.2335[/C][C]0.40802[/C][/ROW]
[ROW][C]48[/C][C]-0.063348[/C][C]-0.5375[/C][C]0.296281[/C][/ROW]
[/TABLE]
Source: https://freestatistics.org/blog/index.php?pk=242389&T=2

Globally Unique Identifier (entire table): ba.freestatistics.org/blog/index.php?pk=242389&T=2

As an alternative you can also use a QR Code:  

The GUIDs for individual cells are displayed in the table below:

Partial Autocorrelation Function
Time lag kPACF(k)T-STATP-value
10.7481096.34790
2-0.53026-4.49941.3e-05
30.1409061.19560.117883
40.0519580.44090.330311
50.0075810.06430.474444
6-0.125603-1.06580.145042
7-0.045073-0.38250.351626
8-0.054553-0.46290.322416
90.1888531.60250.056715
100.2877942.4420.008531
110.3209182.72310.004055
12-0.042467-0.36030.359823
13-0.600081-5.09191e-06
140.153051.29870.099099
15-0.105216-0.89280.187473
16-0.149985-1.27270.103615
17-0.165056-1.40050.082823
18-0.028502-0.24190.404791
19-0.019427-0.16480.434766
20-0.007789-0.06610.473745
210.0284480.24140.40497
22-0.01475-0.12520.450373
23-0.003383-0.02870.488591
240.1752761.48730.070656
25-0.045301-0.38440.350911
260.0750680.6370.263082
270.0142620.1210.452007
28-0.002839-0.02410.490423
290.0110520.09380.462773
300.0454730.38590.350371
310.0800670.67940.249533
32-0.056005-0.47520.318035
330.0235880.20010.420965
34-0.033234-0.2820.389376
35-0.001688-0.01430.494306
36-0.030731-0.26080.39751
370.060450.51290.304783
38-0.010397-0.08820.464973
390.0373990.31730.375952
400.0131280.11140.455806
410.0770990.65420.25753
42-0.040968-0.34760.364569
430.0281910.23920.40581
44-0.030057-0.2550.399708
450.0050080.04250.483111
46-0.09996-0.84820.199571
47-0.027518-0.23350.40802
48-0.063348-0.53750.296281


Parameters (Session):
par1 = 48 ; par2 = 1 ; par3 = 0 ; par4 = 0 ; par5 = 12 ; par6 = White Noise ; par7 = 0.95 ;
Parameters (R input):
par1 = 48 ; par2 = 1 ; par3 = 0 ; par4 = 0 ; par5 = 12 ; par6 = White Noise ; par7 = 0.95 ; par8 = ;
R code (references can be found in the software module):
if (par1 == 'Default') {
par1 = 10*log10(length(x))
} else {
par1 <- as.numeric(par1)
}
par2 <- as.numeric(par2)
par3 <- as.numeric(par3)
par4 <- as.numeric(par4)
par5 <- as.numeric(par5)
if (par6 == 'White Noise') par6 <- 'white' else par6 <- 'ma'
par7 <- as.numeric(par7)
if (par8 != '') par8 <- as.numeric(par8)
ox <- x
if (par8 == '') {
if (par2 == 0) {
x <- log(x)
} else {
x <- (x ^ par2 - 1) / par2
}
} else {
x <- log(x,base=par8)
}
if (par3 > 0) x <- diff(x,lag=1,difference=par3)
if (par4 > 0) x <- diff(x,lag=par5,difference=par4)
bitmap(file='picts.png')
op <- par(mfrow=c(2,1))
plot(ox,type='l',main='Original Time Series',xlab='time',ylab='value')
if (par8=='') {
mytitle <- paste('Working Time Series (lambda=',par2,', d=',par3,', D=',par4,')',sep='')
mysub <- paste('(lambda=',par2,', d=',par3,', D=',par4,', CI=', par7, ', CI type=',par6,')',sep='')
} else {
mytitle <- paste('Working Time Series (base=',par8,', d=',par3,', D=',par4,')',sep='')
mysub <- paste('(base=',par8,', d=',par3,', D=',par4,', CI=', par7, ', CI type=',par6,')',sep='')
}
plot(x,type='l', main=mytitle,xlab='time',ylab='value')
par(op)
dev.off()
bitmap(file='pic1.png')
racf <- acf(x, par1, main='Autocorrelation', xlab='time lag', ylab='ACF', ci.type=par6, ci=par7, sub=mysub)
dev.off()
bitmap(file='pic2.png')
rpacf <- pacf(x,par1,main='Partial Autocorrelation',xlab='lags',ylab='PACF',sub=mysub)
dev.off()
(myacf <- c(racf$acf))
(mypacf <- c(rpacf$acf))
lengthx <- length(x)
sqrtn <- sqrt(lengthx)
load(file='createtable')
a<-table.start()
a<-table.row.start(a)
a<-table.element(a,'Autocorrelation Function',4,TRUE)
a<-table.row.end(a)
a<-table.row.start(a)
a<-table.element(a,'Time lag k',header=TRUE)
a<-table.element(a,hyperlink('basics.htm','ACF(k)','click here for more information about the Autocorrelation Function'),header=TRUE)
a<-table.element(a,'T-STAT',header=TRUE)
a<-table.element(a,'P-value',header=TRUE)
a<-table.row.end(a)
for (i in 2:(par1+1)) {
a<-table.row.start(a)
a<-table.element(a,i-1,header=TRUE)
a<-table.element(a,round(myacf[i],6))
mytstat <- myacf[i]*sqrtn
a<-table.element(a,round(mytstat,4))
a<-table.element(a,round(1-pt(abs(mytstat),lengthx),6))
a<-table.row.end(a)
}
a<-table.end(a)
table.save(a,file='mytable.tab')
a<-table.start()
a<-table.row.start(a)
a<-table.element(a,'Partial Autocorrelation Function',4,TRUE)
a<-table.row.end(a)
a<-table.row.start(a)
a<-table.element(a,'Time lag k',header=TRUE)
a<-table.element(a,hyperlink('basics.htm','PACF(k)','click here for more information about the Partial Autocorrelation Function'),header=TRUE)
a<-table.element(a,'T-STAT',header=TRUE)
a<-table.element(a,'P-value',header=TRUE)
a<-table.row.end(a)
for (i in 1:par1) {
a<-table.row.start(a)
a<-table.element(a,i,header=TRUE)
a<-table.element(a,round(mypacf[i],6))
mytstat <- mypacf[i]*sqrtn
a<-table.element(a,round(mytstat,4))
a<-table.element(a,round(1-pt(abs(mytstat),lengthx),6))
a<-table.row.end(a)
}
a<-table.end(a)
table.save(a,file='mytable1.tab')