Free Statistics

of Irreproducible Research!

Author's title

Author*Unverified author*
R Software Modulerwasp_autocorrelation.wasp
Title produced by software(Partial) Autocorrelation Function
Date of computationThu, 16 Oct 2014 14:33:08 +0100
Cite this page as followsStatistical Computations at FreeStatistics.org, Office for Research Development and Education, URL https://freestatistics.org/blog/index.php?v=date/2014/Oct/16/t1413466415vu8rph7zmgfffgp.htm/, Retrieved Mon, 13 May 2024 16:33:24 +0000
Statistical Computations at FreeStatistics.org, Office for Research Development and Education, URL https://freestatistics.org/blog/index.php?pk=242379, Retrieved Mon, 13 May 2024 16:33:24 +0000
QR Codes:

Original text written by user:
IsPrivate?No (this computation is public)
User-defined keywords
Estimated Impact69
Family? (F = Feedback message, R = changed R code, M = changed R Module, P = changed Parameters, D = changed Data)
-     [(Partial) Autocorrelation Function] [] [2014-10-16 13:29:25] [35cf553fdfdc66b14f70b75e31d8fd89]
- R PD    [(Partial) Autocorrelation Function] [] [2014-10-16 13:33:08] [5f87c1f524450f94c6870e724864065e] [Current]
Feedback Forum

Post a new message
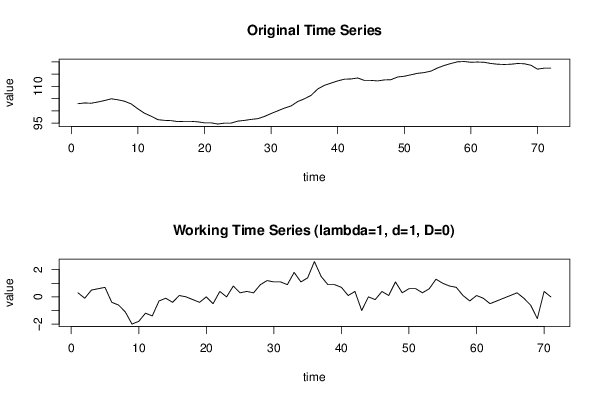
Dataseries X:
102.9
103.2
103.1
103.6
104.2
104.9
104.5
103.9
102.8
100.8
99
97.8
96.4
96.1
96
95.6
95.7
95.7
95.5
95.1
95.1
94.6
95
95
95.8
96.1
96.5
96.8
97.7
98.9
100
101.1
102
103.8
104.9
106.3
108.9
110.4
111.3
112.2
112.9
113
113.4
112.4
112.4
112.2
112.6
112.7
113.8
114.1
114.7
115.3
115.6
116.2
117.5
118.5
119.3
120
120.1
119.8
119.9
119.8
119.3
119
118.9
119
119.3
119.2
118.6
117
117.4
117.4


Summary of computational transaction
Raw Inputview raw input (R code)
Raw Outputview raw output of R engine
Computing time1 seconds
R Server'Sir Ronald Aylmer Fisher' @ fisher.wessa.net

\begin{tabular}{lllllllll}
\hline
Summary of computational transaction \tabularnewline
Raw Input & view raw input (R code)  \tabularnewline
Raw Output & view raw output of R engine  \tabularnewline
Computing time & 1 seconds \tabularnewline
R Server & 'Sir Ronald Aylmer Fisher' @ fisher.wessa.net \tabularnewline
\hline
\end{tabular}
%Source: https://freestatistics.org/blog/index.php?pk=242379&T=0

[TABLE]
[ROW][C]Summary of computational transaction[/C][/ROW]
[ROW][C]Raw Input[/C][C]view raw input (R code) [/C][/ROW]
[ROW][C]Raw Output[/C][C]view raw output of R engine [/C][/ROW]
[ROW][C]Computing time[/C][C]1 seconds[/C][/ROW]
[ROW][C]R Server[/C][C]'Sir Ronald Aylmer Fisher' @ fisher.wessa.net[/C][/ROW]
[/TABLE]
Source: https://freestatistics.org/blog/index.php?pk=242379&T=0

Globally Unique Identifier (entire table): ba.freestatistics.org/blog/index.php?pk=242379&T=0

As an alternative you can also use a QR Code:  

The GUIDs for individual cells are displayed in the table below:

Summary of computational transaction
Raw Inputview raw input (R code)
Raw Outputview raw output of R engine
Computing time1 seconds
R Server'Sir Ronald Aylmer Fisher' @ fisher.wessa.net


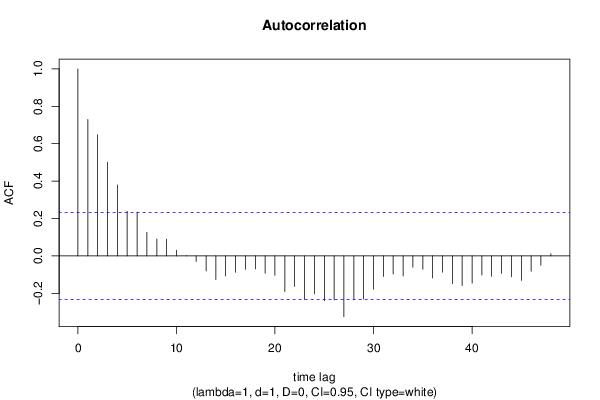
Autocorrelation Function
Time lag kACF(k)T-STATP-value
10.7297426.14890
20.6483375.4630
30.5010074.22163.5e-05
40.3791983.19520.001043
50.2392852.01620.023779
60.2341121.97270.026214
70.1257171.05930.146524
80.090750.76470.223501
90.0892240.75180.227324
100.0300160.25290.400529
110.0016630.0140.49443
12-0.030323-0.25550.399536
13-0.080404-0.67750.250146
14-0.125945-1.06120.146091
15-0.107795-0.90830.183396
16-0.087669-0.73870.231259
17-0.07202-0.60680.272944
18-0.069607-0.58650.279694
19-0.092698-0.78110.218674
20-0.103603-0.8730.192811
21-0.19058-1.60590.056372
22-0.163822-1.38040.085899
23-0.232622-1.96010.026954
24-0.203005-1.71050.045765
25-0.239537-2.01840.023666
26-0.235228-1.98210.025671
27-0.324983-2.73840.0039
28-0.233288-1.96570.026621
29-0.230743-1.94430.027912
30-0.177876-1.49880.069178
31-0.110082-0.92760.178387
32-0.097156-0.81870.207862
33-0.107631-0.90690.183761
34-0.060273-0.50790.306559
35-0.071371-0.60140.274751
36-0.117724-0.9920.162293
37-0.086735-0.73080.23364
38-0.148332-1.24990.107727
39-0.158592-1.33630.092855
40-0.145666-1.22740.111862
41-0.102227-0.86140.195965
42-0.109178-0.91990.180358
43-0.093387-0.78690.216981
44-0.111501-0.93950.175323
45-0.13097-1.10360.136753
46-0.082225-0.69280.245335
47-0.05018-0.42280.33685
480.0114820.09670.461599

\begin{tabular}{lllllllll}
\hline
Autocorrelation Function \tabularnewline
Time lag k & ACF(k) & T-STAT & P-value \tabularnewline
1 & 0.729742 & 6.1489 & 0 \tabularnewline
2 & 0.648337 & 5.463 & 0 \tabularnewline
3 & 0.501007 & 4.2216 & 3.5e-05 \tabularnewline
4 & 0.379198 & 3.1952 & 0.001043 \tabularnewline
5 & 0.239285 & 2.0162 & 0.023779 \tabularnewline
6 & 0.234112 & 1.9727 & 0.026214 \tabularnewline
7 & 0.125717 & 1.0593 & 0.146524 \tabularnewline
8 & 0.09075 & 0.7647 & 0.223501 \tabularnewline
9 & 0.089224 & 0.7518 & 0.227324 \tabularnewline
10 & 0.030016 & 0.2529 & 0.400529 \tabularnewline
11 & 0.001663 & 0.014 & 0.49443 \tabularnewline
12 & -0.030323 & -0.2555 & 0.399536 \tabularnewline
13 & -0.080404 & -0.6775 & 0.250146 \tabularnewline
14 & -0.125945 & -1.0612 & 0.146091 \tabularnewline
15 & -0.107795 & -0.9083 & 0.183396 \tabularnewline
16 & -0.087669 & -0.7387 & 0.231259 \tabularnewline
17 & -0.07202 & -0.6068 & 0.272944 \tabularnewline
18 & -0.069607 & -0.5865 & 0.279694 \tabularnewline
19 & -0.092698 & -0.7811 & 0.218674 \tabularnewline
20 & -0.103603 & -0.873 & 0.192811 \tabularnewline
21 & -0.19058 & -1.6059 & 0.056372 \tabularnewline
22 & -0.163822 & -1.3804 & 0.085899 \tabularnewline
23 & -0.232622 & -1.9601 & 0.026954 \tabularnewline
24 & -0.203005 & -1.7105 & 0.045765 \tabularnewline
25 & -0.239537 & -2.0184 & 0.023666 \tabularnewline
26 & -0.235228 & -1.9821 & 0.025671 \tabularnewline
27 & -0.324983 & -2.7384 & 0.0039 \tabularnewline
28 & -0.233288 & -1.9657 & 0.026621 \tabularnewline
29 & -0.230743 & -1.9443 & 0.027912 \tabularnewline
30 & -0.177876 & -1.4988 & 0.069178 \tabularnewline
31 & -0.110082 & -0.9276 & 0.178387 \tabularnewline
32 & -0.097156 & -0.8187 & 0.207862 \tabularnewline
33 & -0.107631 & -0.9069 & 0.183761 \tabularnewline
34 & -0.060273 & -0.5079 & 0.306559 \tabularnewline
35 & -0.071371 & -0.6014 & 0.274751 \tabularnewline
36 & -0.117724 & -0.992 & 0.162293 \tabularnewline
37 & -0.086735 & -0.7308 & 0.23364 \tabularnewline
38 & -0.148332 & -1.2499 & 0.107727 \tabularnewline
39 & -0.158592 & -1.3363 & 0.092855 \tabularnewline
40 & -0.145666 & -1.2274 & 0.111862 \tabularnewline
41 & -0.102227 & -0.8614 & 0.195965 \tabularnewline
42 & -0.109178 & -0.9199 & 0.180358 \tabularnewline
43 & -0.093387 & -0.7869 & 0.216981 \tabularnewline
44 & -0.111501 & -0.9395 & 0.175323 \tabularnewline
45 & -0.13097 & -1.1036 & 0.136753 \tabularnewline
46 & -0.082225 & -0.6928 & 0.245335 \tabularnewline
47 & -0.05018 & -0.4228 & 0.33685 \tabularnewline
48 & 0.011482 & 0.0967 & 0.461599 \tabularnewline
\hline
\end{tabular}
%Source: https://freestatistics.org/blog/index.php?pk=242379&T=1

[TABLE]
[ROW][C]Autocorrelation Function[/C][/ROW]
[ROW][C]Time lag k[/C][C]ACF(k)[/C][C]T-STAT[/C][C]P-value[/C][/ROW]
[ROW][C]1[/C][C]0.729742[/C][C]6.1489[/C][C]0[/C][/ROW]
[ROW][C]2[/C][C]0.648337[/C][C]5.463[/C][C]0[/C][/ROW]
[ROW][C]3[/C][C]0.501007[/C][C]4.2216[/C][C]3.5e-05[/C][/ROW]
[ROW][C]4[/C][C]0.379198[/C][C]3.1952[/C][C]0.001043[/C][/ROW]
[ROW][C]5[/C][C]0.239285[/C][C]2.0162[/C][C]0.023779[/C][/ROW]
[ROW][C]6[/C][C]0.234112[/C][C]1.9727[/C][C]0.026214[/C][/ROW]
[ROW][C]7[/C][C]0.125717[/C][C]1.0593[/C][C]0.146524[/C][/ROW]
[ROW][C]8[/C][C]0.09075[/C][C]0.7647[/C][C]0.223501[/C][/ROW]
[ROW][C]9[/C][C]0.089224[/C][C]0.7518[/C][C]0.227324[/C][/ROW]
[ROW][C]10[/C][C]0.030016[/C][C]0.2529[/C][C]0.400529[/C][/ROW]
[ROW][C]11[/C][C]0.001663[/C][C]0.014[/C][C]0.49443[/C][/ROW]
[ROW][C]12[/C][C]-0.030323[/C][C]-0.2555[/C][C]0.399536[/C][/ROW]
[ROW][C]13[/C][C]-0.080404[/C][C]-0.6775[/C][C]0.250146[/C][/ROW]
[ROW][C]14[/C][C]-0.125945[/C][C]-1.0612[/C][C]0.146091[/C][/ROW]
[ROW][C]15[/C][C]-0.107795[/C][C]-0.9083[/C][C]0.183396[/C][/ROW]
[ROW][C]16[/C][C]-0.087669[/C][C]-0.7387[/C][C]0.231259[/C][/ROW]
[ROW][C]17[/C][C]-0.07202[/C][C]-0.6068[/C][C]0.272944[/C][/ROW]
[ROW][C]18[/C][C]-0.069607[/C][C]-0.5865[/C][C]0.279694[/C][/ROW]
[ROW][C]19[/C][C]-0.092698[/C][C]-0.7811[/C][C]0.218674[/C][/ROW]
[ROW][C]20[/C][C]-0.103603[/C][C]-0.873[/C][C]0.192811[/C][/ROW]
[ROW][C]21[/C][C]-0.19058[/C][C]-1.6059[/C][C]0.056372[/C][/ROW]
[ROW][C]22[/C][C]-0.163822[/C][C]-1.3804[/C][C]0.085899[/C][/ROW]
[ROW][C]23[/C][C]-0.232622[/C][C]-1.9601[/C][C]0.026954[/C][/ROW]
[ROW][C]24[/C][C]-0.203005[/C][C]-1.7105[/C][C]0.045765[/C][/ROW]
[ROW][C]25[/C][C]-0.239537[/C][C]-2.0184[/C][C]0.023666[/C][/ROW]
[ROW][C]26[/C][C]-0.235228[/C][C]-1.9821[/C][C]0.025671[/C][/ROW]
[ROW][C]27[/C][C]-0.324983[/C][C]-2.7384[/C][C]0.0039[/C][/ROW]
[ROW][C]28[/C][C]-0.233288[/C][C]-1.9657[/C][C]0.026621[/C][/ROW]
[ROW][C]29[/C][C]-0.230743[/C][C]-1.9443[/C][C]0.027912[/C][/ROW]
[ROW][C]30[/C][C]-0.177876[/C][C]-1.4988[/C][C]0.069178[/C][/ROW]
[ROW][C]31[/C][C]-0.110082[/C][C]-0.9276[/C][C]0.178387[/C][/ROW]
[ROW][C]32[/C][C]-0.097156[/C][C]-0.8187[/C][C]0.207862[/C][/ROW]
[ROW][C]33[/C][C]-0.107631[/C][C]-0.9069[/C][C]0.183761[/C][/ROW]
[ROW][C]34[/C][C]-0.060273[/C][C]-0.5079[/C][C]0.306559[/C][/ROW]
[ROW][C]35[/C][C]-0.071371[/C][C]-0.6014[/C][C]0.274751[/C][/ROW]
[ROW][C]36[/C][C]-0.117724[/C][C]-0.992[/C][C]0.162293[/C][/ROW]
[ROW][C]37[/C][C]-0.086735[/C][C]-0.7308[/C][C]0.23364[/C][/ROW]
[ROW][C]38[/C][C]-0.148332[/C][C]-1.2499[/C][C]0.107727[/C][/ROW]
[ROW][C]39[/C][C]-0.158592[/C][C]-1.3363[/C][C]0.092855[/C][/ROW]
[ROW][C]40[/C][C]-0.145666[/C][C]-1.2274[/C][C]0.111862[/C][/ROW]
[ROW][C]41[/C][C]-0.102227[/C][C]-0.8614[/C][C]0.195965[/C][/ROW]
[ROW][C]42[/C][C]-0.109178[/C][C]-0.9199[/C][C]0.180358[/C][/ROW]
[ROW][C]43[/C][C]-0.093387[/C][C]-0.7869[/C][C]0.216981[/C][/ROW]
[ROW][C]44[/C][C]-0.111501[/C][C]-0.9395[/C][C]0.175323[/C][/ROW]
[ROW][C]45[/C][C]-0.13097[/C][C]-1.1036[/C][C]0.136753[/C][/ROW]
[ROW][C]46[/C][C]-0.082225[/C][C]-0.6928[/C][C]0.245335[/C][/ROW]
[ROW][C]47[/C][C]-0.05018[/C][C]-0.4228[/C][C]0.33685[/C][/ROW]
[ROW][C]48[/C][C]0.011482[/C][C]0.0967[/C][C]0.461599[/C][/ROW]
[/TABLE]
Source: https://freestatistics.org/blog/index.php?pk=242379&T=1

Globally Unique Identifier (entire table): ba.freestatistics.org/blog/index.php?pk=242379&T=1

As an alternative you can also use a QR Code:  

The GUIDs for individual cells are displayed in the table below:

Autocorrelation Function
Time lag kACF(k)T-STATP-value
10.7297426.14890
20.6483375.4630
30.5010074.22163.5e-05
40.3791983.19520.001043
50.2392852.01620.023779
60.2341121.97270.026214
70.1257171.05930.146524
80.090750.76470.223501
90.0892240.75180.227324
100.0300160.25290.400529
110.0016630.0140.49443
12-0.030323-0.25550.399536
13-0.080404-0.67750.250146
14-0.125945-1.06120.146091
15-0.107795-0.90830.183396
16-0.087669-0.73870.231259
17-0.07202-0.60680.272944
18-0.069607-0.58650.279694
19-0.092698-0.78110.218674
20-0.103603-0.8730.192811
21-0.19058-1.60590.056372
22-0.163822-1.38040.085899
23-0.232622-1.96010.026954
24-0.203005-1.71050.045765
25-0.239537-2.01840.023666
26-0.235228-1.98210.025671
27-0.324983-2.73840.0039
28-0.233288-1.96570.026621
29-0.230743-1.94430.027912
30-0.177876-1.49880.069178
31-0.110082-0.92760.178387
32-0.097156-0.81870.207862
33-0.107631-0.90690.183761
34-0.060273-0.50790.306559
35-0.071371-0.60140.274751
36-0.117724-0.9920.162293
37-0.086735-0.73080.23364
38-0.148332-1.24990.107727
39-0.158592-1.33630.092855
40-0.145666-1.22740.111862
41-0.102227-0.86140.195965
42-0.109178-0.91990.180358
43-0.093387-0.78690.216981
44-0.111501-0.93950.175323
45-0.13097-1.10360.136753
46-0.082225-0.69280.245335
47-0.05018-0.42280.33685
480.0114820.09670.461599


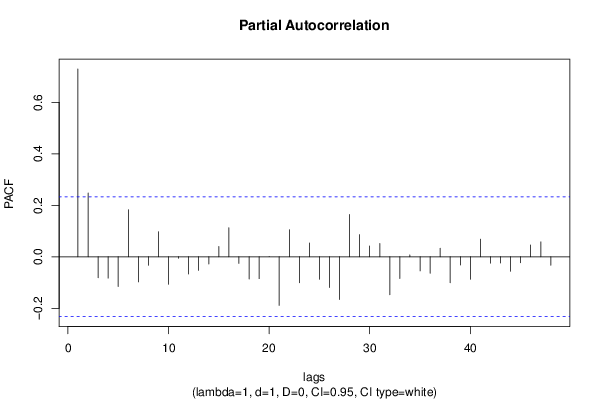
Partial Autocorrelation Function
Time lag kPACF(k)T-STATP-value
10.7297426.14890
20.2477432.08750.020215
3-0.081335-0.68530.247679
4-0.082916-0.69870.243521
5-0.115392-0.97230.167098
60.1825211.53790.064253
7-0.097655-0.82290.206673
8-0.032953-0.27770.391038
90.0971370.81850.207908
10-0.106487-0.89730.186303
11-0.00544-0.04580.481785
12-0.067256-0.56670.286349
13-0.052822-0.44510.328805
14-0.027835-0.23450.407618
150.0399310.33650.368758
160.1129630.95180.172203
17-0.02581-0.21750.414229
18-0.086094-0.72540.235283
19-0.084998-0.71620.238106
200.0002580.00220.499137
21-0.188952-1.59210.057898
220.1050170.88490.189601
23-0.100989-0.8510.198828
240.05370.45250.326151
25-0.087301-0.73560.232195
26-0.119391-1.0060.158914
27-0.165893-1.39780.083257
280.1642231.38380.085382
290.0860690.72520.235348
300.0421080.35480.361893
310.0515210.43410.332758
32-0.147865-1.24590.108442
33-0.08417-0.70920.240251
340.0073160.06160.475508
35-0.054764-0.46150.322942
36-0.063893-0.53840.296004
370.0329760.27790.390962
38-0.101225-0.85290.198281
39-0.032103-0.27050.393779
40-0.08704-0.73340.23286
410.0684860.57710.282857
42-0.024703-0.20820.417854
43-0.024319-0.20490.419112
44-0.056091-0.47260.318963
45-0.023252-0.19590.422615
460.0460630.38810.34954
470.0579830.48860.313324
48-0.032736-0.27580.391736

\begin{tabular}{lllllllll}
\hline
Partial Autocorrelation Function \tabularnewline
Time lag k & PACF(k) & T-STAT & P-value \tabularnewline
1 & 0.729742 & 6.1489 & 0 \tabularnewline
2 & 0.247743 & 2.0875 & 0.020215 \tabularnewline
3 & -0.081335 & -0.6853 & 0.247679 \tabularnewline
4 & -0.082916 & -0.6987 & 0.243521 \tabularnewline
5 & -0.115392 & -0.9723 & 0.167098 \tabularnewline
6 & 0.182521 & 1.5379 & 0.064253 \tabularnewline
7 & -0.097655 & -0.8229 & 0.206673 \tabularnewline
8 & -0.032953 & -0.2777 & 0.391038 \tabularnewline
9 & 0.097137 & 0.8185 & 0.207908 \tabularnewline
10 & -0.106487 & -0.8973 & 0.186303 \tabularnewline
11 & -0.00544 & -0.0458 & 0.481785 \tabularnewline
12 & -0.067256 & -0.5667 & 0.286349 \tabularnewline
13 & -0.052822 & -0.4451 & 0.328805 \tabularnewline
14 & -0.027835 & -0.2345 & 0.407618 \tabularnewline
15 & 0.039931 & 0.3365 & 0.368758 \tabularnewline
16 & 0.112963 & 0.9518 & 0.172203 \tabularnewline
17 & -0.02581 & -0.2175 & 0.414229 \tabularnewline
18 & -0.086094 & -0.7254 & 0.235283 \tabularnewline
19 & -0.084998 & -0.7162 & 0.238106 \tabularnewline
20 & 0.000258 & 0.0022 & 0.499137 \tabularnewline
21 & -0.188952 & -1.5921 & 0.057898 \tabularnewline
22 & 0.105017 & 0.8849 & 0.189601 \tabularnewline
23 & -0.100989 & -0.851 & 0.198828 \tabularnewline
24 & 0.0537 & 0.4525 & 0.326151 \tabularnewline
25 & -0.087301 & -0.7356 & 0.232195 \tabularnewline
26 & -0.119391 & -1.006 & 0.158914 \tabularnewline
27 & -0.165893 & -1.3978 & 0.083257 \tabularnewline
28 & 0.164223 & 1.3838 & 0.085382 \tabularnewline
29 & 0.086069 & 0.7252 & 0.235348 \tabularnewline
30 & 0.042108 & 0.3548 & 0.361893 \tabularnewline
31 & 0.051521 & 0.4341 & 0.332758 \tabularnewline
32 & -0.147865 & -1.2459 & 0.108442 \tabularnewline
33 & -0.08417 & -0.7092 & 0.240251 \tabularnewline
34 & 0.007316 & 0.0616 & 0.475508 \tabularnewline
35 & -0.054764 & -0.4615 & 0.322942 \tabularnewline
36 & -0.063893 & -0.5384 & 0.296004 \tabularnewline
37 & 0.032976 & 0.2779 & 0.390962 \tabularnewline
38 & -0.101225 & -0.8529 & 0.198281 \tabularnewline
39 & -0.032103 & -0.2705 & 0.393779 \tabularnewline
40 & -0.08704 & -0.7334 & 0.23286 \tabularnewline
41 & 0.068486 & 0.5771 & 0.282857 \tabularnewline
42 & -0.024703 & -0.2082 & 0.417854 \tabularnewline
43 & -0.024319 & -0.2049 & 0.419112 \tabularnewline
44 & -0.056091 & -0.4726 & 0.318963 \tabularnewline
45 & -0.023252 & -0.1959 & 0.422615 \tabularnewline
46 & 0.046063 & 0.3881 & 0.34954 \tabularnewline
47 & 0.057983 & 0.4886 & 0.313324 \tabularnewline
48 & -0.032736 & -0.2758 & 0.391736 \tabularnewline
\hline
\end{tabular}
%Source: https://freestatistics.org/blog/index.php?pk=242379&T=2

[TABLE]
[ROW][C]Partial Autocorrelation Function[/C][/ROW]
[ROW][C]Time lag k[/C][C]PACF(k)[/C][C]T-STAT[/C][C]P-value[/C][/ROW]
[ROW][C]1[/C][C]0.729742[/C][C]6.1489[/C][C]0[/C][/ROW]
[ROW][C]2[/C][C]0.247743[/C][C]2.0875[/C][C]0.020215[/C][/ROW]
[ROW][C]3[/C][C]-0.081335[/C][C]-0.6853[/C][C]0.247679[/C][/ROW]
[ROW][C]4[/C][C]-0.082916[/C][C]-0.6987[/C][C]0.243521[/C][/ROW]
[ROW][C]5[/C][C]-0.115392[/C][C]-0.9723[/C][C]0.167098[/C][/ROW]
[ROW][C]6[/C][C]0.182521[/C][C]1.5379[/C][C]0.064253[/C][/ROW]
[ROW][C]7[/C][C]-0.097655[/C][C]-0.8229[/C][C]0.206673[/C][/ROW]
[ROW][C]8[/C][C]-0.032953[/C][C]-0.2777[/C][C]0.391038[/C][/ROW]
[ROW][C]9[/C][C]0.097137[/C][C]0.8185[/C][C]0.207908[/C][/ROW]
[ROW][C]10[/C][C]-0.106487[/C][C]-0.8973[/C][C]0.186303[/C][/ROW]
[ROW][C]11[/C][C]-0.00544[/C][C]-0.0458[/C][C]0.481785[/C][/ROW]
[ROW][C]12[/C][C]-0.067256[/C][C]-0.5667[/C][C]0.286349[/C][/ROW]
[ROW][C]13[/C][C]-0.052822[/C][C]-0.4451[/C][C]0.328805[/C][/ROW]
[ROW][C]14[/C][C]-0.027835[/C][C]-0.2345[/C][C]0.407618[/C][/ROW]
[ROW][C]15[/C][C]0.039931[/C][C]0.3365[/C][C]0.368758[/C][/ROW]
[ROW][C]16[/C][C]0.112963[/C][C]0.9518[/C][C]0.172203[/C][/ROW]
[ROW][C]17[/C][C]-0.02581[/C][C]-0.2175[/C][C]0.414229[/C][/ROW]
[ROW][C]18[/C][C]-0.086094[/C][C]-0.7254[/C][C]0.235283[/C][/ROW]
[ROW][C]19[/C][C]-0.084998[/C][C]-0.7162[/C][C]0.238106[/C][/ROW]
[ROW][C]20[/C][C]0.000258[/C][C]0.0022[/C][C]0.499137[/C][/ROW]
[ROW][C]21[/C][C]-0.188952[/C][C]-1.5921[/C][C]0.057898[/C][/ROW]
[ROW][C]22[/C][C]0.105017[/C][C]0.8849[/C][C]0.189601[/C][/ROW]
[ROW][C]23[/C][C]-0.100989[/C][C]-0.851[/C][C]0.198828[/C][/ROW]
[ROW][C]24[/C][C]0.0537[/C][C]0.4525[/C][C]0.326151[/C][/ROW]
[ROW][C]25[/C][C]-0.087301[/C][C]-0.7356[/C][C]0.232195[/C][/ROW]
[ROW][C]26[/C][C]-0.119391[/C][C]-1.006[/C][C]0.158914[/C][/ROW]
[ROW][C]27[/C][C]-0.165893[/C][C]-1.3978[/C][C]0.083257[/C][/ROW]
[ROW][C]28[/C][C]0.164223[/C][C]1.3838[/C][C]0.085382[/C][/ROW]
[ROW][C]29[/C][C]0.086069[/C][C]0.7252[/C][C]0.235348[/C][/ROW]
[ROW][C]30[/C][C]0.042108[/C][C]0.3548[/C][C]0.361893[/C][/ROW]
[ROW][C]31[/C][C]0.051521[/C][C]0.4341[/C][C]0.332758[/C][/ROW]
[ROW][C]32[/C][C]-0.147865[/C][C]-1.2459[/C][C]0.108442[/C][/ROW]
[ROW][C]33[/C][C]-0.08417[/C][C]-0.7092[/C][C]0.240251[/C][/ROW]
[ROW][C]34[/C][C]0.007316[/C][C]0.0616[/C][C]0.475508[/C][/ROW]
[ROW][C]35[/C][C]-0.054764[/C][C]-0.4615[/C][C]0.322942[/C][/ROW]
[ROW][C]36[/C][C]-0.063893[/C][C]-0.5384[/C][C]0.296004[/C][/ROW]
[ROW][C]37[/C][C]0.032976[/C][C]0.2779[/C][C]0.390962[/C][/ROW]
[ROW][C]38[/C][C]-0.101225[/C][C]-0.8529[/C][C]0.198281[/C][/ROW]
[ROW][C]39[/C][C]-0.032103[/C][C]-0.2705[/C][C]0.393779[/C][/ROW]
[ROW][C]40[/C][C]-0.08704[/C][C]-0.7334[/C][C]0.23286[/C][/ROW]
[ROW][C]41[/C][C]0.068486[/C][C]0.5771[/C][C]0.282857[/C][/ROW]
[ROW][C]42[/C][C]-0.024703[/C][C]-0.2082[/C][C]0.417854[/C][/ROW]
[ROW][C]43[/C][C]-0.024319[/C][C]-0.2049[/C][C]0.419112[/C][/ROW]
[ROW][C]44[/C][C]-0.056091[/C][C]-0.4726[/C][C]0.318963[/C][/ROW]
[ROW][C]45[/C][C]-0.023252[/C][C]-0.1959[/C][C]0.422615[/C][/ROW]
[ROW][C]46[/C][C]0.046063[/C][C]0.3881[/C][C]0.34954[/C][/ROW]
[ROW][C]47[/C][C]0.057983[/C][C]0.4886[/C][C]0.313324[/C][/ROW]
[ROW][C]48[/C][C]-0.032736[/C][C]-0.2758[/C][C]0.391736[/C][/ROW]
[/TABLE]
Source: https://freestatistics.org/blog/index.php?pk=242379&T=2

Globally Unique Identifier (entire table): ba.freestatistics.org/blog/index.php?pk=242379&T=2

As an alternative you can also use a QR Code:  

The GUIDs for individual cells are displayed in the table below:

Partial Autocorrelation Function
Time lag kPACF(k)T-STATP-value
10.7297426.14890
20.2477432.08750.020215
3-0.081335-0.68530.247679
4-0.082916-0.69870.243521
5-0.115392-0.97230.167098
60.1825211.53790.064253
7-0.097655-0.82290.206673
8-0.032953-0.27770.391038
90.0971370.81850.207908
10-0.106487-0.89730.186303
11-0.00544-0.04580.481785
12-0.067256-0.56670.286349
13-0.052822-0.44510.328805
14-0.027835-0.23450.407618
150.0399310.33650.368758
160.1129630.95180.172203
17-0.02581-0.21750.414229
18-0.086094-0.72540.235283
19-0.084998-0.71620.238106
200.0002580.00220.499137
21-0.188952-1.59210.057898
220.1050170.88490.189601
23-0.100989-0.8510.198828
240.05370.45250.326151
25-0.087301-0.73560.232195
26-0.119391-1.0060.158914
27-0.165893-1.39780.083257
280.1642231.38380.085382
290.0860690.72520.235348
300.0421080.35480.361893
310.0515210.43410.332758
32-0.147865-1.24590.108442
33-0.08417-0.70920.240251
340.0073160.06160.475508
35-0.054764-0.46150.322942
36-0.063893-0.53840.296004
370.0329760.27790.390962
38-0.101225-0.85290.198281
39-0.032103-0.27050.393779
40-0.08704-0.73340.23286
410.0684860.57710.282857
42-0.024703-0.20820.417854
43-0.024319-0.20490.419112
44-0.056091-0.47260.318963
45-0.023252-0.19590.422615
460.0460630.38810.34954
470.0579830.48860.313324
48-0.032736-0.27580.391736


Parameters (Session):
par1 = 48 ; par2 = 1 ; par3 = 1 ; par4 = 0 ; par5 = 12 ; par6 = White Noise ; par7 = 0.95 ;
Parameters (R input):
par1 = 48 ; par2 = 1 ; par3 = 1 ; par4 = 0 ; par5 = 12 ; par6 = White Noise ; par7 = 0.95 ; par8 = ;
R code (references can be found in the software module):
if (par1 == 'Default') {
par1 = 10*log10(length(x))
} else {
par1 <- as.numeric(par1)
}
par2 <- as.numeric(par2)
par3 <- as.numeric(par3)
par4 <- as.numeric(par4)
par5 <- as.numeric(par5)
if (par6 == 'White Noise') par6 <- 'white' else par6 <- 'ma'
par7 <- as.numeric(par7)
if (par8 != '') par8 <- as.numeric(par8)
ox <- x
if (par8 == '') {
if (par2 == 0) {
x <- log(x)
} else {
x <- (x ^ par2 - 1) / par2
}
} else {
x <- log(x,base=par8)
}
if (par3 > 0) x <- diff(x,lag=1,difference=par3)
if (par4 > 0) x <- diff(x,lag=par5,difference=par4)
bitmap(file='picts.png')
op <- par(mfrow=c(2,1))
plot(ox,type='l',main='Original Time Series',xlab='time',ylab='value')
if (par8=='') {
mytitle <- paste('Working Time Series (lambda=',par2,', d=',par3,', D=',par4,')',sep='')
mysub <- paste('(lambda=',par2,', d=',par3,', D=',par4,', CI=', par7, ', CI type=',par6,')',sep='')
} else {
mytitle <- paste('Working Time Series (base=',par8,', d=',par3,', D=',par4,')',sep='')
mysub <- paste('(base=',par8,', d=',par3,', D=',par4,', CI=', par7, ', CI type=',par6,')',sep='')
}
plot(x,type='l', main=mytitle,xlab='time',ylab='value')
par(op)
dev.off()
bitmap(file='pic1.png')
racf <- acf(x, par1, main='Autocorrelation', xlab='time lag', ylab='ACF', ci.type=par6, ci=par7, sub=mysub)
dev.off()
bitmap(file='pic2.png')
rpacf <- pacf(x,par1,main='Partial Autocorrelation',xlab='lags',ylab='PACF',sub=mysub)
dev.off()
(myacf <- c(racf$acf))
(mypacf <- c(rpacf$acf))
lengthx <- length(x)
sqrtn <- sqrt(lengthx)
load(file='createtable')
a<-table.start()
a<-table.row.start(a)
a<-table.element(a,'Autocorrelation Function',4,TRUE)
a<-table.row.end(a)
a<-table.row.start(a)
a<-table.element(a,'Time lag k',header=TRUE)
a<-table.element(a,hyperlink('basics.htm','ACF(k)','click here for more information about the Autocorrelation Function'),header=TRUE)
a<-table.element(a,'T-STAT',header=TRUE)
a<-table.element(a,'P-value',header=TRUE)
a<-table.row.end(a)
for (i in 2:(par1+1)) {
a<-table.row.start(a)
a<-table.element(a,i-1,header=TRUE)
a<-table.element(a,round(myacf[i],6))
mytstat <- myacf[i]*sqrtn
a<-table.element(a,round(mytstat,4))
a<-table.element(a,round(1-pt(abs(mytstat),lengthx),6))
a<-table.row.end(a)
}
a<-table.end(a)
table.save(a,file='mytable.tab')
a<-table.start()
a<-table.row.start(a)
a<-table.element(a,'Partial Autocorrelation Function',4,TRUE)
a<-table.row.end(a)
a<-table.row.start(a)
a<-table.element(a,'Time lag k',header=TRUE)
a<-table.element(a,hyperlink('basics.htm','PACF(k)','click here for more information about the Partial Autocorrelation Function'),header=TRUE)
a<-table.element(a,'T-STAT',header=TRUE)
a<-table.element(a,'P-value',header=TRUE)
a<-table.row.end(a)
for (i in 1:par1) {
a<-table.row.start(a)
a<-table.element(a,i,header=TRUE)
a<-table.element(a,round(mypacf[i],6))
mytstat <- mypacf[i]*sqrtn
a<-table.element(a,round(mytstat,4))
a<-table.element(a,round(1-pt(abs(mytstat),lengthx),6))
a<-table.row.end(a)
}
a<-table.end(a)
table.save(a,file='mytable1.tab')