Free Statistics

of Irreproducible Research!

Author's title

Author*Unverified author*
R Software Modulerwasp_autocorrelation.wasp
Title produced by software(Partial) Autocorrelation Function
Date of computationThu, 16 Oct 2014 14:29:25 +0100
Cite this page as followsStatistical Computations at FreeStatistics.org, Office for Research Development and Education, URL https://freestatistics.org/blog/index.php?v=date/2014/Oct/16/t141346619382cqgsj2u4xcvbn.htm/, Retrieved Sun, 12 May 2024 15:04:09 +0000
Statistical Computations at FreeStatistics.org, Office for Research Development and Education, URL https://freestatistics.org/blog/index.php?pk=242373, Retrieved Sun, 12 May 2024 15:04:09 +0000
QR Codes:

Original text written by user:
IsPrivate?No (this computation is public)
User-defined keywords
Estimated Impact70
Family? (F = Feedback message, R = changed R code, M = changed R Module, P = changed Parameters, D = changed Data)
-       [(Partial) Autocorrelation Function] [] [2014-10-16 13:29:25] [5f87c1f524450f94c6870e724864065e] [Current]
- R PD    [(Partial) Autocorrelation Function] [] [2014-10-16 13:33:08] [35cf553fdfdc66b14f70b75e31d8fd89]
Feedback Forum

Post a new message
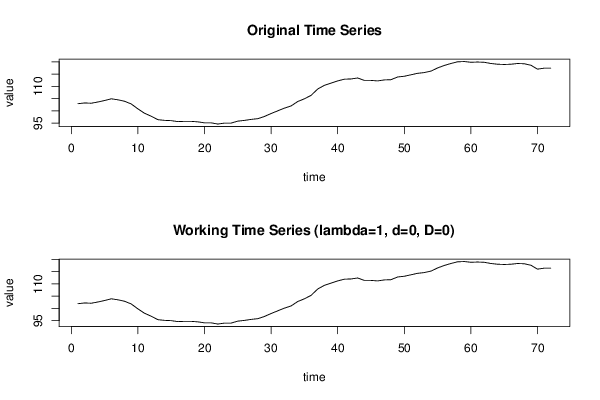
Dataseries X:
102,9
103,2
103,1
103,6
104,2
104,9
104,5
103,9
102,8
100,8
99
97,8
96,4
96,1
96
95,6
95,7
95,7
95,5
95,1
95,1
94,6
95
95
95,8
96,1
96,5
96,8
97,7
98,9
100
101,1
102
103,8
104,9
106,3
108,9
110,4
111,3
112,2
112,9
113
113,4
112,4
112,4
112,2
112,6
112,7
113,8
114,1
114,7
115,3
115,6
116,2
117,5
118,5
119,3
120
120,1
119,8
119,9
119,8
119,3
119
118,9
119
119,3
119,2
118,6
117
117,4
117,4


Summary of computational transaction
Raw Inputview raw input (R code)
Raw Outputview raw output of R engine
Computing time1 seconds
R Server'Sir Ronald Aylmer Fisher' @ fisher.wessa.net

\begin{tabular}{lllllllll}
\hline
Summary of computational transaction \tabularnewline
Raw Input & view raw input (R code)  \tabularnewline
Raw Output & view raw output of R engine  \tabularnewline
Computing time & 1 seconds \tabularnewline
R Server & 'Sir Ronald Aylmer Fisher' @ fisher.wessa.net \tabularnewline
\hline
\end{tabular}
%Source: https://freestatistics.org/blog/index.php?pk=242373&T=0

[TABLE]
[ROW][C]Summary of computational transaction[/C][/ROW]
[ROW][C]Raw Input[/C][C]view raw input (R code) [/C][/ROW]
[ROW][C]Raw Output[/C][C]view raw output of R engine [/C][/ROW]
[ROW][C]Computing time[/C][C]1 seconds[/C][/ROW]
[ROW][C]R Server[/C][C]'Sir Ronald Aylmer Fisher' @ fisher.wessa.net[/C][/ROW]
[/TABLE]
Source: https://freestatistics.org/blog/index.php?pk=242373&T=0

Globally Unique Identifier (entire table): ba.freestatistics.org/blog/index.php?pk=242373&T=0

As an alternative you can also use a QR Code:  

The GUIDs for individual cells are displayed in the table below:

Summary of computational transaction
Raw Inputview raw input (R code)
Raw Outputview raw output of R engine
Computing time1 seconds
R Server'Sir Ronald Aylmer Fisher' @ fisher.wessa.net


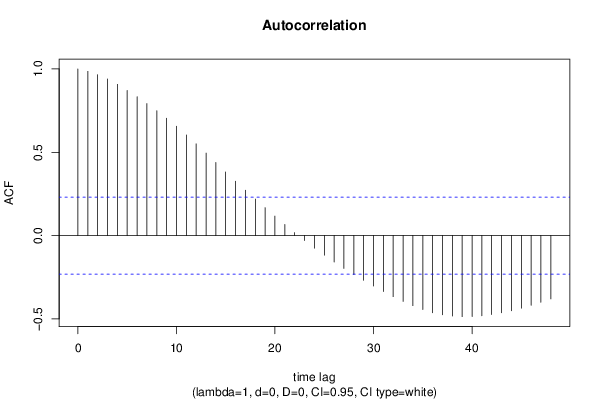
Autocorrelation Function
Time lag kACF(k)T-STATP-value
10.9857038.3640
20.9653138.1910
30.9398277.97470
40.9075327.70070
50.871147.39190
60.8326997.06570
70.7920136.72050
80.749436.35910
90.7044415.97740
100.6559095.56560
110.6040485.12551e-06
120.5501864.66857e-06
130.4946974.19763.8e-05
140.4381783.71810.000197
150.3818153.23980.000906
160.3262212.76810.003582
170.2718332.30660.011979
180.2188051.85660.033728
190.1674871.42120.079792
200.1167350.99050.162617
210.0664630.5640.287267
220.0174590.14810.441322
23-0.029735-0.25230.40076
24-0.075389-0.63970.262199
25-0.1177-0.99870.160637
26-0.15844-1.34440.091518
27-0.197042-1.6720.049436
28-0.233873-1.98450.025507
29-0.268821-2.2810.012754
30-0.303331-2.57380.006058
31-0.335527-2.8470.002873
32-0.366418-3.10920.001344
33-0.395221-3.35360.000637
34-0.420702-3.56980.00032
35-0.443744-3.76530.000168
36-0.462922-3.9289.7e-05
37-0.474887-4.02966.9e-05
38-0.482683-4.09575.4e-05
39-0.48674-4.13014.8e-05
40-0.485723-4.12155e-05
41-0.481349-4.08445.7e-05
42-0.474083-4.02277e-05
43-0.463581-3.93369.5e-05
44-0.450938-3.82630.000137
45-0.435674-3.69680.000211
46-0.418798-3.55360.000338
47-0.400026-3.39430.000561
48-0.380018-3.22460.000949

\begin{tabular}{lllllllll}
\hline
Autocorrelation Function \tabularnewline
Time lag k & ACF(k) & T-STAT & P-value \tabularnewline
1 & 0.985703 & 8.364 & 0 \tabularnewline
2 & 0.965313 & 8.191 & 0 \tabularnewline
3 & 0.939827 & 7.9747 & 0 \tabularnewline
4 & 0.907532 & 7.7007 & 0 \tabularnewline
5 & 0.87114 & 7.3919 & 0 \tabularnewline
6 & 0.832699 & 7.0657 & 0 \tabularnewline
7 & 0.792013 & 6.7205 & 0 \tabularnewline
8 & 0.74943 & 6.3591 & 0 \tabularnewline
9 & 0.704441 & 5.9774 & 0 \tabularnewline
10 & 0.655909 & 5.5656 & 0 \tabularnewline
11 & 0.604048 & 5.1255 & 1e-06 \tabularnewline
12 & 0.550186 & 4.6685 & 7e-06 \tabularnewline
13 & 0.494697 & 4.1976 & 3.8e-05 \tabularnewline
14 & 0.438178 & 3.7181 & 0.000197 \tabularnewline
15 & 0.381815 & 3.2398 & 0.000906 \tabularnewline
16 & 0.326221 & 2.7681 & 0.003582 \tabularnewline
17 & 0.271833 & 2.3066 & 0.011979 \tabularnewline
18 & 0.218805 & 1.8566 & 0.033728 \tabularnewline
19 & 0.167487 & 1.4212 & 0.079792 \tabularnewline
20 & 0.116735 & 0.9905 & 0.162617 \tabularnewline
21 & 0.066463 & 0.564 & 0.287267 \tabularnewline
22 & 0.017459 & 0.1481 & 0.441322 \tabularnewline
23 & -0.029735 & -0.2523 & 0.40076 \tabularnewline
24 & -0.075389 & -0.6397 & 0.262199 \tabularnewline
25 & -0.1177 & -0.9987 & 0.160637 \tabularnewline
26 & -0.15844 & -1.3444 & 0.091518 \tabularnewline
27 & -0.197042 & -1.672 & 0.049436 \tabularnewline
28 & -0.233873 & -1.9845 & 0.025507 \tabularnewline
29 & -0.268821 & -2.281 & 0.012754 \tabularnewline
30 & -0.303331 & -2.5738 & 0.006058 \tabularnewline
31 & -0.335527 & -2.847 & 0.002873 \tabularnewline
32 & -0.366418 & -3.1092 & 0.001344 \tabularnewline
33 & -0.395221 & -3.3536 & 0.000637 \tabularnewline
34 & -0.420702 & -3.5698 & 0.00032 \tabularnewline
35 & -0.443744 & -3.7653 & 0.000168 \tabularnewline
36 & -0.462922 & -3.928 & 9.7e-05 \tabularnewline
37 & -0.474887 & -4.0296 & 6.9e-05 \tabularnewline
38 & -0.482683 & -4.0957 & 5.4e-05 \tabularnewline
39 & -0.48674 & -4.1301 & 4.8e-05 \tabularnewline
40 & -0.485723 & -4.1215 & 5e-05 \tabularnewline
41 & -0.481349 & -4.0844 & 5.7e-05 \tabularnewline
42 & -0.474083 & -4.0227 & 7e-05 \tabularnewline
43 & -0.463581 & -3.9336 & 9.5e-05 \tabularnewline
44 & -0.450938 & -3.8263 & 0.000137 \tabularnewline
45 & -0.435674 & -3.6968 & 0.000211 \tabularnewline
46 & -0.418798 & -3.5536 & 0.000338 \tabularnewline
47 & -0.400026 & -3.3943 & 0.000561 \tabularnewline
48 & -0.380018 & -3.2246 & 0.000949 \tabularnewline
\hline
\end{tabular}
%Source: https://freestatistics.org/blog/index.php?pk=242373&T=1

[TABLE]
[ROW][C]Autocorrelation Function[/C][/ROW]
[ROW][C]Time lag k[/C][C]ACF(k)[/C][C]T-STAT[/C][C]P-value[/C][/ROW]
[ROW][C]1[/C][C]0.985703[/C][C]8.364[/C][C]0[/C][/ROW]
[ROW][C]2[/C][C]0.965313[/C][C]8.191[/C][C]0[/C][/ROW]
[ROW][C]3[/C][C]0.939827[/C][C]7.9747[/C][C]0[/C][/ROW]
[ROW][C]4[/C][C]0.907532[/C][C]7.7007[/C][C]0[/C][/ROW]
[ROW][C]5[/C][C]0.87114[/C][C]7.3919[/C][C]0[/C][/ROW]
[ROW][C]6[/C][C]0.832699[/C][C]7.0657[/C][C]0[/C][/ROW]
[ROW][C]7[/C][C]0.792013[/C][C]6.7205[/C][C]0[/C][/ROW]
[ROW][C]8[/C][C]0.74943[/C][C]6.3591[/C][C]0[/C][/ROW]
[ROW][C]9[/C][C]0.704441[/C][C]5.9774[/C][C]0[/C][/ROW]
[ROW][C]10[/C][C]0.655909[/C][C]5.5656[/C][C]0[/C][/ROW]
[ROW][C]11[/C][C]0.604048[/C][C]5.1255[/C][C]1e-06[/C][/ROW]
[ROW][C]12[/C][C]0.550186[/C][C]4.6685[/C][C]7e-06[/C][/ROW]
[ROW][C]13[/C][C]0.494697[/C][C]4.1976[/C][C]3.8e-05[/C][/ROW]
[ROW][C]14[/C][C]0.438178[/C][C]3.7181[/C][C]0.000197[/C][/ROW]
[ROW][C]15[/C][C]0.381815[/C][C]3.2398[/C][C]0.000906[/C][/ROW]
[ROW][C]16[/C][C]0.326221[/C][C]2.7681[/C][C]0.003582[/C][/ROW]
[ROW][C]17[/C][C]0.271833[/C][C]2.3066[/C][C]0.011979[/C][/ROW]
[ROW][C]18[/C][C]0.218805[/C][C]1.8566[/C][C]0.033728[/C][/ROW]
[ROW][C]19[/C][C]0.167487[/C][C]1.4212[/C][C]0.079792[/C][/ROW]
[ROW][C]20[/C][C]0.116735[/C][C]0.9905[/C][C]0.162617[/C][/ROW]
[ROW][C]21[/C][C]0.066463[/C][C]0.564[/C][C]0.287267[/C][/ROW]
[ROW][C]22[/C][C]0.017459[/C][C]0.1481[/C][C]0.441322[/C][/ROW]
[ROW][C]23[/C][C]-0.029735[/C][C]-0.2523[/C][C]0.40076[/C][/ROW]
[ROW][C]24[/C][C]-0.075389[/C][C]-0.6397[/C][C]0.262199[/C][/ROW]
[ROW][C]25[/C][C]-0.1177[/C][C]-0.9987[/C][C]0.160637[/C][/ROW]
[ROW][C]26[/C][C]-0.15844[/C][C]-1.3444[/C][C]0.091518[/C][/ROW]
[ROW][C]27[/C][C]-0.197042[/C][C]-1.672[/C][C]0.049436[/C][/ROW]
[ROW][C]28[/C][C]-0.233873[/C][C]-1.9845[/C][C]0.025507[/C][/ROW]
[ROW][C]29[/C][C]-0.268821[/C][C]-2.281[/C][C]0.012754[/C][/ROW]
[ROW][C]30[/C][C]-0.303331[/C][C]-2.5738[/C][C]0.006058[/C][/ROW]
[ROW][C]31[/C][C]-0.335527[/C][C]-2.847[/C][C]0.002873[/C][/ROW]
[ROW][C]32[/C][C]-0.366418[/C][C]-3.1092[/C][C]0.001344[/C][/ROW]
[ROW][C]33[/C][C]-0.395221[/C][C]-3.3536[/C][C]0.000637[/C][/ROW]
[ROW][C]34[/C][C]-0.420702[/C][C]-3.5698[/C][C]0.00032[/C][/ROW]
[ROW][C]35[/C][C]-0.443744[/C][C]-3.7653[/C][C]0.000168[/C][/ROW]
[ROW][C]36[/C][C]-0.462922[/C][C]-3.928[/C][C]9.7e-05[/C][/ROW]
[ROW][C]37[/C][C]-0.474887[/C][C]-4.0296[/C][C]6.9e-05[/C][/ROW]
[ROW][C]38[/C][C]-0.482683[/C][C]-4.0957[/C][C]5.4e-05[/C][/ROW]
[ROW][C]39[/C][C]-0.48674[/C][C]-4.1301[/C][C]4.8e-05[/C][/ROW]
[ROW][C]40[/C][C]-0.485723[/C][C]-4.1215[/C][C]5e-05[/C][/ROW]
[ROW][C]41[/C][C]-0.481349[/C][C]-4.0844[/C][C]5.7e-05[/C][/ROW]
[ROW][C]42[/C][C]-0.474083[/C][C]-4.0227[/C][C]7e-05[/C][/ROW]
[ROW][C]43[/C][C]-0.463581[/C][C]-3.9336[/C][C]9.5e-05[/C][/ROW]
[ROW][C]44[/C][C]-0.450938[/C][C]-3.8263[/C][C]0.000137[/C][/ROW]
[ROW][C]45[/C][C]-0.435674[/C][C]-3.6968[/C][C]0.000211[/C][/ROW]
[ROW][C]46[/C][C]-0.418798[/C][C]-3.5536[/C][C]0.000338[/C][/ROW]
[ROW][C]47[/C][C]-0.400026[/C][C]-3.3943[/C][C]0.000561[/C][/ROW]
[ROW][C]48[/C][C]-0.380018[/C][C]-3.2246[/C][C]0.000949[/C][/ROW]
[/TABLE]
Source: https://freestatistics.org/blog/index.php?pk=242373&T=1

Globally Unique Identifier (entire table): ba.freestatistics.org/blog/index.php?pk=242373&T=1

As an alternative you can also use a QR Code:  

The GUIDs for individual cells are displayed in the table below:

Autocorrelation Function
Time lag kACF(k)T-STATP-value
10.9857038.3640
20.9653138.1910
30.9398277.97470
40.9075327.70070
50.871147.39190
60.8326997.06570
70.7920136.72050
80.749436.35910
90.7044415.97740
100.6559095.56560
110.6040485.12551e-06
120.5501864.66857e-06
130.4946974.19763.8e-05
140.4381783.71810.000197
150.3818153.23980.000906
160.3262212.76810.003582
170.2718332.30660.011979
180.2188051.85660.033728
190.1674871.42120.079792
200.1167350.99050.162617
210.0664630.5640.287267
220.0174590.14810.441322
23-0.029735-0.25230.40076
24-0.075389-0.63970.262199
25-0.1177-0.99870.160637
26-0.15844-1.34440.091518
27-0.197042-1.6720.049436
28-0.233873-1.98450.025507
29-0.268821-2.2810.012754
30-0.303331-2.57380.006058
31-0.335527-2.8470.002873
32-0.366418-3.10920.001344
33-0.395221-3.35360.000637
34-0.420702-3.56980.00032
35-0.443744-3.76530.000168
36-0.462922-3.9289.7e-05
37-0.474887-4.02966.9e-05
38-0.482683-4.09575.4e-05
39-0.48674-4.13014.8e-05
40-0.485723-4.12155e-05
41-0.481349-4.08445.7e-05
42-0.474083-4.02277e-05
43-0.463581-3.93369.5e-05
44-0.450938-3.82630.000137
45-0.435674-3.69680.000211
46-0.418798-3.55360.000338
47-0.400026-3.39430.000561
48-0.380018-3.22460.000949


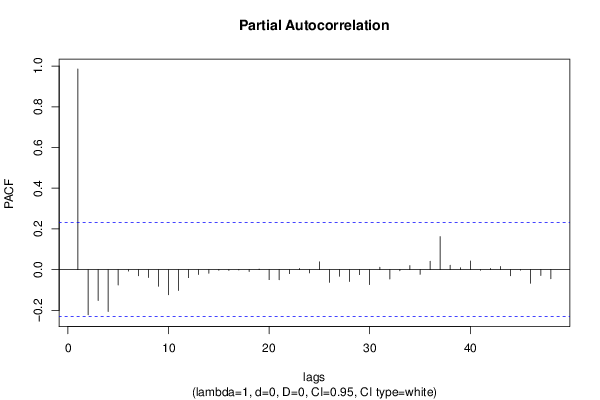
Partial Autocorrelation Function
Time lag kPACF(k)T-STATP-value
10.9857038.3640
2-0.221807-1.88210.031932
3-0.151937-1.28920.100723
4-0.205705-1.74550.042585
5-0.07589-0.64390.260828
6-0.007222-0.06130.475654
7-0.029989-0.25450.399932
8-0.038761-0.32890.371593
9-0.08195-0.69540.244531
10-0.12345-1.04750.149185
11-0.102732-0.87170.193131
12-0.039488-0.33510.369276
13-0.024341-0.20650.418477
14-0.017562-0.1490.440978
15-0.002887-0.02450.490262
16-0.00375-0.03180.48735
17-0.001563-0.01330.494728
18-0.008858-0.07520.470146
190.0024250.02060.49182
20-0.049081-0.41650.339155
21-0.050006-0.42430.336301
22-0.019646-0.16670.434035
230.0056430.04790.480971
24-0.016117-0.13680.445803
250.0380220.32260.373956
26-0.062781-0.53270.297936
27-0.032948-0.27960.390302
28-0.058309-0.49480.311136
29-0.024504-0.20790.417939
30-0.073543-0.6240.267289
310.0115260.09780.461181
32-0.046203-0.3920.348091
33-0.005573-0.04730.481209
340.0198560.16850.433336
35-0.023218-0.1970.422187
360.0410190.34810.364407
370.1620681.37520.086667
380.0215340.18270.427766
390.0092120.07820.468958
400.042790.36310.358802
41-0.002744-0.02330.490743
420.0059640.05060.479889
430.0156880.13310.447236
44-0.03048-0.25860.398329
45-0.002423-0.02060.491828
46-0.066586-0.5650.286915
47-0.02864-0.2430.40434
48-0.045145-0.38310.3514

\begin{tabular}{lllllllll}
\hline
Partial Autocorrelation Function \tabularnewline
Time lag k & PACF(k) & T-STAT & P-value \tabularnewline
1 & 0.985703 & 8.364 & 0 \tabularnewline
2 & -0.221807 & -1.8821 & 0.031932 \tabularnewline
3 & -0.151937 & -1.2892 & 0.100723 \tabularnewline
4 & -0.205705 & -1.7455 & 0.042585 \tabularnewline
5 & -0.07589 & -0.6439 & 0.260828 \tabularnewline
6 & -0.007222 & -0.0613 & 0.475654 \tabularnewline
7 & -0.029989 & -0.2545 & 0.399932 \tabularnewline
8 & -0.038761 & -0.3289 & 0.371593 \tabularnewline
9 & -0.08195 & -0.6954 & 0.244531 \tabularnewline
10 & -0.12345 & -1.0475 & 0.149185 \tabularnewline
11 & -0.102732 & -0.8717 & 0.193131 \tabularnewline
12 & -0.039488 & -0.3351 & 0.369276 \tabularnewline
13 & -0.024341 & -0.2065 & 0.418477 \tabularnewline
14 & -0.017562 & -0.149 & 0.440978 \tabularnewline
15 & -0.002887 & -0.0245 & 0.490262 \tabularnewline
16 & -0.00375 & -0.0318 & 0.48735 \tabularnewline
17 & -0.001563 & -0.0133 & 0.494728 \tabularnewline
18 & -0.008858 & -0.0752 & 0.470146 \tabularnewline
19 & 0.002425 & 0.0206 & 0.49182 \tabularnewline
20 & -0.049081 & -0.4165 & 0.339155 \tabularnewline
21 & -0.050006 & -0.4243 & 0.336301 \tabularnewline
22 & -0.019646 & -0.1667 & 0.434035 \tabularnewline
23 & 0.005643 & 0.0479 & 0.480971 \tabularnewline
24 & -0.016117 & -0.1368 & 0.445803 \tabularnewline
25 & 0.038022 & 0.3226 & 0.373956 \tabularnewline
26 & -0.062781 & -0.5327 & 0.297936 \tabularnewline
27 & -0.032948 & -0.2796 & 0.390302 \tabularnewline
28 & -0.058309 & -0.4948 & 0.311136 \tabularnewline
29 & -0.024504 & -0.2079 & 0.417939 \tabularnewline
30 & -0.073543 & -0.624 & 0.267289 \tabularnewline
31 & 0.011526 & 0.0978 & 0.461181 \tabularnewline
32 & -0.046203 & -0.392 & 0.348091 \tabularnewline
33 & -0.005573 & -0.0473 & 0.481209 \tabularnewline
34 & 0.019856 & 0.1685 & 0.433336 \tabularnewline
35 & -0.023218 & -0.197 & 0.422187 \tabularnewline
36 & 0.041019 & 0.3481 & 0.364407 \tabularnewline
37 & 0.162068 & 1.3752 & 0.086667 \tabularnewline
38 & 0.021534 & 0.1827 & 0.427766 \tabularnewline
39 & 0.009212 & 0.0782 & 0.468958 \tabularnewline
40 & 0.04279 & 0.3631 & 0.358802 \tabularnewline
41 & -0.002744 & -0.0233 & 0.490743 \tabularnewline
42 & 0.005964 & 0.0506 & 0.479889 \tabularnewline
43 & 0.015688 & 0.1331 & 0.447236 \tabularnewline
44 & -0.03048 & -0.2586 & 0.398329 \tabularnewline
45 & -0.002423 & -0.0206 & 0.491828 \tabularnewline
46 & -0.066586 & -0.565 & 0.286915 \tabularnewline
47 & -0.02864 & -0.243 & 0.40434 \tabularnewline
48 & -0.045145 & -0.3831 & 0.3514 \tabularnewline
\hline
\end{tabular}
%Source: https://freestatistics.org/blog/index.php?pk=242373&T=2

[TABLE]
[ROW][C]Partial Autocorrelation Function[/C][/ROW]
[ROW][C]Time lag k[/C][C]PACF(k)[/C][C]T-STAT[/C][C]P-value[/C][/ROW]
[ROW][C]1[/C][C]0.985703[/C][C]8.364[/C][C]0[/C][/ROW]
[ROW][C]2[/C][C]-0.221807[/C][C]-1.8821[/C][C]0.031932[/C][/ROW]
[ROW][C]3[/C][C]-0.151937[/C][C]-1.2892[/C][C]0.100723[/C][/ROW]
[ROW][C]4[/C][C]-0.205705[/C][C]-1.7455[/C][C]0.042585[/C][/ROW]
[ROW][C]5[/C][C]-0.07589[/C][C]-0.6439[/C][C]0.260828[/C][/ROW]
[ROW][C]6[/C][C]-0.007222[/C][C]-0.0613[/C][C]0.475654[/C][/ROW]
[ROW][C]7[/C][C]-0.029989[/C][C]-0.2545[/C][C]0.399932[/C][/ROW]
[ROW][C]8[/C][C]-0.038761[/C][C]-0.3289[/C][C]0.371593[/C][/ROW]
[ROW][C]9[/C][C]-0.08195[/C][C]-0.6954[/C][C]0.244531[/C][/ROW]
[ROW][C]10[/C][C]-0.12345[/C][C]-1.0475[/C][C]0.149185[/C][/ROW]
[ROW][C]11[/C][C]-0.102732[/C][C]-0.8717[/C][C]0.193131[/C][/ROW]
[ROW][C]12[/C][C]-0.039488[/C][C]-0.3351[/C][C]0.369276[/C][/ROW]
[ROW][C]13[/C][C]-0.024341[/C][C]-0.2065[/C][C]0.418477[/C][/ROW]
[ROW][C]14[/C][C]-0.017562[/C][C]-0.149[/C][C]0.440978[/C][/ROW]
[ROW][C]15[/C][C]-0.002887[/C][C]-0.0245[/C][C]0.490262[/C][/ROW]
[ROW][C]16[/C][C]-0.00375[/C][C]-0.0318[/C][C]0.48735[/C][/ROW]
[ROW][C]17[/C][C]-0.001563[/C][C]-0.0133[/C][C]0.494728[/C][/ROW]
[ROW][C]18[/C][C]-0.008858[/C][C]-0.0752[/C][C]0.470146[/C][/ROW]
[ROW][C]19[/C][C]0.002425[/C][C]0.0206[/C][C]0.49182[/C][/ROW]
[ROW][C]20[/C][C]-0.049081[/C][C]-0.4165[/C][C]0.339155[/C][/ROW]
[ROW][C]21[/C][C]-0.050006[/C][C]-0.4243[/C][C]0.336301[/C][/ROW]
[ROW][C]22[/C][C]-0.019646[/C][C]-0.1667[/C][C]0.434035[/C][/ROW]
[ROW][C]23[/C][C]0.005643[/C][C]0.0479[/C][C]0.480971[/C][/ROW]
[ROW][C]24[/C][C]-0.016117[/C][C]-0.1368[/C][C]0.445803[/C][/ROW]
[ROW][C]25[/C][C]0.038022[/C][C]0.3226[/C][C]0.373956[/C][/ROW]
[ROW][C]26[/C][C]-0.062781[/C][C]-0.5327[/C][C]0.297936[/C][/ROW]
[ROW][C]27[/C][C]-0.032948[/C][C]-0.2796[/C][C]0.390302[/C][/ROW]
[ROW][C]28[/C][C]-0.058309[/C][C]-0.4948[/C][C]0.311136[/C][/ROW]
[ROW][C]29[/C][C]-0.024504[/C][C]-0.2079[/C][C]0.417939[/C][/ROW]
[ROW][C]30[/C][C]-0.073543[/C][C]-0.624[/C][C]0.267289[/C][/ROW]
[ROW][C]31[/C][C]0.011526[/C][C]0.0978[/C][C]0.461181[/C][/ROW]
[ROW][C]32[/C][C]-0.046203[/C][C]-0.392[/C][C]0.348091[/C][/ROW]
[ROW][C]33[/C][C]-0.005573[/C][C]-0.0473[/C][C]0.481209[/C][/ROW]
[ROW][C]34[/C][C]0.019856[/C][C]0.1685[/C][C]0.433336[/C][/ROW]
[ROW][C]35[/C][C]-0.023218[/C][C]-0.197[/C][C]0.422187[/C][/ROW]
[ROW][C]36[/C][C]0.041019[/C][C]0.3481[/C][C]0.364407[/C][/ROW]
[ROW][C]37[/C][C]0.162068[/C][C]1.3752[/C][C]0.086667[/C][/ROW]
[ROW][C]38[/C][C]0.021534[/C][C]0.1827[/C][C]0.427766[/C][/ROW]
[ROW][C]39[/C][C]0.009212[/C][C]0.0782[/C][C]0.468958[/C][/ROW]
[ROW][C]40[/C][C]0.04279[/C][C]0.3631[/C][C]0.358802[/C][/ROW]
[ROW][C]41[/C][C]-0.002744[/C][C]-0.0233[/C][C]0.490743[/C][/ROW]
[ROW][C]42[/C][C]0.005964[/C][C]0.0506[/C][C]0.479889[/C][/ROW]
[ROW][C]43[/C][C]0.015688[/C][C]0.1331[/C][C]0.447236[/C][/ROW]
[ROW][C]44[/C][C]-0.03048[/C][C]-0.2586[/C][C]0.398329[/C][/ROW]
[ROW][C]45[/C][C]-0.002423[/C][C]-0.0206[/C][C]0.491828[/C][/ROW]
[ROW][C]46[/C][C]-0.066586[/C][C]-0.565[/C][C]0.286915[/C][/ROW]
[ROW][C]47[/C][C]-0.02864[/C][C]-0.243[/C][C]0.40434[/C][/ROW]
[ROW][C]48[/C][C]-0.045145[/C][C]-0.3831[/C][C]0.3514[/C][/ROW]
[/TABLE]
Source: https://freestatistics.org/blog/index.php?pk=242373&T=2

Globally Unique Identifier (entire table): ba.freestatistics.org/blog/index.php?pk=242373&T=2

As an alternative you can also use a QR Code:  

The GUIDs for individual cells are displayed in the table below:

Partial Autocorrelation Function
Time lag kPACF(k)T-STATP-value
10.9857038.3640
2-0.221807-1.88210.031932
3-0.151937-1.28920.100723
4-0.205705-1.74550.042585
5-0.07589-0.64390.260828
6-0.007222-0.06130.475654
7-0.029989-0.25450.399932
8-0.038761-0.32890.371593
9-0.08195-0.69540.244531
10-0.12345-1.04750.149185
11-0.102732-0.87170.193131
12-0.039488-0.33510.369276
13-0.024341-0.20650.418477
14-0.017562-0.1490.440978
15-0.002887-0.02450.490262
16-0.00375-0.03180.48735
17-0.001563-0.01330.494728
18-0.008858-0.07520.470146
190.0024250.02060.49182
20-0.049081-0.41650.339155
21-0.050006-0.42430.336301
22-0.019646-0.16670.434035
230.0056430.04790.480971
24-0.016117-0.13680.445803
250.0380220.32260.373956
26-0.062781-0.53270.297936
27-0.032948-0.27960.390302
28-0.058309-0.49480.311136
29-0.024504-0.20790.417939
30-0.073543-0.6240.267289
310.0115260.09780.461181
32-0.046203-0.3920.348091
33-0.005573-0.04730.481209
340.0198560.16850.433336
35-0.023218-0.1970.422187
360.0410190.34810.364407
370.1620681.37520.086667
380.0215340.18270.427766
390.0092120.07820.468958
400.042790.36310.358802
41-0.002744-0.02330.490743
420.0059640.05060.479889
430.0156880.13310.447236
44-0.03048-0.25860.398329
45-0.002423-0.02060.491828
46-0.066586-0.5650.286915
47-0.02864-0.2430.40434
48-0.045145-0.38310.3514


Parameters (Session):
par1 = 48 ; par2 = 1 ; par3 = 0 ; par4 = 0 ; par5 = 12 ; par6 = White Noise ; par7 = 0.95 ;
Parameters (R input):
par1 = 48 ; par2 = 1 ; par3 = 0 ; par4 = 0 ; par5 = 12 ; par6 = White Noise ; par7 = 0.95 ; par8 = ;
R code (references can be found in the software module):
if (par1 == 'Default') {
par1 = 10*log10(length(x))
} else {
par1 <- as.numeric(par1)
}
par2 <- as.numeric(par2)
par3 <- as.numeric(par3)
par4 <- as.numeric(par4)
par5 <- as.numeric(par5)
if (par6 == 'White Noise') par6 <- 'white' else par6 <- 'ma'
par7 <- as.numeric(par7)
if (par8 != '') par8 <- as.numeric(par8)
ox <- x
if (par8 == '') {
if (par2 == 0) {
x <- log(x)
} else {
x <- (x ^ par2 - 1) / par2
}
} else {
x <- log(x,base=par8)
}
if (par3 > 0) x <- diff(x,lag=1,difference=par3)
if (par4 > 0) x <- diff(x,lag=par5,difference=par4)
bitmap(file='picts.png')
op <- par(mfrow=c(2,1))
plot(ox,type='l',main='Original Time Series',xlab='time',ylab='value')
if (par8=='') {
mytitle <- paste('Working Time Series (lambda=',par2,', d=',par3,', D=',par4,')',sep='')
mysub <- paste('(lambda=',par2,', d=',par3,', D=',par4,', CI=', par7, ', CI type=',par6,')',sep='')
} else {
mytitle <- paste('Working Time Series (base=',par8,', d=',par3,', D=',par4,')',sep='')
mysub <- paste('(base=',par8,', d=',par3,', D=',par4,', CI=', par7, ', CI type=',par6,')',sep='')
}
plot(x,type='l', main=mytitle,xlab='time',ylab='value')
par(op)
dev.off()
bitmap(file='pic1.png')
racf <- acf(x, par1, main='Autocorrelation', xlab='time lag', ylab='ACF', ci.type=par6, ci=par7, sub=mysub)
dev.off()
bitmap(file='pic2.png')
rpacf <- pacf(x,par1,main='Partial Autocorrelation',xlab='lags',ylab='PACF',sub=mysub)
dev.off()
(myacf <- c(racf$acf))
(mypacf <- c(rpacf$acf))
lengthx <- length(x)
sqrtn <- sqrt(lengthx)
load(file='createtable')
a<-table.start()
a<-table.row.start(a)
a<-table.element(a,'Autocorrelation Function',4,TRUE)
a<-table.row.end(a)
a<-table.row.start(a)
a<-table.element(a,'Time lag k',header=TRUE)
a<-table.element(a,hyperlink('basics.htm','ACF(k)','click here for more information about the Autocorrelation Function'),header=TRUE)
a<-table.element(a,'T-STAT',header=TRUE)
a<-table.element(a,'P-value',header=TRUE)
a<-table.row.end(a)
for (i in 2:(par1+1)) {
a<-table.row.start(a)
a<-table.element(a,i-1,header=TRUE)
a<-table.element(a,round(myacf[i],6))
mytstat <- myacf[i]*sqrtn
a<-table.element(a,round(mytstat,4))
a<-table.element(a,round(1-pt(abs(mytstat),lengthx),6))
a<-table.row.end(a)
}
a<-table.end(a)
table.save(a,file='mytable.tab')
a<-table.start()
a<-table.row.start(a)
a<-table.element(a,'Partial Autocorrelation Function',4,TRUE)
a<-table.row.end(a)
a<-table.row.start(a)
a<-table.element(a,'Time lag k',header=TRUE)
a<-table.element(a,hyperlink('basics.htm','PACF(k)','click here for more information about the Partial Autocorrelation Function'),header=TRUE)
a<-table.element(a,'T-STAT',header=TRUE)
a<-table.element(a,'P-value',header=TRUE)
a<-table.row.end(a)
for (i in 1:par1) {
a<-table.row.start(a)
a<-table.element(a,i,header=TRUE)
a<-table.element(a,round(mypacf[i],6))
mytstat <- mypacf[i]*sqrtn
a<-table.element(a,round(mytstat,4))
a<-table.element(a,round(1-pt(abs(mytstat),lengthx),6))
a<-table.row.end(a)
}
a<-table.end(a)
table.save(a,file='mytable1.tab')