Free Statistics

of Irreproducible Research!

Author's title

Author*Unverified author*
R Software Modulerwasp_autocorrelation.wasp
Title produced by software(Partial) Autocorrelation Function
Date of computationThu, 16 Oct 2014 14:04:10 +0100
Cite this page as followsStatistical Computations at FreeStatistics.org, Office for Research Development and Education, URL https://freestatistics.org/blog/index.php?v=date/2014/Oct/16/t14134647123uu14ciyw6ixpoi.htm/, Retrieved Mon, 13 May 2024 00:19:36 +0000
Statistical Computations at FreeStatistics.org, Office for Research Development and Education, URL https://freestatistics.org/blog/index.php?pk=242355, Retrieved Mon, 13 May 2024 00:19:36 +0000
QR Codes:

Original text written by user:
IsPrivate?No (this computation is public)
User-defined keywords
Estimated Impact85
Family? (F = Feedback message, R = changed R code, M = changed R Module, P = changed Parameters, D = changed Data)
-     [Mean Plot] [] [2014-10-10 11:30:26] [646b2e45c853a5eeaa778aa28018f97d]
- RMP     [(Partial) Autocorrelation Function] [] [2014-10-16 13:04:10] [e9c24c4a54e855481a8eaf4353236c0f] [Current]
Feedback Forum

Post a new message
Dataseries X:
24175
23658
26727
24397
25829
25503
24914
24875
25461
27647
28382
25259
28100
27900
28078
28479
28156
29219
28782
27078
30031
29579
26532
23995
22067
21818
23787
21551
21309
22395
22906
21430
23492
24144
24438
24689
24569
23754
28473
27051
27081
29635
27715
26373
28009
29472
30005
29777
28886
28549
33348
29017
30924
30435
29431
30290
31286
30622
31742
30391
30740
32086
33947
31312
33239
32362
32170
32665
31412
34891
33919
30706
32846
31368
33130
31665
33139
32201
32230
30287
31918
33853
32232
31484


Summary of computational transaction
Raw Inputview raw input (R code)
Raw Outputview raw output of R engine
Computing time1 seconds
R Server'Herman Ole Andreas Wold' @ wold.wessa.net

\begin{tabular}{lllllllll}
\hline
Summary of computational transaction \tabularnewline
Raw Input & view raw input (R code)  \tabularnewline
Raw Output & view raw output of R engine  \tabularnewline
Computing time & 1 seconds \tabularnewline
R Server & 'Herman Ole Andreas Wold' @ wold.wessa.net \tabularnewline
\hline
\end{tabular}
%Source: https://freestatistics.org/blog/index.php?pk=242355&T=0

[TABLE]
[ROW][C]Summary of computational transaction[/C][/ROW]
[ROW][C]Raw Input[/C][C]view raw input (R code) [/C][/ROW]
[ROW][C]Raw Output[/C][C]view raw output of R engine [/C][/ROW]
[ROW][C]Computing time[/C][C]1 seconds[/C][/ROW]
[ROW][C]R Server[/C][C]'Herman Ole Andreas Wold' @ wold.wessa.net[/C][/ROW]
[/TABLE]
Source: https://freestatistics.org/blog/index.php?pk=242355&T=0

Globally Unique Identifier (entire table): ba.freestatistics.org/blog/index.php?pk=242355&T=0

As an alternative you can also use a QR Code:  

The GUIDs for individual cells are displayed in the table below:

Summary of computational transaction
Raw Inputview raw input (R code)
Raw Outputview raw output of R engine
Computing time1 seconds
R Server'Herman Ole Andreas Wold' @ wold.wessa.net


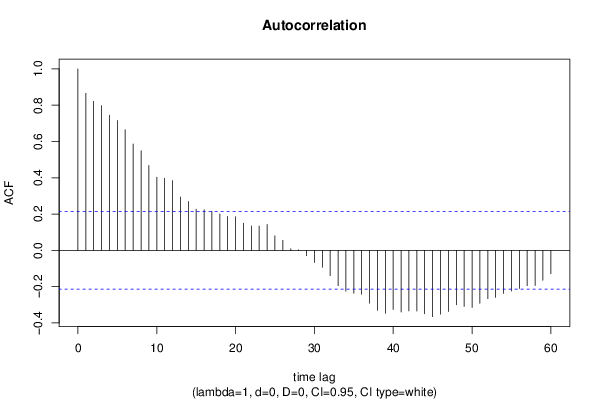
Autocorrelation Function
Time lag kACF(k)T-STATP-value
10.8653837.93140
20.8212527.52690
30.7980757.31450
40.7448026.82620
50.7157446.55990
60.6644356.08960
70.5865755.37610
80.5491025.03261e-06
90.467834.28772.4e-05
100.4032693.6960.000195
110.3979893.64760.000229
120.3846633.52550.000344
130.2941632.69610.004238
140.269722.4720.007727
150.2270872.08130.020226
160.2235332.04870.021806
170.2151971.97230.025932
180.2009561.84180.034517
190.1864981.70930.045546
200.1851721.69710.046687
210.1495691.37080.087041
220.1345861.23350.110414
230.1337031.22540.111922
240.1423621.30480.097767
250.0798650.7320.23311
260.0550040.50410.307749
270.0085550.07840.468846
280.0028220.02590.489713
29-0.029119-0.26690.395109
30-0.066787-0.61210.271058
31-0.093056-0.85290.198077
32-0.140175-1.28470.101211
33-0.194501-1.78260.03913
34-0.224909-2.06130.021182
35-0.236296-2.16570.016585
36-0.241748-2.21570.01471
37-0.29083-2.66550.004609
38-0.330637-3.03030.001623
39-0.346424-3.1750.001048
40-0.326188-2.98960.001832
41-0.339668-3.11310.001266
42-0.333577-3.05730.001498
43-0.33424-3.06340.001471
44-0.349103-3.19960.000971
45-0.365403-3.3490.000608
46-0.351657-3.2230.000903
47-0.337162-3.09010.001357
48-0.299972-2.74930.003655
49-0.308949-2.83160.002898
50-0.314278-2.88040.002519
51-0.29134-2.67020.00455
52-0.266048-2.43840.008431
53-0.259186-2.37550.009901
54-0.236979-2.17190.016339
55-0.22407-2.05360.021561
56-0.210375-1.92810.028609
57-0.194997-1.78720.038758
58-0.19408-1.77880.039447
59-0.16511-1.51330.066983
60-0.128452-1.17730.121205

\begin{tabular}{lllllllll}
\hline
Autocorrelation Function \tabularnewline
Time lag k & ACF(k) & T-STAT & P-value \tabularnewline
1 & 0.865383 & 7.9314 & 0 \tabularnewline
2 & 0.821252 & 7.5269 & 0 \tabularnewline
3 & 0.798075 & 7.3145 & 0 \tabularnewline
4 & 0.744802 & 6.8262 & 0 \tabularnewline
5 & 0.715744 & 6.5599 & 0 \tabularnewline
6 & 0.664435 & 6.0896 & 0 \tabularnewline
7 & 0.586575 & 5.3761 & 0 \tabularnewline
8 & 0.549102 & 5.0326 & 1e-06 \tabularnewline
9 & 0.46783 & 4.2877 & 2.4e-05 \tabularnewline
10 & 0.403269 & 3.696 & 0.000195 \tabularnewline
11 & 0.397989 & 3.6476 & 0.000229 \tabularnewline
12 & 0.384663 & 3.5255 & 0.000344 \tabularnewline
13 & 0.294163 & 2.6961 & 0.004238 \tabularnewline
14 & 0.26972 & 2.472 & 0.007727 \tabularnewline
15 & 0.227087 & 2.0813 & 0.020226 \tabularnewline
16 & 0.223533 & 2.0487 & 0.021806 \tabularnewline
17 & 0.215197 & 1.9723 & 0.025932 \tabularnewline
18 & 0.200956 & 1.8418 & 0.034517 \tabularnewline
19 & 0.186498 & 1.7093 & 0.045546 \tabularnewline
20 & 0.185172 & 1.6971 & 0.046687 \tabularnewline
21 & 0.149569 & 1.3708 & 0.087041 \tabularnewline
22 & 0.134586 & 1.2335 & 0.110414 \tabularnewline
23 & 0.133703 & 1.2254 & 0.111922 \tabularnewline
24 & 0.142362 & 1.3048 & 0.097767 \tabularnewline
25 & 0.079865 & 0.732 & 0.23311 \tabularnewline
26 & 0.055004 & 0.5041 & 0.307749 \tabularnewline
27 & 0.008555 & 0.0784 & 0.468846 \tabularnewline
28 & 0.002822 & 0.0259 & 0.489713 \tabularnewline
29 & -0.029119 & -0.2669 & 0.395109 \tabularnewline
30 & -0.066787 & -0.6121 & 0.271058 \tabularnewline
31 & -0.093056 & -0.8529 & 0.198077 \tabularnewline
32 & -0.140175 & -1.2847 & 0.101211 \tabularnewline
33 & -0.194501 & -1.7826 & 0.03913 \tabularnewline
34 & -0.224909 & -2.0613 & 0.021182 \tabularnewline
35 & -0.236296 & -2.1657 & 0.016585 \tabularnewline
36 & -0.241748 & -2.2157 & 0.01471 \tabularnewline
37 & -0.29083 & -2.6655 & 0.004609 \tabularnewline
38 & -0.330637 & -3.0303 & 0.001623 \tabularnewline
39 & -0.346424 & -3.175 & 0.001048 \tabularnewline
40 & -0.326188 & -2.9896 & 0.001832 \tabularnewline
41 & -0.339668 & -3.1131 & 0.001266 \tabularnewline
42 & -0.333577 & -3.0573 & 0.001498 \tabularnewline
43 & -0.33424 & -3.0634 & 0.001471 \tabularnewline
44 & -0.349103 & -3.1996 & 0.000971 \tabularnewline
45 & -0.365403 & -3.349 & 0.000608 \tabularnewline
46 & -0.351657 & -3.223 & 0.000903 \tabularnewline
47 & -0.337162 & -3.0901 & 0.001357 \tabularnewline
48 & -0.299972 & -2.7493 & 0.003655 \tabularnewline
49 & -0.308949 & -2.8316 & 0.002898 \tabularnewline
50 & -0.314278 & -2.8804 & 0.002519 \tabularnewline
51 & -0.29134 & -2.6702 & 0.00455 \tabularnewline
52 & -0.266048 & -2.4384 & 0.008431 \tabularnewline
53 & -0.259186 & -2.3755 & 0.009901 \tabularnewline
54 & -0.236979 & -2.1719 & 0.016339 \tabularnewline
55 & -0.22407 & -2.0536 & 0.021561 \tabularnewline
56 & -0.210375 & -1.9281 & 0.028609 \tabularnewline
57 & -0.194997 & -1.7872 & 0.038758 \tabularnewline
58 & -0.19408 & -1.7788 & 0.039447 \tabularnewline
59 & -0.16511 & -1.5133 & 0.066983 \tabularnewline
60 & -0.128452 & -1.1773 & 0.121205 \tabularnewline
\hline
\end{tabular}
%Source: https://freestatistics.org/blog/index.php?pk=242355&T=1

[TABLE]
[ROW][C]Autocorrelation Function[/C][/ROW]
[ROW][C]Time lag k[/C][C]ACF(k)[/C][C]T-STAT[/C][C]P-value[/C][/ROW]
[ROW][C]1[/C][C]0.865383[/C][C]7.9314[/C][C]0[/C][/ROW]
[ROW][C]2[/C][C]0.821252[/C][C]7.5269[/C][C]0[/C][/ROW]
[ROW][C]3[/C][C]0.798075[/C][C]7.3145[/C][C]0[/C][/ROW]
[ROW][C]4[/C][C]0.744802[/C][C]6.8262[/C][C]0[/C][/ROW]
[ROW][C]5[/C][C]0.715744[/C][C]6.5599[/C][C]0[/C][/ROW]
[ROW][C]6[/C][C]0.664435[/C][C]6.0896[/C][C]0[/C][/ROW]
[ROW][C]7[/C][C]0.586575[/C][C]5.3761[/C][C]0[/C][/ROW]
[ROW][C]8[/C][C]0.549102[/C][C]5.0326[/C][C]1e-06[/C][/ROW]
[ROW][C]9[/C][C]0.46783[/C][C]4.2877[/C][C]2.4e-05[/C][/ROW]
[ROW][C]10[/C][C]0.403269[/C][C]3.696[/C][C]0.000195[/C][/ROW]
[ROW][C]11[/C][C]0.397989[/C][C]3.6476[/C][C]0.000229[/C][/ROW]
[ROW][C]12[/C][C]0.384663[/C][C]3.5255[/C][C]0.000344[/C][/ROW]
[ROW][C]13[/C][C]0.294163[/C][C]2.6961[/C][C]0.004238[/C][/ROW]
[ROW][C]14[/C][C]0.26972[/C][C]2.472[/C][C]0.007727[/C][/ROW]
[ROW][C]15[/C][C]0.227087[/C][C]2.0813[/C][C]0.020226[/C][/ROW]
[ROW][C]16[/C][C]0.223533[/C][C]2.0487[/C][C]0.021806[/C][/ROW]
[ROW][C]17[/C][C]0.215197[/C][C]1.9723[/C][C]0.025932[/C][/ROW]
[ROW][C]18[/C][C]0.200956[/C][C]1.8418[/C][C]0.034517[/C][/ROW]
[ROW][C]19[/C][C]0.186498[/C][C]1.7093[/C][C]0.045546[/C][/ROW]
[ROW][C]20[/C][C]0.185172[/C][C]1.6971[/C][C]0.046687[/C][/ROW]
[ROW][C]21[/C][C]0.149569[/C][C]1.3708[/C][C]0.087041[/C][/ROW]
[ROW][C]22[/C][C]0.134586[/C][C]1.2335[/C][C]0.110414[/C][/ROW]
[ROW][C]23[/C][C]0.133703[/C][C]1.2254[/C][C]0.111922[/C][/ROW]
[ROW][C]24[/C][C]0.142362[/C][C]1.3048[/C][C]0.097767[/C][/ROW]
[ROW][C]25[/C][C]0.079865[/C][C]0.732[/C][C]0.23311[/C][/ROW]
[ROW][C]26[/C][C]0.055004[/C][C]0.5041[/C][C]0.307749[/C][/ROW]
[ROW][C]27[/C][C]0.008555[/C][C]0.0784[/C][C]0.468846[/C][/ROW]
[ROW][C]28[/C][C]0.002822[/C][C]0.0259[/C][C]0.489713[/C][/ROW]
[ROW][C]29[/C][C]-0.029119[/C][C]-0.2669[/C][C]0.395109[/C][/ROW]
[ROW][C]30[/C][C]-0.066787[/C][C]-0.6121[/C][C]0.271058[/C][/ROW]
[ROW][C]31[/C][C]-0.093056[/C][C]-0.8529[/C][C]0.198077[/C][/ROW]
[ROW][C]32[/C][C]-0.140175[/C][C]-1.2847[/C][C]0.101211[/C][/ROW]
[ROW][C]33[/C][C]-0.194501[/C][C]-1.7826[/C][C]0.03913[/C][/ROW]
[ROW][C]34[/C][C]-0.224909[/C][C]-2.0613[/C][C]0.021182[/C][/ROW]
[ROW][C]35[/C][C]-0.236296[/C][C]-2.1657[/C][C]0.016585[/C][/ROW]
[ROW][C]36[/C][C]-0.241748[/C][C]-2.2157[/C][C]0.01471[/C][/ROW]
[ROW][C]37[/C][C]-0.29083[/C][C]-2.6655[/C][C]0.004609[/C][/ROW]
[ROW][C]38[/C][C]-0.330637[/C][C]-3.0303[/C][C]0.001623[/C][/ROW]
[ROW][C]39[/C][C]-0.346424[/C][C]-3.175[/C][C]0.001048[/C][/ROW]
[ROW][C]40[/C][C]-0.326188[/C][C]-2.9896[/C][C]0.001832[/C][/ROW]
[ROW][C]41[/C][C]-0.339668[/C][C]-3.1131[/C][C]0.001266[/C][/ROW]
[ROW][C]42[/C][C]-0.333577[/C][C]-3.0573[/C][C]0.001498[/C][/ROW]
[ROW][C]43[/C][C]-0.33424[/C][C]-3.0634[/C][C]0.001471[/C][/ROW]
[ROW][C]44[/C][C]-0.349103[/C][C]-3.1996[/C][C]0.000971[/C][/ROW]
[ROW][C]45[/C][C]-0.365403[/C][C]-3.349[/C][C]0.000608[/C][/ROW]
[ROW][C]46[/C][C]-0.351657[/C][C]-3.223[/C][C]0.000903[/C][/ROW]
[ROW][C]47[/C][C]-0.337162[/C][C]-3.0901[/C][C]0.001357[/C][/ROW]
[ROW][C]48[/C][C]-0.299972[/C][C]-2.7493[/C][C]0.003655[/C][/ROW]
[ROW][C]49[/C][C]-0.308949[/C][C]-2.8316[/C][C]0.002898[/C][/ROW]
[ROW][C]50[/C][C]-0.314278[/C][C]-2.8804[/C][C]0.002519[/C][/ROW]
[ROW][C]51[/C][C]-0.29134[/C][C]-2.6702[/C][C]0.00455[/C][/ROW]
[ROW][C]52[/C][C]-0.266048[/C][C]-2.4384[/C][C]0.008431[/C][/ROW]
[ROW][C]53[/C][C]-0.259186[/C][C]-2.3755[/C][C]0.009901[/C][/ROW]
[ROW][C]54[/C][C]-0.236979[/C][C]-2.1719[/C][C]0.016339[/C][/ROW]
[ROW][C]55[/C][C]-0.22407[/C][C]-2.0536[/C][C]0.021561[/C][/ROW]
[ROW][C]56[/C][C]-0.210375[/C][C]-1.9281[/C][C]0.028609[/C][/ROW]
[ROW][C]57[/C][C]-0.194997[/C][C]-1.7872[/C][C]0.038758[/C][/ROW]
[ROW][C]58[/C][C]-0.19408[/C][C]-1.7788[/C][C]0.039447[/C][/ROW]
[ROW][C]59[/C][C]-0.16511[/C][C]-1.5133[/C][C]0.066983[/C][/ROW]
[ROW][C]60[/C][C]-0.128452[/C][C]-1.1773[/C][C]0.121205[/C][/ROW]
[/TABLE]
Source: https://freestatistics.org/blog/index.php?pk=242355&T=1

Globally Unique Identifier (entire table): ba.freestatistics.org/blog/index.php?pk=242355&T=1

As an alternative you can also use a QR Code:  

The GUIDs for individual cells are displayed in the table below:

Autocorrelation Function
Time lag kACF(k)T-STATP-value
10.8653837.93140
20.8212527.52690
30.7980757.31450
40.7448026.82620
50.7157446.55990
60.6644356.08960
70.5865755.37610
80.5491025.03261e-06
90.467834.28772.4e-05
100.4032693.6960.000195
110.3979893.64760.000229
120.3846633.52550.000344
130.2941632.69610.004238
140.269722.4720.007727
150.2270872.08130.020226
160.2235332.04870.021806
170.2151971.97230.025932
180.2009561.84180.034517
190.1864981.70930.045546
200.1851721.69710.046687
210.1495691.37080.087041
220.1345861.23350.110414
230.1337031.22540.111922
240.1423621.30480.097767
250.0798650.7320.23311
260.0550040.50410.307749
270.0085550.07840.468846
280.0028220.02590.489713
29-0.029119-0.26690.395109
30-0.066787-0.61210.271058
31-0.093056-0.85290.198077
32-0.140175-1.28470.101211
33-0.194501-1.78260.03913
34-0.224909-2.06130.021182
35-0.236296-2.16570.016585
36-0.241748-2.21570.01471
37-0.29083-2.66550.004609
38-0.330637-3.03030.001623
39-0.346424-3.1750.001048
40-0.326188-2.98960.001832
41-0.339668-3.11310.001266
42-0.333577-3.05730.001498
43-0.33424-3.06340.001471
44-0.349103-3.19960.000971
45-0.365403-3.3490.000608
46-0.351657-3.2230.000903
47-0.337162-3.09010.001357
48-0.299972-2.74930.003655
49-0.308949-2.83160.002898
50-0.314278-2.88040.002519
51-0.29134-2.67020.00455
52-0.266048-2.43840.008431
53-0.259186-2.37550.009901
54-0.236979-2.17190.016339
55-0.22407-2.05360.021561
56-0.210375-1.92810.028609
57-0.194997-1.78720.038758
58-0.19408-1.77880.039447
59-0.16511-1.51330.066983
60-0.128452-1.17730.121205


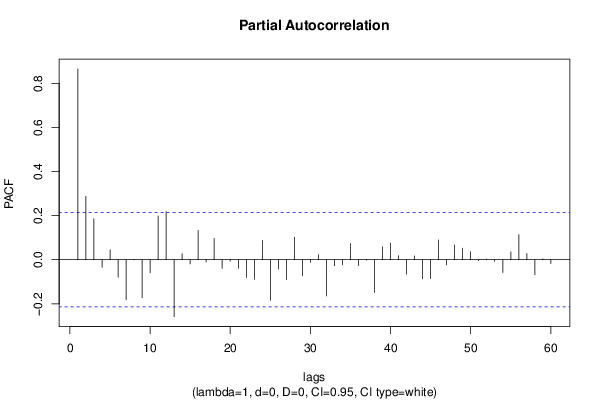
Partial Autocorrelation Function
Time lag kPACF(k)T-STATP-value
10.8653837.93140
20.2881732.64110.004926
30.1858841.70370.046071
4-0.033963-0.31130.378181
50.0444820.40770.342271
6-0.079963-0.73290.232839
7-0.182182-1.66970.049348
80.0015750.01440.494257
9-0.172679-1.58260.058632
10-0.059497-0.54530.293497
110.1984731.8190.036235
120.2182512.00030.024349
13-0.258399-2.36830.010084
140.0267430.24510.403486
15-0.018947-0.17370.431278
160.132511.21450.113986
17-0.010695-0.0980.461075
180.096320.88280.189936
19-0.039362-0.36080.359592
20-0.006526-0.05980.476224
21-0.038833-0.35590.361399
22-0.080472-0.73750.231426
23-0.088957-0.81530.208602
240.0873970.8010.212695
25-0.184746-1.69320.04706
26-0.042315-0.38780.349565
27-0.090521-0.82960.204548
280.1016810.93190.177023
29-0.072639-0.66580.253697
30-0.013084-0.11990.452418
310.0231460.21210.416258
32-0.164161-1.50460.068094
33-0.026926-0.24680.402841
34-0.022767-0.20870.417607
350.0737580.6760.250449
36-0.026554-0.24340.404157
37-0.00207-0.0190.492455
38-0.148606-1.3620.088421
390.0585620.53670.296438
400.0748370.68590.247335
410.0180980.16590.434329
42-0.06535-0.59890.275411
430.0169090.1550.438606
44-0.086866-0.79610.214099
45-0.085663-0.78510.217299
460.0896820.8220.206716
47-0.02358-0.21610.41471
480.0666470.61080.27148
490.0516570.47340.318563
500.036810.33740.36834
51-0.004439-0.04070.483822
520.0026020.02380.490517
53-0.00718-0.06580.473843
54-0.058058-0.53210.298027
550.0355750.32610.372598
560.113621.04130.150352
570.027990.25650.399082
58-0.068484-0.62770.265963
590.0038590.03540.485935
60-0.017152-0.15720.437733

\begin{tabular}{lllllllll}
\hline
Partial Autocorrelation Function \tabularnewline
Time lag k & PACF(k) & T-STAT & P-value \tabularnewline
1 & 0.865383 & 7.9314 & 0 \tabularnewline
2 & 0.288173 & 2.6411 & 0.004926 \tabularnewline
3 & 0.185884 & 1.7037 & 0.046071 \tabularnewline
4 & -0.033963 & -0.3113 & 0.378181 \tabularnewline
5 & 0.044482 & 0.4077 & 0.342271 \tabularnewline
6 & -0.079963 & -0.7329 & 0.232839 \tabularnewline
7 & -0.182182 & -1.6697 & 0.049348 \tabularnewline
8 & 0.001575 & 0.0144 & 0.494257 \tabularnewline
9 & -0.172679 & -1.5826 & 0.058632 \tabularnewline
10 & -0.059497 & -0.5453 & 0.293497 \tabularnewline
11 & 0.198473 & 1.819 & 0.036235 \tabularnewline
12 & 0.218251 & 2.0003 & 0.024349 \tabularnewline
13 & -0.258399 & -2.3683 & 0.010084 \tabularnewline
14 & 0.026743 & 0.2451 & 0.403486 \tabularnewline
15 & -0.018947 & -0.1737 & 0.431278 \tabularnewline
16 & 0.13251 & 1.2145 & 0.113986 \tabularnewline
17 & -0.010695 & -0.098 & 0.461075 \tabularnewline
18 & 0.09632 & 0.8828 & 0.189936 \tabularnewline
19 & -0.039362 & -0.3608 & 0.359592 \tabularnewline
20 & -0.006526 & -0.0598 & 0.476224 \tabularnewline
21 & -0.038833 & -0.3559 & 0.361399 \tabularnewline
22 & -0.080472 & -0.7375 & 0.231426 \tabularnewline
23 & -0.088957 & -0.8153 & 0.208602 \tabularnewline
24 & 0.087397 & 0.801 & 0.212695 \tabularnewline
25 & -0.184746 & -1.6932 & 0.04706 \tabularnewline
26 & -0.042315 & -0.3878 & 0.349565 \tabularnewline
27 & -0.090521 & -0.8296 & 0.204548 \tabularnewline
28 & 0.101681 & 0.9319 & 0.177023 \tabularnewline
29 & -0.072639 & -0.6658 & 0.253697 \tabularnewline
30 & -0.013084 & -0.1199 & 0.452418 \tabularnewline
31 & 0.023146 & 0.2121 & 0.416258 \tabularnewline
32 & -0.164161 & -1.5046 & 0.068094 \tabularnewline
33 & -0.026926 & -0.2468 & 0.402841 \tabularnewline
34 & -0.022767 & -0.2087 & 0.417607 \tabularnewline
35 & 0.073758 & 0.676 & 0.250449 \tabularnewline
36 & -0.026554 & -0.2434 & 0.404157 \tabularnewline
37 & -0.00207 & -0.019 & 0.492455 \tabularnewline
38 & -0.148606 & -1.362 & 0.088421 \tabularnewline
39 & 0.058562 & 0.5367 & 0.296438 \tabularnewline
40 & 0.074837 & 0.6859 & 0.247335 \tabularnewline
41 & 0.018098 & 0.1659 & 0.434329 \tabularnewline
42 & -0.06535 & -0.5989 & 0.275411 \tabularnewline
43 & 0.016909 & 0.155 & 0.438606 \tabularnewline
44 & -0.086866 & -0.7961 & 0.214099 \tabularnewline
45 & -0.085663 & -0.7851 & 0.217299 \tabularnewline
46 & 0.089682 & 0.822 & 0.206716 \tabularnewline
47 & -0.02358 & -0.2161 & 0.41471 \tabularnewline
48 & 0.066647 & 0.6108 & 0.27148 \tabularnewline
49 & 0.051657 & 0.4734 & 0.318563 \tabularnewline
50 & 0.03681 & 0.3374 & 0.36834 \tabularnewline
51 & -0.004439 & -0.0407 & 0.483822 \tabularnewline
52 & 0.002602 & 0.0238 & 0.490517 \tabularnewline
53 & -0.00718 & -0.0658 & 0.473843 \tabularnewline
54 & -0.058058 & -0.5321 & 0.298027 \tabularnewline
55 & 0.035575 & 0.3261 & 0.372598 \tabularnewline
56 & 0.11362 & 1.0413 & 0.150352 \tabularnewline
57 & 0.02799 & 0.2565 & 0.399082 \tabularnewline
58 & -0.068484 & -0.6277 & 0.265963 \tabularnewline
59 & 0.003859 & 0.0354 & 0.485935 \tabularnewline
60 & -0.017152 & -0.1572 & 0.437733 \tabularnewline
\hline
\end{tabular}
%Source: https://freestatistics.org/blog/index.php?pk=242355&T=2

[TABLE]
[ROW][C]Partial Autocorrelation Function[/C][/ROW]
[ROW][C]Time lag k[/C][C]PACF(k)[/C][C]T-STAT[/C][C]P-value[/C][/ROW]
[ROW][C]1[/C][C]0.865383[/C][C]7.9314[/C][C]0[/C][/ROW]
[ROW][C]2[/C][C]0.288173[/C][C]2.6411[/C][C]0.004926[/C][/ROW]
[ROW][C]3[/C][C]0.185884[/C][C]1.7037[/C][C]0.046071[/C][/ROW]
[ROW][C]4[/C][C]-0.033963[/C][C]-0.3113[/C][C]0.378181[/C][/ROW]
[ROW][C]5[/C][C]0.044482[/C][C]0.4077[/C][C]0.342271[/C][/ROW]
[ROW][C]6[/C][C]-0.079963[/C][C]-0.7329[/C][C]0.232839[/C][/ROW]
[ROW][C]7[/C][C]-0.182182[/C][C]-1.6697[/C][C]0.049348[/C][/ROW]
[ROW][C]8[/C][C]0.001575[/C][C]0.0144[/C][C]0.494257[/C][/ROW]
[ROW][C]9[/C][C]-0.172679[/C][C]-1.5826[/C][C]0.058632[/C][/ROW]
[ROW][C]10[/C][C]-0.059497[/C][C]-0.5453[/C][C]0.293497[/C][/ROW]
[ROW][C]11[/C][C]0.198473[/C][C]1.819[/C][C]0.036235[/C][/ROW]
[ROW][C]12[/C][C]0.218251[/C][C]2.0003[/C][C]0.024349[/C][/ROW]
[ROW][C]13[/C][C]-0.258399[/C][C]-2.3683[/C][C]0.010084[/C][/ROW]
[ROW][C]14[/C][C]0.026743[/C][C]0.2451[/C][C]0.403486[/C][/ROW]
[ROW][C]15[/C][C]-0.018947[/C][C]-0.1737[/C][C]0.431278[/C][/ROW]
[ROW][C]16[/C][C]0.13251[/C][C]1.2145[/C][C]0.113986[/C][/ROW]
[ROW][C]17[/C][C]-0.010695[/C][C]-0.098[/C][C]0.461075[/C][/ROW]
[ROW][C]18[/C][C]0.09632[/C][C]0.8828[/C][C]0.189936[/C][/ROW]
[ROW][C]19[/C][C]-0.039362[/C][C]-0.3608[/C][C]0.359592[/C][/ROW]
[ROW][C]20[/C][C]-0.006526[/C][C]-0.0598[/C][C]0.476224[/C][/ROW]
[ROW][C]21[/C][C]-0.038833[/C][C]-0.3559[/C][C]0.361399[/C][/ROW]
[ROW][C]22[/C][C]-0.080472[/C][C]-0.7375[/C][C]0.231426[/C][/ROW]
[ROW][C]23[/C][C]-0.088957[/C][C]-0.8153[/C][C]0.208602[/C][/ROW]
[ROW][C]24[/C][C]0.087397[/C][C]0.801[/C][C]0.212695[/C][/ROW]
[ROW][C]25[/C][C]-0.184746[/C][C]-1.6932[/C][C]0.04706[/C][/ROW]
[ROW][C]26[/C][C]-0.042315[/C][C]-0.3878[/C][C]0.349565[/C][/ROW]
[ROW][C]27[/C][C]-0.090521[/C][C]-0.8296[/C][C]0.204548[/C][/ROW]
[ROW][C]28[/C][C]0.101681[/C][C]0.9319[/C][C]0.177023[/C][/ROW]
[ROW][C]29[/C][C]-0.072639[/C][C]-0.6658[/C][C]0.253697[/C][/ROW]
[ROW][C]30[/C][C]-0.013084[/C][C]-0.1199[/C][C]0.452418[/C][/ROW]
[ROW][C]31[/C][C]0.023146[/C][C]0.2121[/C][C]0.416258[/C][/ROW]
[ROW][C]32[/C][C]-0.164161[/C][C]-1.5046[/C][C]0.068094[/C][/ROW]
[ROW][C]33[/C][C]-0.026926[/C][C]-0.2468[/C][C]0.402841[/C][/ROW]
[ROW][C]34[/C][C]-0.022767[/C][C]-0.2087[/C][C]0.417607[/C][/ROW]
[ROW][C]35[/C][C]0.073758[/C][C]0.676[/C][C]0.250449[/C][/ROW]
[ROW][C]36[/C][C]-0.026554[/C][C]-0.2434[/C][C]0.404157[/C][/ROW]
[ROW][C]37[/C][C]-0.00207[/C][C]-0.019[/C][C]0.492455[/C][/ROW]
[ROW][C]38[/C][C]-0.148606[/C][C]-1.362[/C][C]0.088421[/C][/ROW]
[ROW][C]39[/C][C]0.058562[/C][C]0.5367[/C][C]0.296438[/C][/ROW]
[ROW][C]40[/C][C]0.074837[/C][C]0.6859[/C][C]0.247335[/C][/ROW]
[ROW][C]41[/C][C]0.018098[/C][C]0.1659[/C][C]0.434329[/C][/ROW]
[ROW][C]42[/C][C]-0.06535[/C][C]-0.5989[/C][C]0.275411[/C][/ROW]
[ROW][C]43[/C][C]0.016909[/C][C]0.155[/C][C]0.438606[/C][/ROW]
[ROW][C]44[/C][C]-0.086866[/C][C]-0.7961[/C][C]0.214099[/C][/ROW]
[ROW][C]45[/C][C]-0.085663[/C][C]-0.7851[/C][C]0.217299[/C][/ROW]
[ROW][C]46[/C][C]0.089682[/C][C]0.822[/C][C]0.206716[/C][/ROW]
[ROW][C]47[/C][C]-0.02358[/C][C]-0.2161[/C][C]0.41471[/C][/ROW]
[ROW][C]48[/C][C]0.066647[/C][C]0.6108[/C][C]0.27148[/C][/ROW]
[ROW][C]49[/C][C]0.051657[/C][C]0.4734[/C][C]0.318563[/C][/ROW]
[ROW][C]50[/C][C]0.03681[/C][C]0.3374[/C][C]0.36834[/C][/ROW]
[ROW][C]51[/C][C]-0.004439[/C][C]-0.0407[/C][C]0.483822[/C][/ROW]
[ROW][C]52[/C][C]0.002602[/C][C]0.0238[/C][C]0.490517[/C][/ROW]
[ROW][C]53[/C][C]-0.00718[/C][C]-0.0658[/C][C]0.473843[/C][/ROW]
[ROW][C]54[/C][C]-0.058058[/C][C]-0.5321[/C][C]0.298027[/C][/ROW]
[ROW][C]55[/C][C]0.035575[/C][C]0.3261[/C][C]0.372598[/C][/ROW]
[ROW][C]56[/C][C]0.11362[/C][C]1.0413[/C][C]0.150352[/C][/ROW]
[ROW][C]57[/C][C]0.02799[/C][C]0.2565[/C][C]0.399082[/C][/ROW]
[ROW][C]58[/C][C]-0.068484[/C][C]-0.6277[/C][C]0.265963[/C][/ROW]
[ROW][C]59[/C][C]0.003859[/C][C]0.0354[/C][C]0.485935[/C][/ROW]
[ROW][C]60[/C][C]-0.017152[/C][C]-0.1572[/C][C]0.437733[/C][/ROW]
[/TABLE]
Source: https://freestatistics.org/blog/index.php?pk=242355&T=2

Globally Unique Identifier (entire table): ba.freestatistics.org/blog/index.php?pk=242355&T=2

As an alternative you can also use a QR Code:  

The GUIDs for individual cells are displayed in the table below:

Partial Autocorrelation Function
Time lag kPACF(k)T-STATP-value
10.8653837.93140
20.2881732.64110.004926
30.1858841.70370.046071
4-0.033963-0.31130.378181
50.0444820.40770.342271
6-0.079963-0.73290.232839
7-0.182182-1.66970.049348
80.0015750.01440.494257
9-0.172679-1.58260.058632
10-0.059497-0.54530.293497
110.1984731.8190.036235
120.2182512.00030.024349
13-0.258399-2.36830.010084
140.0267430.24510.403486
15-0.018947-0.17370.431278
160.132511.21450.113986
17-0.010695-0.0980.461075
180.096320.88280.189936
19-0.039362-0.36080.359592
20-0.006526-0.05980.476224
21-0.038833-0.35590.361399
22-0.080472-0.73750.231426
23-0.088957-0.81530.208602
240.0873970.8010.212695
25-0.184746-1.69320.04706
26-0.042315-0.38780.349565
27-0.090521-0.82960.204548
280.1016810.93190.177023
29-0.072639-0.66580.253697
30-0.013084-0.11990.452418
310.0231460.21210.416258
32-0.164161-1.50460.068094
33-0.026926-0.24680.402841
34-0.022767-0.20870.417607
350.0737580.6760.250449
36-0.026554-0.24340.404157
37-0.00207-0.0190.492455
38-0.148606-1.3620.088421
390.0585620.53670.296438
400.0748370.68590.247335
410.0180980.16590.434329
42-0.06535-0.59890.275411
430.0169090.1550.438606
44-0.086866-0.79610.214099
45-0.085663-0.78510.217299
460.0896820.8220.206716
47-0.02358-0.21610.41471
480.0666470.61080.27148
490.0516570.47340.318563
500.036810.33740.36834
51-0.004439-0.04070.483822
520.0026020.02380.490517
53-0.00718-0.06580.473843
54-0.058058-0.53210.298027
550.0355750.32610.372598
560.113621.04130.150352
570.027990.25650.399082
58-0.068484-0.62770.265963
590.0038590.03540.485935
60-0.017152-0.15720.437733


Parameters (Session):
par1 = 60 ; par2 = 1 ; par3 = 0 ; par4 = 0 ; par5 = 12 ; par6 = White Noise ; par7 = 0.95 ;
Parameters (R input):
par1 = 60 ; par2 = 1 ; par3 = 0 ; par4 = 0 ; par5 = 12 ; par6 = White Noise ; par7 = 0.95 ; par8 = ;
R code (references can be found in the software module):
if (par1 == 'Default') {
par1 = 10*log10(length(x))
} else {
par1 <- as.numeric(par1)
}
par2 <- as.numeric(par2)
par3 <- as.numeric(par3)
par4 <- as.numeric(par4)
par5 <- as.numeric(par5)
if (par6 == 'White Noise') par6 <- 'white' else par6 <- 'ma'
par7 <- as.numeric(par7)
if (par8 != '') par8 <- as.numeric(par8)
ox <- x
if (par8 == '') {
if (par2 == 0) {
x <- log(x)
} else {
x <- (x ^ par2 - 1) / par2
}
} else {
x <- log(x,base=par8)
}
if (par3 > 0) x <- diff(x,lag=1,difference=par3)
if (par4 > 0) x <- diff(x,lag=par5,difference=par4)
bitmap(file='picts.png')
op <- par(mfrow=c(2,1))
plot(ox,type='l',main='Original Time Series',xlab='time',ylab='value')
if (par8=='') {
mytitle <- paste('Working Time Series (lambda=',par2,', d=',par3,', D=',par4,')',sep='')
mysub <- paste('(lambda=',par2,', d=',par3,', D=',par4,', CI=', par7, ', CI type=',par6,')',sep='')
} else {
mytitle <- paste('Working Time Series (base=',par8,', d=',par3,', D=',par4,')',sep='')
mysub <- paste('(base=',par8,', d=',par3,', D=',par4,', CI=', par7, ', CI type=',par6,')',sep='')
}
plot(x,type='l', main=mytitle,xlab='time',ylab='value')
par(op)
dev.off()
bitmap(file='pic1.png')
racf <- acf(x, par1, main='Autocorrelation', xlab='time lag', ylab='ACF', ci.type=par6, ci=par7, sub=mysub)
dev.off()
bitmap(file='pic2.png')
rpacf <- pacf(x,par1,main='Partial Autocorrelation',xlab='lags',ylab='PACF',sub=mysub)
dev.off()
(myacf <- c(racf$acf))
(mypacf <- c(rpacf$acf))
lengthx <- length(x)
sqrtn <- sqrt(lengthx)
load(file='createtable')
a<-table.start()
a<-table.row.start(a)
a<-table.element(a,'Autocorrelation Function',4,TRUE)
a<-table.row.end(a)
a<-table.row.start(a)
a<-table.element(a,'Time lag k',header=TRUE)
a<-table.element(a,hyperlink('basics.htm','ACF(k)','click here for more information about the Autocorrelation Function'),header=TRUE)
a<-table.element(a,'T-STAT',header=TRUE)
a<-table.element(a,'P-value',header=TRUE)
a<-table.row.end(a)
for (i in 2:(par1+1)) {
a<-table.row.start(a)
a<-table.element(a,i-1,header=TRUE)
a<-table.element(a,round(myacf[i],6))
mytstat <- myacf[i]*sqrtn
a<-table.element(a,round(mytstat,4))
a<-table.element(a,round(1-pt(abs(mytstat),lengthx),6))
a<-table.row.end(a)
}
a<-table.end(a)
table.save(a,file='mytable.tab')
a<-table.start()
a<-table.row.start(a)
a<-table.element(a,'Partial Autocorrelation Function',4,TRUE)
a<-table.row.end(a)
a<-table.row.start(a)
a<-table.element(a,'Time lag k',header=TRUE)
a<-table.element(a,hyperlink('basics.htm','PACF(k)','click here for more information about the Partial Autocorrelation Function'),header=TRUE)
a<-table.element(a,'T-STAT',header=TRUE)
a<-table.element(a,'P-value',header=TRUE)
a<-table.row.end(a)
for (i in 1:par1) {
a<-table.row.start(a)
a<-table.element(a,i,header=TRUE)
a<-table.element(a,round(mypacf[i],6))
mytstat <- mypacf[i]*sqrtn
a<-table.element(a,round(mytstat,4))
a<-table.element(a,round(1-pt(abs(mytstat),lengthx),6))
a<-table.row.end(a)
}
a<-table.end(a)
table.save(a,file='mytable1.tab')