Free Statistics

of Irreproducible Research!

Author's title

Author*Unverified author*
R Software Modulerwasp_autocorrelation.wasp
Title produced by software(Partial) Autocorrelation Function
Date of computationThu, 16 Oct 2014 13:40:35 +0100
Cite this page as followsStatistical Computations at FreeStatistics.org, Office for Research Development and Education, URL https://freestatistics.org/blog/index.php?v=date/2014/Oct/16/t1413463262ci520jczlt96gta.htm/, Retrieved Sun, 12 May 2024 22:03:21 +0000
Statistical Computations at FreeStatistics.org, Office for Research Development and Education, URL https://freestatistics.org/blog/index.php?pk=242336, Retrieved Sun, 12 May 2024 22:03:21 +0000
QR Codes:

Original text written by user:
IsPrivate?No (this computation is public)
User-defined keywords
Estimated Impact59
Family? (F = Feedback message, R = changed R code, M = changed R Module, P = changed Parameters, D = changed Data)
-       [(Partial) Autocorrelation Function] [] [2014-10-16 12:40:35] [4f675b9afdd3602a3170287ae908b245] [Current]
Feedback Forum

Post a new message
Dataseries X:
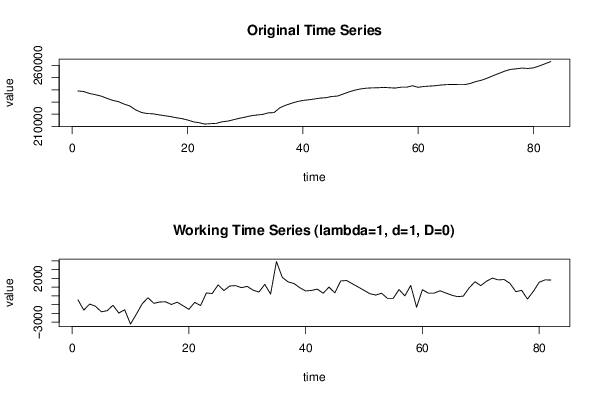
239050
238600
236980
236050
234870
233060
231370
230300
228340
226760
223550
221460
220560
220350
219500
218800
218130
217150
216430
215310
213780
213040
211940
212270
212540
213790
214400
215520
216690
217630
218710
219360
219800
221110
221320
225230
227340
228930
230340
231270
231830
232450
233220
233520
234520
234860
236560
238310
239690
240700
241330
241580
241670
241970
241690
241410
242130
242130
243320
242030
242740
243050
243360
243940
244270
244350
244260
244230
245130
246740
247910
249590
251610
253430
255290
256710
257190
257820
257460
257970
259520
261340
263150


Summary of computational transaction
Raw Inputview raw input (R code)
Raw Outputview raw output of R engine
Computing time1 seconds
R Server'Herman Ole Andreas Wold' @ wold.wessa.net

\begin{tabular}{lllllllll}
\hline
Summary of computational transaction \tabularnewline
Raw Input & view raw input (R code)  \tabularnewline
Raw Output & view raw output of R engine  \tabularnewline
Computing time & 1 seconds \tabularnewline
R Server & 'Herman Ole Andreas Wold' @ wold.wessa.net \tabularnewline
\hline
\end{tabular}
%Source: https://freestatistics.org/blog/index.php?pk=242336&T=0

[TABLE]
[ROW][C]Summary of computational transaction[/C][/ROW]
[ROW][C]Raw Input[/C][C]view raw input (R code) [/C][/ROW]
[ROW][C]Raw Output[/C][C]view raw output of R engine [/C][/ROW]
[ROW][C]Computing time[/C][C]1 seconds[/C][/ROW]
[ROW][C]R Server[/C][C]'Herman Ole Andreas Wold' @ wold.wessa.net[/C][/ROW]
[/TABLE]
Source: https://freestatistics.org/blog/index.php?pk=242336&T=0

Globally Unique Identifier (entire table): ba.freestatistics.org/blog/index.php?pk=242336&T=0

As an alternative you can also use a QR Code:  

The GUIDs for individual cells are displayed in the table below:

Summary of computational transaction
Raw Inputview raw input (R code)
Raw Outputview raw output of R engine
Computing time1 seconds
R Server'Herman Ole Andreas Wold' @ wold.wessa.net


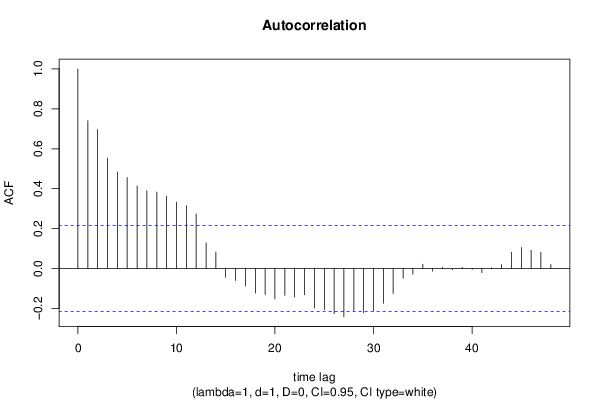
Autocorrelation Function
Time lag kACF(k)T-STATP-value
10.7399996.7010
20.6968176.30990
30.5530655.00822e-06
40.4839414.38231.7e-05
50.4562114.13124.3e-05
60.4131683.74140.000169
70.3892743.5250.000348
80.38333.47090.000415
90.3618663.27680.00077
100.3325873.01170.001727
110.3157942.85960.002689
120.2726522.4690.007814
130.1283631.16240.124226
140.082220.74450.229341
15-0.044196-0.40020.34502
16-0.060743-0.55010.291889
17-0.088317-0.79970.213085
18-0.123222-1.11580.133878
19-0.130189-1.17890.120921
20-0.152315-1.37930.08578
21-0.13431-1.21620.113693
22-0.143183-1.29660.099206
23-0.131396-1.18980.118771
24-0.198611-1.79850.037889
25-0.206405-1.86910.032591
26-0.226357-2.04980.021792
27-0.241516-2.1870.015795
28-0.21111-1.91170.029705
29-0.222168-2.01180.023762
30-0.211644-1.91650.029392
31-0.174627-1.58130.058828
32-0.125462-1.13610.129611
33-0.048777-0.44170.329937
34-0.028589-0.25890.398187
350.020970.18990.42493
36-0.013466-0.12190.451622
370.0058390.05290.47898
38-0.006088-0.05510.478086
390.0059530.05390.478569
40-0.004396-0.03980.484172
41-0.020843-0.18870.425382
420.0036960.03350.486691
430.0191480.17340.431387
440.0817380.74020.230656
450.1048660.94960.172553
460.0909120.82320.20638
470.0810580.7340.232518
480.0200130.18120.428317

\begin{tabular}{lllllllll}
\hline
Autocorrelation Function \tabularnewline
Time lag k & ACF(k) & T-STAT & P-value \tabularnewline
1 & 0.739999 & 6.701 & 0 \tabularnewline
2 & 0.696817 & 6.3099 & 0 \tabularnewline
3 & 0.553065 & 5.0082 & 2e-06 \tabularnewline
4 & 0.483941 & 4.3823 & 1.7e-05 \tabularnewline
5 & 0.456211 & 4.1312 & 4.3e-05 \tabularnewline
6 & 0.413168 & 3.7414 & 0.000169 \tabularnewline
7 & 0.389274 & 3.525 & 0.000348 \tabularnewline
8 & 0.3833 & 3.4709 & 0.000415 \tabularnewline
9 & 0.361866 & 3.2768 & 0.00077 \tabularnewline
10 & 0.332587 & 3.0117 & 0.001727 \tabularnewline
11 & 0.315794 & 2.8596 & 0.002689 \tabularnewline
12 & 0.272652 & 2.469 & 0.007814 \tabularnewline
13 & 0.128363 & 1.1624 & 0.124226 \tabularnewline
14 & 0.08222 & 0.7445 & 0.229341 \tabularnewline
15 & -0.044196 & -0.4002 & 0.34502 \tabularnewline
16 & -0.060743 & -0.5501 & 0.291889 \tabularnewline
17 & -0.088317 & -0.7997 & 0.213085 \tabularnewline
18 & -0.123222 & -1.1158 & 0.133878 \tabularnewline
19 & -0.130189 & -1.1789 & 0.120921 \tabularnewline
20 & -0.152315 & -1.3793 & 0.08578 \tabularnewline
21 & -0.13431 & -1.2162 & 0.113693 \tabularnewline
22 & -0.143183 & -1.2966 & 0.099206 \tabularnewline
23 & -0.131396 & -1.1898 & 0.118771 \tabularnewline
24 & -0.198611 & -1.7985 & 0.037889 \tabularnewline
25 & -0.206405 & -1.8691 & 0.032591 \tabularnewline
26 & -0.226357 & -2.0498 & 0.021792 \tabularnewline
27 & -0.241516 & -2.187 & 0.015795 \tabularnewline
28 & -0.21111 & -1.9117 & 0.029705 \tabularnewline
29 & -0.222168 & -2.0118 & 0.023762 \tabularnewline
30 & -0.211644 & -1.9165 & 0.029392 \tabularnewline
31 & -0.174627 & -1.5813 & 0.058828 \tabularnewline
32 & -0.125462 & -1.1361 & 0.129611 \tabularnewline
33 & -0.048777 & -0.4417 & 0.329937 \tabularnewline
34 & -0.028589 & -0.2589 & 0.398187 \tabularnewline
35 & 0.02097 & 0.1899 & 0.42493 \tabularnewline
36 & -0.013466 & -0.1219 & 0.451622 \tabularnewline
37 & 0.005839 & 0.0529 & 0.47898 \tabularnewline
38 & -0.006088 & -0.0551 & 0.478086 \tabularnewline
39 & 0.005953 & 0.0539 & 0.478569 \tabularnewline
40 & -0.004396 & -0.0398 & 0.484172 \tabularnewline
41 & -0.020843 & -0.1887 & 0.425382 \tabularnewline
42 & 0.003696 & 0.0335 & 0.486691 \tabularnewline
43 & 0.019148 & 0.1734 & 0.431387 \tabularnewline
44 & 0.081738 & 0.7402 & 0.230656 \tabularnewline
45 & 0.104866 & 0.9496 & 0.172553 \tabularnewline
46 & 0.090912 & 0.8232 & 0.20638 \tabularnewline
47 & 0.081058 & 0.734 & 0.232518 \tabularnewline
48 & 0.020013 & 0.1812 & 0.428317 \tabularnewline
\hline
\end{tabular}
%Source: https://freestatistics.org/blog/index.php?pk=242336&T=1

[TABLE]
[ROW][C]Autocorrelation Function[/C][/ROW]
[ROW][C]Time lag k[/C][C]ACF(k)[/C][C]T-STAT[/C][C]P-value[/C][/ROW]
[ROW][C]1[/C][C]0.739999[/C][C]6.701[/C][C]0[/C][/ROW]
[ROW][C]2[/C][C]0.696817[/C][C]6.3099[/C][C]0[/C][/ROW]
[ROW][C]3[/C][C]0.553065[/C][C]5.0082[/C][C]2e-06[/C][/ROW]
[ROW][C]4[/C][C]0.483941[/C][C]4.3823[/C][C]1.7e-05[/C][/ROW]
[ROW][C]5[/C][C]0.456211[/C][C]4.1312[/C][C]4.3e-05[/C][/ROW]
[ROW][C]6[/C][C]0.413168[/C][C]3.7414[/C][C]0.000169[/C][/ROW]
[ROW][C]7[/C][C]0.389274[/C][C]3.525[/C][C]0.000348[/C][/ROW]
[ROW][C]8[/C][C]0.3833[/C][C]3.4709[/C][C]0.000415[/C][/ROW]
[ROW][C]9[/C][C]0.361866[/C][C]3.2768[/C][C]0.00077[/C][/ROW]
[ROW][C]10[/C][C]0.332587[/C][C]3.0117[/C][C]0.001727[/C][/ROW]
[ROW][C]11[/C][C]0.315794[/C][C]2.8596[/C][C]0.002689[/C][/ROW]
[ROW][C]12[/C][C]0.272652[/C][C]2.469[/C][C]0.007814[/C][/ROW]
[ROW][C]13[/C][C]0.128363[/C][C]1.1624[/C][C]0.124226[/C][/ROW]
[ROW][C]14[/C][C]0.08222[/C][C]0.7445[/C][C]0.229341[/C][/ROW]
[ROW][C]15[/C][C]-0.044196[/C][C]-0.4002[/C][C]0.34502[/C][/ROW]
[ROW][C]16[/C][C]-0.060743[/C][C]-0.5501[/C][C]0.291889[/C][/ROW]
[ROW][C]17[/C][C]-0.088317[/C][C]-0.7997[/C][C]0.213085[/C][/ROW]
[ROW][C]18[/C][C]-0.123222[/C][C]-1.1158[/C][C]0.133878[/C][/ROW]
[ROW][C]19[/C][C]-0.130189[/C][C]-1.1789[/C][C]0.120921[/C][/ROW]
[ROW][C]20[/C][C]-0.152315[/C][C]-1.3793[/C][C]0.08578[/C][/ROW]
[ROW][C]21[/C][C]-0.13431[/C][C]-1.2162[/C][C]0.113693[/C][/ROW]
[ROW][C]22[/C][C]-0.143183[/C][C]-1.2966[/C][C]0.099206[/C][/ROW]
[ROW][C]23[/C][C]-0.131396[/C][C]-1.1898[/C][C]0.118771[/C][/ROW]
[ROW][C]24[/C][C]-0.198611[/C][C]-1.7985[/C][C]0.037889[/C][/ROW]
[ROW][C]25[/C][C]-0.206405[/C][C]-1.8691[/C][C]0.032591[/C][/ROW]
[ROW][C]26[/C][C]-0.226357[/C][C]-2.0498[/C][C]0.021792[/C][/ROW]
[ROW][C]27[/C][C]-0.241516[/C][C]-2.187[/C][C]0.015795[/C][/ROW]
[ROW][C]28[/C][C]-0.21111[/C][C]-1.9117[/C][C]0.029705[/C][/ROW]
[ROW][C]29[/C][C]-0.222168[/C][C]-2.0118[/C][C]0.023762[/C][/ROW]
[ROW][C]30[/C][C]-0.211644[/C][C]-1.9165[/C][C]0.029392[/C][/ROW]
[ROW][C]31[/C][C]-0.174627[/C][C]-1.5813[/C][C]0.058828[/C][/ROW]
[ROW][C]32[/C][C]-0.125462[/C][C]-1.1361[/C][C]0.129611[/C][/ROW]
[ROW][C]33[/C][C]-0.048777[/C][C]-0.4417[/C][C]0.329937[/C][/ROW]
[ROW][C]34[/C][C]-0.028589[/C][C]-0.2589[/C][C]0.398187[/C][/ROW]
[ROW][C]35[/C][C]0.02097[/C][C]0.1899[/C][C]0.42493[/C][/ROW]
[ROW][C]36[/C][C]-0.013466[/C][C]-0.1219[/C][C]0.451622[/C][/ROW]
[ROW][C]37[/C][C]0.005839[/C][C]0.0529[/C][C]0.47898[/C][/ROW]
[ROW][C]38[/C][C]-0.006088[/C][C]-0.0551[/C][C]0.478086[/C][/ROW]
[ROW][C]39[/C][C]0.005953[/C][C]0.0539[/C][C]0.478569[/C][/ROW]
[ROW][C]40[/C][C]-0.004396[/C][C]-0.0398[/C][C]0.484172[/C][/ROW]
[ROW][C]41[/C][C]-0.020843[/C][C]-0.1887[/C][C]0.425382[/C][/ROW]
[ROW][C]42[/C][C]0.003696[/C][C]0.0335[/C][C]0.486691[/C][/ROW]
[ROW][C]43[/C][C]0.019148[/C][C]0.1734[/C][C]0.431387[/C][/ROW]
[ROW][C]44[/C][C]0.081738[/C][C]0.7402[/C][C]0.230656[/C][/ROW]
[ROW][C]45[/C][C]0.104866[/C][C]0.9496[/C][C]0.172553[/C][/ROW]
[ROW][C]46[/C][C]0.090912[/C][C]0.8232[/C][C]0.20638[/C][/ROW]
[ROW][C]47[/C][C]0.081058[/C][C]0.734[/C][C]0.232518[/C][/ROW]
[ROW][C]48[/C][C]0.020013[/C][C]0.1812[/C][C]0.428317[/C][/ROW]
[/TABLE]
Source: https://freestatistics.org/blog/index.php?pk=242336&T=1

Globally Unique Identifier (entire table): ba.freestatistics.org/blog/index.php?pk=242336&T=1

As an alternative you can also use a QR Code:  

The GUIDs for individual cells are displayed in the table below:

Autocorrelation Function
Time lag kACF(k)T-STATP-value
10.7399996.7010
20.6968176.30990
30.5530655.00822e-06
40.4839414.38231.7e-05
50.4562114.13124.3e-05
60.4131683.74140.000169
70.3892743.5250.000348
80.38333.47090.000415
90.3618663.27680.00077
100.3325873.01170.001727
110.3157942.85960.002689
120.2726522.4690.007814
130.1283631.16240.124226
140.082220.74450.229341
15-0.044196-0.40020.34502
16-0.060743-0.55010.291889
17-0.088317-0.79970.213085
18-0.123222-1.11580.133878
19-0.130189-1.17890.120921
20-0.152315-1.37930.08578
21-0.13431-1.21620.113693
22-0.143183-1.29660.099206
23-0.131396-1.18980.118771
24-0.198611-1.79850.037889
25-0.206405-1.86910.032591
26-0.226357-2.04980.021792
27-0.241516-2.1870.015795
28-0.21111-1.91170.029705
29-0.222168-2.01180.023762
30-0.211644-1.91650.029392
31-0.174627-1.58130.058828
32-0.125462-1.13610.129611
33-0.048777-0.44170.329937
34-0.028589-0.25890.398187
350.020970.18990.42493
36-0.013466-0.12190.451622
370.0058390.05290.47898
38-0.006088-0.05510.478086
390.0059530.05390.478569
40-0.004396-0.03980.484172
41-0.020843-0.18870.425382
420.0036960.03350.486691
430.0191480.17340.431387
440.0817380.74020.230656
450.1048660.94960.172553
460.0909120.82320.20638
470.0810580.7340.232518
480.0200130.18120.428317


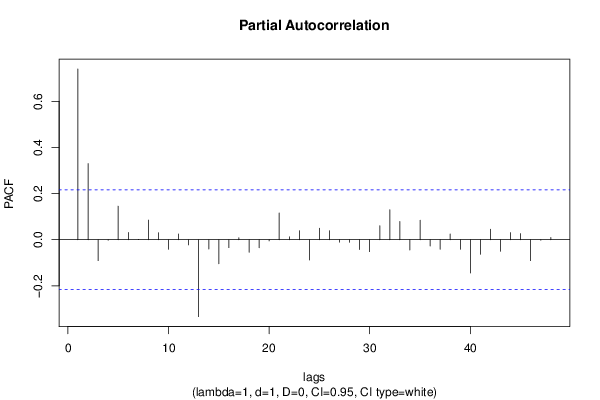
Partial Autocorrelation Function
Time lag kPACF(k)T-STATP-value
10.7399996.7010
20.3298352.98680.001859
3-0.090726-0.82160.206855
4-0.002338-0.02120.491581
50.1453961.31660.095817
60.0309040.27980.39015
70.0007850.00710.497174
80.0849570.76930.221957
90.0302010.27350.392585
10-0.041726-0.37780.353261
110.0249270.22570.410989
12-0.022598-0.20460.419184
13-0.333514-3.02010.001684
14-0.040672-0.36830.356798
15-0.104518-0.94650.173349
16-0.034567-0.3130.377531
170.0084890.07690.469455
18-0.054245-0.49120.312295
19-0.035211-0.31890.375324
20-0.005148-0.04660.481464
210.1156361.04710.149058
220.0123110.11150.455755
230.0386310.34980.363686
24-0.087819-0.79520.214387
250.0493390.44680.328105
260.0389540.35270.362592
27-0.010644-0.09640.461726
28-0.010935-0.0990.460681
29-0.042754-0.38720.349822
30-0.051625-0.46750.320698
310.060850.5510.29156
320.1301841.17890.12093
330.0790050.71540.238191
34-0.044668-0.40450.343453
350.0846530.76660.222771
36-0.027526-0.24930.401891
37-0.041368-0.37460.354461
380.0244660.22150.412608
39-0.041593-0.37660.353706
40-0.144299-1.30670.097486
41-0.06282-0.56890.285504
420.0452970.41020.341372
43-0.050444-0.45680.324516
440.0308340.27920.390391
450.0264190.23920.405761
46-0.090665-0.8210.207012
47-0.002124-0.01920.492352
480.0097540.08830.464917

\begin{tabular}{lllllllll}
\hline
Partial Autocorrelation Function \tabularnewline
Time lag k & PACF(k) & T-STAT & P-value \tabularnewline
1 & 0.739999 & 6.701 & 0 \tabularnewline
2 & 0.329835 & 2.9868 & 0.001859 \tabularnewline
3 & -0.090726 & -0.8216 & 0.206855 \tabularnewline
4 & -0.002338 & -0.0212 & 0.491581 \tabularnewline
5 & 0.145396 & 1.3166 & 0.095817 \tabularnewline
6 & 0.030904 & 0.2798 & 0.39015 \tabularnewline
7 & 0.000785 & 0.0071 & 0.497174 \tabularnewline
8 & 0.084957 & 0.7693 & 0.221957 \tabularnewline
9 & 0.030201 & 0.2735 & 0.392585 \tabularnewline
10 & -0.041726 & -0.3778 & 0.353261 \tabularnewline
11 & 0.024927 & 0.2257 & 0.410989 \tabularnewline
12 & -0.022598 & -0.2046 & 0.419184 \tabularnewline
13 & -0.333514 & -3.0201 & 0.001684 \tabularnewline
14 & -0.040672 & -0.3683 & 0.356798 \tabularnewline
15 & -0.104518 & -0.9465 & 0.173349 \tabularnewline
16 & -0.034567 & -0.313 & 0.377531 \tabularnewline
17 & 0.008489 & 0.0769 & 0.469455 \tabularnewline
18 & -0.054245 & -0.4912 & 0.312295 \tabularnewline
19 & -0.035211 & -0.3189 & 0.375324 \tabularnewline
20 & -0.005148 & -0.0466 & 0.481464 \tabularnewline
21 & 0.115636 & 1.0471 & 0.149058 \tabularnewline
22 & 0.012311 & 0.1115 & 0.455755 \tabularnewline
23 & 0.038631 & 0.3498 & 0.363686 \tabularnewline
24 & -0.087819 & -0.7952 & 0.214387 \tabularnewline
25 & 0.049339 & 0.4468 & 0.328105 \tabularnewline
26 & 0.038954 & 0.3527 & 0.362592 \tabularnewline
27 & -0.010644 & -0.0964 & 0.461726 \tabularnewline
28 & -0.010935 & -0.099 & 0.460681 \tabularnewline
29 & -0.042754 & -0.3872 & 0.349822 \tabularnewline
30 & -0.051625 & -0.4675 & 0.320698 \tabularnewline
31 & 0.06085 & 0.551 & 0.29156 \tabularnewline
32 & 0.130184 & 1.1789 & 0.12093 \tabularnewline
33 & 0.079005 & 0.7154 & 0.238191 \tabularnewline
34 & -0.044668 & -0.4045 & 0.343453 \tabularnewline
35 & 0.084653 & 0.7666 & 0.222771 \tabularnewline
36 & -0.027526 & -0.2493 & 0.401891 \tabularnewline
37 & -0.041368 & -0.3746 & 0.354461 \tabularnewline
38 & 0.024466 & 0.2215 & 0.412608 \tabularnewline
39 & -0.041593 & -0.3766 & 0.353706 \tabularnewline
40 & -0.144299 & -1.3067 & 0.097486 \tabularnewline
41 & -0.06282 & -0.5689 & 0.285504 \tabularnewline
42 & 0.045297 & 0.4102 & 0.341372 \tabularnewline
43 & -0.050444 & -0.4568 & 0.324516 \tabularnewline
44 & 0.030834 & 0.2792 & 0.390391 \tabularnewline
45 & 0.026419 & 0.2392 & 0.405761 \tabularnewline
46 & -0.090665 & -0.821 & 0.207012 \tabularnewline
47 & -0.002124 & -0.0192 & 0.492352 \tabularnewline
48 & 0.009754 & 0.0883 & 0.464917 \tabularnewline
\hline
\end{tabular}
%Source: https://freestatistics.org/blog/index.php?pk=242336&T=2

[TABLE]
[ROW][C]Partial Autocorrelation Function[/C][/ROW]
[ROW][C]Time lag k[/C][C]PACF(k)[/C][C]T-STAT[/C][C]P-value[/C][/ROW]
[ROW][C]1[/C][C]0.739999[/C][C]6.701[/C][C]0[/C][/ROW]
[ROW][C]2[/C][C]0.329835[/C][C]2.9868[/C][C]0.001859[/C][/ROW]
[ROW][C]3[/C][C]-0.090726[/C][C]-0.8216[/C][C]0.206855[/C][/ROW]
[ROW][C]4[/C][C]-0.002338[/C][C]-0.0212[/C][C]0.491581[/C][/ROW]
[ROW][C]5[/C][C]0.145396[/C][C]1.3166[/C][C]0.095817[/C][/ROW]
[ROW][C]6[/C][C]0.030904[/C][C]0.2798[/C][C]0.39015[/C][/ROW]
[ROW][C]7[/C][C]0.000785[/C][C]0.0071[/C][C]0.497174[/C][/ROW]
[ROW][C]8[/C][C]0.084957[/C][C]0.7693[/C][C]0.221957[/C][/ROW]
[ROW][C]9[/C][C]0.030201[/C][C]0.2735[/C][C]0.392585[/C][/ROW]
[ROW][C]10[/C][C]-0.041726[/C][C]-0.3778[/C][C]0.353261[/C][/ROW]
[ROW][C]11[/C][C]0.024927[/C][C]0.2257[/C][C]0.410989[/C][/ROW]
[ROW][C]12[/C][C]-0.022598[/C][C]-0.2046[/C][C]0.419184[/C][/ROW]
[ROW][C]13[/C][C]-0.333514[/C][C]-3.0201[/C][C]0.001684[/C][/ROW]
[ROW][C]14[/C][C]-0.040672[/C][C]-0.3683[/C][C]0.356798[/C][/ROW]
[ROW][C]15[/C][C]-0.104518[/C][C]-0.9465[/C][C]0.173349[/C][/ROW]
[ROW][C]16[/C][C]-0.034567[/C][C]-0.313[/C][C]0.377531[/C][/ROW]
[ROW][C]17[/C][C]0.008489[/C][C]0.0769[/C][C]0.469455[/C][/ROW]
[ROW][C]18[/C][C]-0.054245[/C][C]-0.4912[/C][C]0.312295[/C][/ROW]
[ROW][C]19[/C][C]-0.035211[/C][C]-0.3189[/C][C]0.375324[/C][/ROW]
[ROW][C]20[/C][C]-0.005148[/C][C]-0.0466[/C][C]0.481464[/C][/ROW]
[ROW][C]21[/C][C]0.115636[/C][C]1.0471[/C][C]0.149058[/C][/ROW]
[ROW][C]22[/C][C]0.012311[/C][C]0.1115[/C][C]0.455755[/C][/ROW]
[ROW][C]23[/C][C]0.038631[/C][C]0.3498[/C][C]0.363686[/C][/ROW]
[ROW][C]24[/C][C]-0.087819[/C][C]-0.7952[/C][C]0.214387[/C][/ROW]
[ROW][C]25[/C][C]0.049339[/C][C]0.4468[/C][C]0.328105[/C][/ROW]
[ROW][C]26[/C][C]0.038954[/C][C]0.3527[/C][C]0.362592[/C][/ROW]
[ROW][C]27[/C][C]-0.010644[/C][C]-0.0964[/C][C]0.461726[/C][/ROW]
[ROW][C]28[/C][C]-0.010935[/C][C]-0.099[/C][C]0.460681[/C][/ROW]
[ROW][C]29[/C][C]-0.042754[/C][C]-0.3872[/C][C]0.349822[/C][/ROW]
[ROW][C]30[/C][C]-0.051625[/C][C]-0.4675[/C][C]0.320698[/C][/ROW]
[ROW][C]31[/C][C]0.06085[/C][C]0.551[/C][C]0.29156[/C][/ROW]
[ROW][C]32[/C][C]0.130184[/C][C]1.1789[/C][C]0.12093[/C][/ROW]
[ROW][C]33[/C][C]0.079005[/C][C]0.7154[/C][C]0.238191[/C][/ROW]
[ROW][C]34[/C][C]-0.044668[/C][C]-0.4045[/C][C]0.343453[/C][/ROW]
[ROW][C]35[/C][C]0.084653[/C][C]0.7666[/C][C]0.222771[/C][/ROW]
[ROW][C]36[/C][C]-0.027526[/C][C]-0.2493[/C][C]0.401891[/C][/ROW]
[ROW][C]37[/C][C]-0.041368[/C][C]-0.3746[/C][C]0.354461[/C][/ROW]
[ROW][C]38[/C][C]0.024466[/C][C]0.2215[/C][C]0.412608[/C][/ROW]
[ROW][C]39[/C][C]-0.041593[/C][C]-0.3766[/C][C]0.353706[/C][/ROW]
[ROW][C]40[/C][C]-0.144299[/C][C]-1.3067[/C][C]0.097486[/C][/ROW]
[ROW][C]41[/C][C]-0.06282[/C][C]-0.5689[/C][C]0.285504[/C][/ROW]
[ROW][C]42[/C][C]0.045297[/C][C]0.4102[/C][C]0.341372[/C][/ROW]
[ROW][C]43[/C][C]-0.050444[/C][C]-0.4568[/C][C]0.324516[/C][/ROW]
[ROW][C]44[/C][C]0.030834[/C][C]0.2792[/C][C]0.390391[/C][/ROW]
[ROW][C]45[/C][C]0.026419[/C][C]0.2392[/C][C]0.405761[/C][/ROW]
[ROW][C]46[/C][C]-0.090665[/C][C]-0.821[/C][C]0.207012[/C][/ROW]
[ROW][C]47[/C][C]-0.002124[/C][C]-0.0192[/C][C]0.492352[/C][/ROW]
[ROW][C]48[/C][C]0.009754[/C][C]0.0883[/C][C]0.464917[/C][/ROW]
[/TABLE]
Source: https://freestatistics.org/blog/index.php?pk=242336&T=2

Globally Unique Identifier (entire table): ba.freestatistics.org/blog/index.php?pk=242336&T=2

As an alternative you can also use a QR Code:  

The GUIDs for individual cells are displayed in the table below:

Partial Autocorrelation Function
Time lag kPACF(k)T-STATP-value
10.7399996.7010
20.3298352.98680.001859
3-0.090726-0.82160.206855
4-0.002338-0.02120.491581
50.1453961.31660.095817
60.0309040.27980.39015
70.0007850.00710.497174
80.0849570.76930.221957
90.0302010.27350.392585
10-0.041726-0.37780.353261
110.0249270.22570.410989
12-0.022598-0.20460.419184
13-0.333514-3.02010.001684
14-0.040672-0.36830.356798
15-0.104518-0.94650.173349
16-0.034567-0.3130.377531
170.0084890.07690.469455
18-0.054245-0.49120.312295
19-0.035211-0.31890.375324
20-0.005148-0.04660.481464
210.1156361.04710.149058
220.0123110.11150.455755
230.0386310.34980.363686
24-0.087819-0.79520.214387
250.0493390.44680.328105
260.0389540.35270.362592
27-0.010644-0.09640.461726
28-0.010935-0.0990.460681
29-0.042754-0.38720.349822
30-0.051625-0.46750.320698
310.060850.5510.29156
320.1301841.17890.12093
330.0790050.71540.238191
34-0.044668-0.40450.343453
350.0846530.76660.222771
36-0.027526-0.24930.401891
37-0.041368-0.37460.354461
380.0244660.22150.412608
39-0.041593-0.37660.353706
40-0.144299-1.30670.097486
41-0.06282-0.56890.285504
420.0452970.41020.341372
43-0.050444-0.45680.324516
440.0308340.27920.390391
450.0264190.23920.405761
46-0.090665-0.8210.207012
47-0.002124-0.01920.492352
480.0097540.08830.464917


Parameters (Session):
par1 = 48 ; par2 = 1 ; par3 = 1 ; par4 = 0 ; par5 = 12 ; par6 = White Noise ; par7 = 0.95 ;
Parameters (R input):
par1 = 48 ; par2 = 1 ; par3 = 1 ; par4 = 0 ; par5 = 12 ; par6 = White Noise ; par7 = 0.95 ; par8 = ;
R code (references can be found in the software module):
if (par1 == 'Default') {
par1 = 10*log10(length(x))
} else {
par1 <- as.numeric(par1)
}
par2 <- as.numeric(par2)
par3 <- as.numeric(par3)
par4 <- as.numeric(par4)
par5 <- as.numeric(par5)
if (par6 == 'White Noise') par6 <- 'white' else par6 <- 'ma'
par7 <- as.numeric(par7)
if (par8 != '') par8 <- as.numeric(par8)
ox <- x
if (par8 == '') {
if (par2 == 0) {
x <- log(x)
} else {
x <- (x ^ par2 - 1) / par2
}
} else {
x <- log(x,base=par8)
}
if (par3 > 0) x <- diff(x,lag=1,difference=par3)
if (par4 > 0) x <- diff(x,lag=par5,difference=par4)
bitmap(file='picts.png')
op <- par(mfrow=c(2,1))
plot(ox,type='l',main='Original Time Series',xlab='time',ylab='value')
if (par8=='') {
mytitle <- paste('Working Time Series (lambda=',par2,', d=',par3,', D=',par4,')',sep='')
mysub <- paste('(lambda=',par2,', d=',par3,', D=',par4,', CI=', par7, ', CI type=',par6,')',sep='')
} else {
mytitle <- paste('Working Time Series (base=',par8,', d=',par3,', D=',par4,')',sep='')
mysub <- paste('(base=',par8,', d=',par3,', D=',par4,', CI=', par7, ', CI type=',par6,')',sep='')
}
plot(x,type='l', main=mytitle,xlab='time',ylab='value')
par(op)
dev.off()
bitmap(file='pic1.png')
racf <- acf(x, par1, main='Autocorrelation', xlab='time lag', ylab='ACF', ci.type=par6, ci=par7, sub=mysub)
dev.off()
bitmap(file='pic2.png')
rpacf <- pacf(x,par1,main='Partial Autocorrelation',xlab='lags',ylab='PACF',sub=mysub)
dev.off()
(myacf <- c(racf$acf))
(mypacf <- c(rpacf$acf))
lengthx <- length(x)
sqrtn <- sqrt(lengthx)
load(file='createtable')
a<-table.start()
a<-table.row.start(a)
a<-table.element(a,'Autocorrelation Function',4,TRUE)
a<-table.row.end(a)
a<-table.row.start(a)
a<-table.element(a,'Time lag k',header=TRUE)
a<-table.element(a,hyperlink('basics.htm','ACF(k)','click here for more information about the Autocorrelation Function'),header=TRUE)
a<-table.element(a,'T-STAT',header=TRUE)
a<-table.element(a,'P-value',header=TRUE)
a<-table.row.end(a)
for (i in 2:(par1+1)) {
a<-table.row.start(a)
a<-table.element(a,i-1,header=TRUE)
a<-table.element(a,round(myacf[i],6))
mytstat <- myacf[i]*sqrtn
a<-table.element(a,round(mytstat,4))
a<-table.element(a,round(1-pt(abs(mytstat),lengthx),6))
a<-table.row.end(a)
}
a<-table.end(a)
table.save(a,file='mytable.tab')
a<-table.start()
a<-table.row.start(a)
a<-table.element(a,'Partial Autocorrelation Function',4,TRUE)
a<-table.row.end(a)
a<-table.row.start(a)
a<-table.element(a,'Time lag k',header=TRUE)
a<-table.element(a,hyperlink('basics.htm','PACF(k)','click here for more information about the Partial Autocorrelation Function'),header=TRUE)
a<-table.element(a,'T-STAT',header=TRUE)
a<-table.element(a,'P-value',header=TRUE)
a<-table.row.end(a)
for (i in 1:par1) {
a<-table.row.start(a)
a<-table.element(a,i,header=TRUE)
a<-table.element(a,round(mypacf[i],6))
mytstat <- mypacf[i]*sqrtn
a<-table.element(a,round(mytstat,4))
a<-table.element(a,round(1-pt(abs(mytstat),lengthx),6))
a<-table.row.end(a)
}
a<-table.end(a)
table.save(a,file='mytable1.tab')