Free Statistics

of Irreproducible Research!

Author's title

Author*Unverified author*
R Software Modulerwasp_autocorrelation.wasp
Title produced by software(Partial) Autocorrelation Function
Date of computationThu, 16 Oct 2014 13:29:02 +0100
Cite this page as followsStatistical Computations at FreeStatistics.org, Office for Research Development and Education, URL https://freestatistics.org/blog/index.php?v=date/2014/Oct/16/t141346257824i9qil5s6k5dp4.htm/, Retrieved Mon, 13 May 2024 10:29:28 +0000
Statistical Computations at FreeStatistics.org, Office for Research Development and Education, URL https://freestatistics.org/blog/index.php?pk=242326, Retrieved Mon, 13 May 2024 10:29:28 +0000
QR Codes:

Original text written by user:
IsPrivate?No (this computation is public)
User-defined keywords
Estimated Impact55
Family? (F = Feedback message, R = changed R code, M = changed R Module, P = changed Parameters, D = changed Data)
-       [(Partial) Autocorrelation Function] [] [2014-10-16 12:29:02] [4f675b9afdd3602a3170287ae908b245] [Current]
Feedback Forum

Post a new message
Dataseries X:
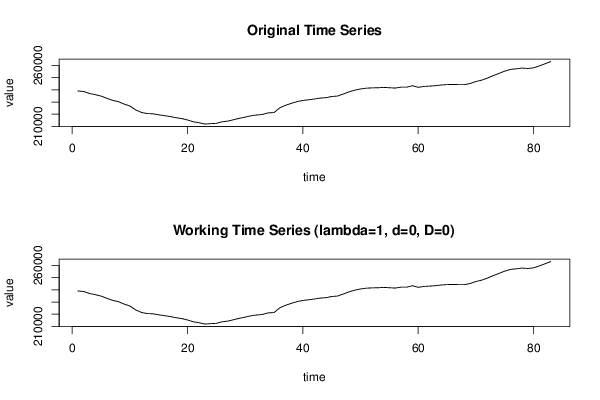
239 050
238 600
236 980
236 050
234 870
233 060
231 370
230 300
228 340
226 760
223 550
221 460
220 560
220 350
219 500
218 800
218 130
217 150
216 430
215 310
213 780
213 040
211 940
212 270
212 540
213 790
214 400
215 520
216 690
217 630
218 710
219 360
219 800
221 110
221 320
225 230
227 340
228 930
230 340
231 270
231 830
232 450
233 220
233 520
234 520
234 860
236 560
238 310
239 690
240 700
241 330
241 580
241 670
241 970
241 690
241 410
242 130
242 130
243 320
242 030
242 740
243 050
243 360
243 940
244 270
244 350
244 260
244 230
245 130
246 740
247 910
249 590
251 610
253 430
255 290
256 710
257 190
257 820
257 460
257 970
259 520
261 340
263 150


Summary of computational transaction
Raw Inputview raw input (R code)
Raw Outputview raw output of R engine
Computing time1 seconds
R Server'Sir Ronald Aylmer Fisher' @ fisher.wessa.net

\begin{tabular}{lllllllll}
\hline
Summary of computational transaction \tabularnewline
Raw Input & view raw input (R code)  \tabularnewline
Raw Output & view raw output of R engine  \tabularnewline
Computing time & 1 seconds \tabularnewline
R Server & 'Sir Ronald Aylmer Fisher' @ fisher.wessa.net \tabularnewline
\hline
\end{tabular}
%Source: https://freestatistics.org/blog/index.php?pk=242326&T=0

[TABLE]
[ROW][C]Summary of computational transaction[/C][/ROW]
[ROW][C]Raw Input[/C][C]view raw input (R code) [/C][/ROW]
[ROW][C]Raw Output[/C][C]view raw output of R engine [/C][/ROW]
[ROW][C]Computing time[/C][C]1 seconds[/C][/ROW]
[ROW][C]R Server[/C][C]'Sir Ronald Aylmer Fisher' @ fisher.wessa.net[/C][/ROW]
[/TABLE]
Source: https://freestatistics.org/blog/index.php?pk=242326&T=0

Globally Unique Identifier (entire table): ba.freestatistics.org/blog/index.php?pk=242326&T=0

As an alternative you can also use a QR Code:  

The GUIDs for individual cells are displayed in the table below:

Summary of computational transaction
Raw Inputview raw input (R code)
Raw Outputview raw output of R engine
Computing time1 seconds
R Server'Sir Ronald Aylmer Fisher' @ fisher.wessa.net


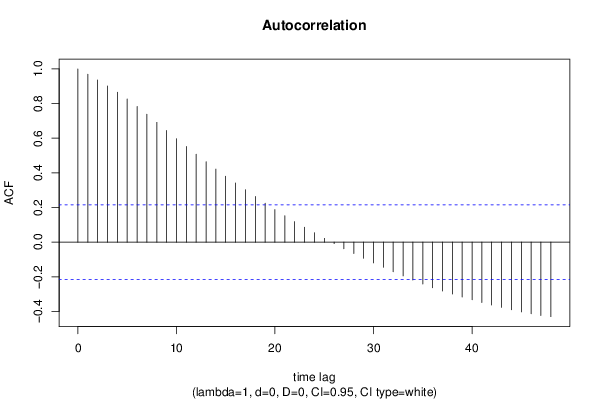
Autocorrelation Function
Time lag kACF(k)T-STATP-value
10.9694818.83240
20.9364818.53170
30.9016738.21460
40.8654377.88450
50.8264577.52940
60.7835047.13810
70.7386256.72920
80.6915276.30010
90.6441965.86890
100.5974745.44320
110.5519475.02851e-06
120.5077684.6267e-06
130.4643044.233e-05
140.421513.84010.00012
150.3807153.46850.000416
160.3415233.11140.001276
170.3023492.75450.003611
180.2633542.39930.009334
190.2250092.04990.021764
200.1879131.7120.045319
210.1527761.39190.083842
220.1187361.08170.141251
230.0859430.7830.217934
240.054630.49770.310005
250.0216730.19750.421978
26-0.008635-0.07870.468743
27-0.038105-0.34720.364676
28-0.065445-0.59620.27632
29-0.092689-0.84440.200427
30-0.11968-1.09030.139359
31-0.145471-1.32530.094353
32-0.17058-1.55410.061988
33-0.195011-1.77660.039646
34-0.218867-1.9940.024719
35-0.241273-2.19810.015363
36-0.26291-2.39520.00943
37-0.282265-2.57160.005953
38-0.299366-2.72740.003895
39-0.316501-2.88350.002504
40-0.332397-3.02830.001638
41-0.348125-3.17160.001063
42-0.362711-3.30450.000703
43-0.376631-3.43130.000469
44-0.38996-3.55270.000316
45-0.402664-3.66840.000215
46-0.413828-3.77020.000152
47-0.423364-3.8570.000113
48-0.430208-3.91949.1e-05

\begin{tabular}{lllllllll}
\hline
Autocorrelation Function \tabularnewline
Time lag k & ACF(k) & T-STAT & P-value \tabularnewline
1 & 0.969481 & 8.8324 & 0 \tabularnewline
2 & 0.936481 & 8.5317 & 0 \tabularnewline
3 & 0.901673 & 8.2146 & 0 \tabularnewline
4 & 0.865437 & 7.8845 & 0 \tabularnewline
5 & 0.826457 & 7.5294 & 0 \tabularnewline
6 & 0.783504 & 7.1381 & 0 \tabularnewline
7 & 0.738625 & 6.7292 & 0 \tabularnewline
8 & 0.691527 & 6.3001 & 0 \tabularnewline
9 & 0.644196 & 5.8689 & 0 \tabularnewline
10 & 0.597474 & 5.4432 & 0 \tabularnewline
11 & 0.551947 & 5.0285 & 1e-06 \tabularnewline
12 & 0.507768 & 4.626 & 7e-06 \tabularnewline
13 & 0.464304 & 4.23 & 3e-05 \tabularnewline
14 & 0.42151 & 3.8401 & 0.00012 \tabularnewline
15 & 0.380715 & 3.4685 & 0.000416 \tabularnewline
16 & 0.341523 & 3.1114 & 0.001276 \tabularnewline
17 & 0.302349 & 2.7545 & 0.003611 \tabularnewline
18 & 0.263354 & 2.3993 & 0.009334 \tabularnewline
19 & 0.225009 & 2.0499 & 0.021764 \tabularnewline
20 & 0.187913 & 1.712 & 0.045319 \tabularnewline
21 & 0.152776 & 1.3919 & 0.083842 \tabularnewline
22 & 0.118736 & 1.0817 & 0.141251 \tabularnewline
23 & 0.085943 & 0.783 & 0.217934 \tabularnewline
24 & 0.05463 & 0.4977 & 0.310005 \tabularnewline
25 & 0.021673 & 0.1975 & 0.421978 \tabularnewline
26 & -0.008635 & -0.0787 & 0.468743 \tabularnewline
27 & -0.038105 & -0.3472 & 0.364676 \tabularnewline
28 & -0.065445 & -0.5962 & 0.27632 \tabularnewline
29 & -0.092689 & -0.8444 & 0.200427 \tabularnewline
30 & -0.11968 & -1.0903 & 0.139359 \tabularnewline
31 & -0.145471 & -1.3253 & 0.094353 \tabularnewline
32 & -0.17058 & -1.5541 & 0.061988 \tabularnewline
33 & -0.195011 & -1.7766 & 0.039646 \tabularnewline
34 & -0.218867 & -1.994 & 0.024719 \tabularnewline
35 & -0.241273 & -2.1981 & 0.015363 \tabularnewline
36 & -0.26291 & -2.3952 & 0.00943 \tabularnewline
37 & -0.282265 & -2.5716 & 0.005953 \tabularnewline
38 & -0.299366 & -2.7274 & 0.003895 \tabularnewline
39 & -0.316501 & -2.8835 & 0.002504 \tabularnewline
40 & -0.332397 & -3.0283 & 0.001638 \tabularnewline
41 & -0.348125 & -3.1716 & 0.001063 \tabularnewline
42 & -0.362711 & -3.3045 & 0.000703 \tabularnewline
43 & -0.376631 & -3.4313 & 0.000469 \tabularnewline
44 & -0.38996 & -3.5527 & 0.000316 \tabularnewline
45 & -0.402664 & -3.6684 & 0.000215 \tabularnewline
46 & -0.413828 & -3.7702 & 0.000152 \tabularnewline
47 & -0.423364 & -3.857 & 0.000113 \tabularnewline
48 & -0.430208 & -3.9194 & 9.1e-05 \tabularnewline
\hline
\end{tabular}
%Source: https://freestatistics.org/blog/index.php?pk=242326&T=1

[TABLE]
[ROW][C]Autocorrelation Function[/C][/ROW]
[ROW][C]Time lag k[/C][C]ACF(k)[/C][C]T-STAT[/C][C]P-value[/C][/ROW]
[ROW][C]1[/C][C]0.969481[/C][C]8.8324[/C][C]0[/C][/ROW]
[ROW][C]2[/C][C]0.936481[/C][C]8.5317[/C][C]0[/C][/ROW]
[ROW][C]3[/C][C]0.901673[/C][C]8.2146[/C][C]0[/C][/ROW]
[ROW][C]4[/C][C]0.865437[/C][C]7.8845[/C][C]0[/C][/ROW]
[ROW][C]5[/C][C]0.826457[/C][C]7.5294[/C][C]0[/C][/ROW]
[ROW][C]6[/C][C]0.783504[/C][C]7.1381[/C][C]0[/C][/ROW]
[ROW][C]7[/C][C]0.738625[/C][C]6.7292[/C][C]0[/C][/ROW]
[ROW][C]8[/C][C]0.691527[/C][C]6.3001[/C][C]0[/C][/ROW]
[ROW][C]9[/C][C]0.644196[/C][C]5.8689[/C][C]0[/C][/ROW]
[ROW][C]10[/C][C]0.597474[/C][C]5.4432[/C][C]0[/C][/ROW]
[ROW][C]11[/C][C]0.551947[/C][C]5.0285[/C][C]1e-06[/C][/ROW]
[ROW][C]12[/C][C]0.507768[/C][C]4.626[/C][C]7e-06[/C][/ROW]
[ROW][C]13[/C][C]0.464304[/C][C]4.23[/C][C]3e-05[/C][/ROW]
[ROW][C]14[/C][C]0.42151[/C][C]3.8401[/C][C]0.00012[/C][/ROW]
[ROW][C]15[/C][C]0.380715[/C][C]3.4685[/C][C]0.000416[/C][/ROW]
[ROW][C]16[/C][C]0.341523[/C][C]3.1114[/C][C]0.001276[/C][/ROW]
[ROW][C]17[/C][C]0.302349[/C][C]2.7545[/C][C]0.003611[/C][/ROW]
[ROW][C]18[/C][C]0.263354[/C][C]2.3993[/C][C]0.009334[/C][/ROW]
[ROW][C]19[/C][C]0.225009[/C][C]2.0499[/C][C]0.021764[/C][/ROW]
[ROW][C]20[/C][C]0.187913[/C][C]1.712[/C][C]0.045319[/C][/ROW]
[ROW][C]21[/C][C]0.152776[/C][C]1.3919[/C][C]0.083842[/C][/ROW]
[ROW][C]22[/C][C]0.118736[/C][C]1.0817[/C][C]0.141251[/C][/ROW]
[ROW][C]23[/C][C]0.085943[/C][C]0.783[/C][C]0.217934[/C][/ROW]
[ROW][C]24[/C][C]0.05463[/C][C]0.4977[/C][C]0.310005[/C][/ROW]
[ROW][C]25[/C][C]0.021673[/C][C]0.1975[/C][C]0.421978[/C][/ROW]
[ROW][C]26[/C][C]-0.008635[/C][C]-0.0787[/C][C]0.468743[/C][/ROW]
[ROW][C]27[/C][C]-0.038105[/C][C]-0.3472[/C][C]0.364676[/C][/ROW]
[ROW][C]28[/C][C]-0.065445[/C][C]-0.5962[/C][C]0.27632[/C][/ROW]
[ROW][C]29[/C][C]-0.092689[/C][C]-0.8444[/C][C]0.200427[/C][/ROW]
[ROW][C]30[/C][C]-0.11968[/C][C]-1.0903[/C][C]0.139359[/C][/ROW]
[ROW][C]31[/C][C]-0.145471[/C][C]-1.3253[/C][C]0.094353[/C][/ROW]
[ROW][C]32[/C][C]-0.17058[/C][C]-1.5541[/C][C]0.061988[/C][/ROW]
[ROW][C]33[/C][C]-0.195011[/C][C]-1.7766[/C][C]0.039646[/C][/ROW]
[ROW][C]34[/C][C]-0.218867[/C][C]-1.994[/C][C]0.024719[/C][/ROW]
[ROW][C]35[/C][C]-0.241273[/C][C]-2.1981[/C][C]0.015363[/C][/ROW]
[ROW][C]36[/C][C]-0.26291[/C][C]-2.3952[/C][C]0.00943[/C][/ROW]
[ROW][C]37[/C][C]-0.282265[/C][C]-2.5716[/C][C]0.005953[/C][/ROW]
[ROW][C]38[/C][C]-0.299366[/C][C]-2.7274[/C][C]0.003895[/C][/ROW]
[ROW][C]39[/C][C]-0.316501[/C][C]-2.8835[/C][C]0.002504[/C][/ROW]
[ROW][C]40[/C][C]-0.332397[/C][C]-3.0283[/C][C]0.001638[/C][/ROW]
[ROW][C]41[/C][C]-0.348125[/C][C]-3.1716[/C][C]0.001063[/C][/ROW]
[ROW][C]42[/C][C]-0.362711[/C][C]-3.3045[/C][C]0.000703[/C][/ROW]
[ROW][C]43[/C][C]-0.376631[/C][C]-3.4313[/C][C]0.000469[/C][/ROW]
[ROW][C]44[/C][C]-0.38996[/C][C]-3.5527[/C][C]0.000316[/C][/ROW]
[ROW][C]45[/C][C]-0.402664[/C][C]-3.6684[/C][C]0.000215[/C][/ROW]
[ROW][C]46[/C][C]-0.413828[/C][C]-3.7702[/C][C]0.000152[/C][/ROW]
[ROW][C]47[/C][C]-0.423364[/C][C]-3.857[/C][C]0.000113[/C][/ROW]
[ROW][C]48[/C][C]-0.430208[/C][C]-3.9194[/C][C]9.1e-05[/C][/ROW]
[/TABLE]
Source: https://freestatistics.org/blog/index.php?pk=242326&T=1

Globally Unique Identifier (entire table): ba.freestatistics.org/blog/index.php?pk=242326&T=1

As an alternative you can also use a QR Code:  

The GUIDs for individual cells are displayed in the table below:

Autocorrelation Function
Time lag kACF(k)T-STATP-value
10.9694818.83240
20.9364818.53170
30.9016738.21460
40.8654377.88450
50.8264577.52940
60.7835047.13810
70.7386256.72920
80.6915276.30010
90.6441965.86890
100.5974745.44320
110.5519475.02851e-06
120.5077684.6267e-06
130.4643044.233e-05
140.421513.84010.00012
150.3807153.46850.000416
160.3415233.11140.001276
170.3023492.75450.003611
180.2633542.39930.009334
190.2250092.04990.021764
200.1879131.7120.045319
210.1527761.39190.083842
220.1187361.08170.141251
230.0859430.7830.217934
240.054630.49770.310005
250.0216730.19750.421978
26-0.008635-0.07870.468743
27-0.038105-0.34720.364676
28-0.065445-0.59620.27632
29-0.092689-0.84440.200427
30-0.11968-1.09030.139359
31-0.145471-1.32530.094353
32-0.17058-1.55410.061988
33-0.195011-1.77660.039646
34-0.218867-1.9940.024719
35-0.241273-2.19810.015363
36-0.26291-2.39520.00943
37-0.282265-2.57160.005953
38-0.299366-2.72740.003895
39-0.316501-2.88350.002504
40-0.332397-3.02830.001638
41-0.348125-3.17160.001063
42-0.362711-3.30450.000703
43-0.376631-3.43130.000469
44-0.38996-3.55270.000316
45-0.402664-3.66840.000215
46-0.413828-3.77020.000152
47-0.423364-3.8570.000113
48-0.430208-3.91949.1e-05


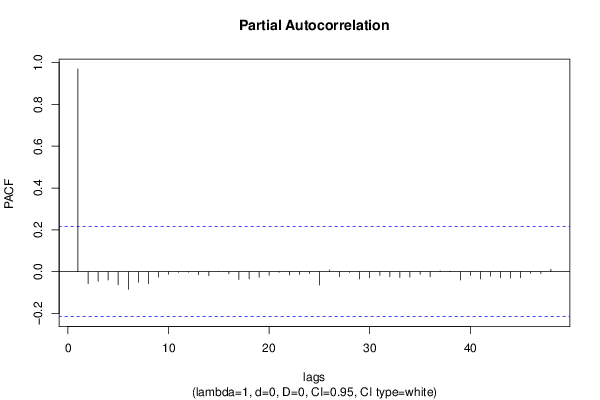
Partial Autocorrelation Function
Time lag kPACF(k)T-STATP-value
10.9694818.83240
2-0.056783-0.51730.303155
3-0.045572-0.41520.339542
4-0.039963-0.36410.358363
5-0.062909-0.57310.284055
6-0.08386-0.7640.223517
7-0.050114-0.45660.32459
8-0.057518-0.5240.300834
9-0.025373-0.23120.408881
10-0.011734-0.10690.457563
11-0.003055-0.02780.488933
12-0.002359-0.02150.491452
13-0.014837-0.13520.446403
14-0.019613-0.17870.429311
150.0001090.0010.499605
16-0.009834-0.08960.464412
17-0.037593-0.34250.366423
18-0.033879-0.30870.379179
19-0.026388-0.24040.405304
20-0.01714-0.15620.438145
21-0.003271-0.02980.48815
22-0.016354-0.1490.440961
23-0.012913-0.11760.453319
24-0.008462-0.07710.469368
25-0.063696-0.58030.281641
260.0083080.07570.469923
27-0.024451-0.22280.412134
28-0.003621-0.0330.486882
29-0.034664-0.31580.376472
30-0.029468-0.26850.394504
31-0.01764-0.16070.436358
32-0.024724-0.22530.411169
33-0.028043-0.25550.399491
34-0.026157-0.23830.406119
35-0.012042-0.10970.456453
36-0.023976-0.21840.413815
370.0028390.02590.489715
380.0019140.01740.493064
39-0.03992-0.36370.358509
40-0.017145-0.15620.438128
41-0.034512-0.31440.376996
42-0.021516-0.1960.422536
43-0.02919-0.26590.395475
44-0.030687-0.27960.390252
45-0.029178-0.26580.395516
46-0.007919-0.07210.471331
47-0.008823-0.08040.468064
480.0113540.10340.458933

\begin{tabular}{lllllllll}
\hline
Partial Autocorrelation Function \tabularnewline
Time lag k & PACF(k) & T-STAT & P-value \tabularnewline
1 & 0.969481 & 8.8324 & 0 \tabularnewline
2 & -0.056783 & -0.5173 & 0.303155 \tabularnewline
3 & -0.045572 & -0.4152 & 0.339542 \tabularnewline
4 & -0.039963 & -0.3641 & 0.358363 \tabularnewline
5 & -0.062909 & -0.5731 & 0.284055 \tabularnewline
6 & -0.08386 & -0.764 & 0.223517 \tabularnewline
7 & -0.050114 & -0.4566 & 0.32459 \tabularnewline
8 & -0.057518 & -0.524 & 0.300834 \tabularnewline
9 & -0.025373 & -0.2312 & 0.408881 \tabularnewline
10 & -0.011734 & -0.1069 & 0.457563 \tabularnewline
11 & -0.003055 & -0.0278 & 0.488933 \tabularnewline
12 & -0.002359 & -0.0215 & 0.491452 \tabularnewline
13 & -0.014837 & -0.1352 & 0.446403 \tabularnewline
14 & -0.019613 & -0.1787 & 0.429311 \tabularnewline
15 & 0.000109 & 0.001 & 0.499605 \tabularnewline
16 & -0.009834 & -0.0896 & 0.464412 \tabularnewline
17 & -0.037593 & -0.3425 & 0.366423 \tabularnewline
18 & -0.033879 & -0.3087 & 0.379179 \tabularnewline
19 & -0.026388 & -0.2404 & 0.405304 \tabularnewline
20 & -0.01714 & -0.1562 & 0.438145 \tabularnewline
21 & -0.003271 & -0.0298 & 0.48815 \tabularnewline
22 & -0.016354 & -0.149 & 0.440961 \tabularnewline
23 & -0.012913 & -0.1176 & 0.453319 \tabularnewline
24 & -0.008462 & -0.0771 & 0.469368 \tabularnewline
25 & -0.063696 & -0.5803 & 0.281641 \tabularnewline
26 & 0.008308 & 0.0757 & 0.469923 \tabularnewline
27 & -0.024451 & -0.2228 & 0.412134 \tabularnewline
28 & -0.003621 & -0.033 & 0.486882 \tabularnewline
29 & -0.034664 & -0.3158 & 0.376472 \tabularnewline
30 & -0.029468 & -0.2685 & 0.394504 \tabularnewline
31 & -0.01764 & -0.1607 & 0.436358 \tabularnewline
32 & -0.024724 & -0.2253 & 0.411169 \tabularnewline
33 & -0.028043 & -0.2555 & 0.399491 \tabularnewline
34 & -0.026157 & -0.2383 & 0.406119 \tabularnewline
35 & -0.012042 & -0.1097 & 0.456453 \tabularnewline
36 & -0.023976 & -0.2184 & 0.413815 \tabularnewline
37 & 0.002839 & 0.0259 & 0.489715 \tabularnewline
38 & 0.001914 & 0.0174 & 0.493064 \tabularnewline
39 & -0.03992 & -0.3637 & 0.358509 \tabularnewline
40 & -0.017145 & -0.1562 & 0.438128 \tabularnewline
41 & -0.034512 & -0.3144 & 0.376996 \tabularnewline
42 & -0.021516 & -0.196 & 0.422536 \tabularnewline
43 & -0.02919 & -0.2659 & 0.395475 \tabularnewline
44 & -0.030687 & -0.2796 & 0.390252 \tabularnewline
45 & -0.029178 & -0.2658 & 0.395516 \tabularnewline
46 & -0.007919 & -0.0721 & 0.471331 \tabularnewline
47 & -0.008823 & -0.0804 & 0.468064 \tabularnewline
48 & 0.011354 & 0.1034 & 0.458933 \tabularnewline
\hline
\end{tabular}
%Source: https://freestatistics.org/blog/index.php?pk=242326&T=2

[TABLE]
[ROW][C]Partial Autocorrelation Function[/C][/ROW]
[ROW][C]Time lag k[/C][C]PACF(k)[/C][C]T-STAT[/C][C]P-value[/C][/ROW]
[ROW][C]1[/C][C]0.969481[/C][C]8.8324[/C][C]0[/C][/ROW]
[ROW][C]2[/C][C]-0.056783[/C][C]-0.5173[/C][C]0.303155[/C][/ROW]
[ROW][C]3[/C][C]-0.045572[/C][C]-0.4152[/C][C]0.339542[/C][/ROW]
[ROW][C]4[/C][C]-0.039963[/C][C]-0.3641[/C][C]0.358363[/C][/ROW]
[ROW][C]5[/C][C]-0.062909[/C][C]-0.5731[/C][C]0.284055[/C][/ROW]
[ROW][C]6[/C][C]-0.08386[/C][C]-0.764[/C][C]0.223517[/C][/ROW]
[ROW][C]7[/C][C]-0.050114[/C][C]-0.4566[/C][C]0.32459[/C][/ROW]
[ROW][C]8[/C][C]-0.057518[/C][C]-0.524[/C][C]0.300834[/C][/ROW]
[ROW][C]9[/C][C]-0.025373[/C][C]-0.2312[/C][C]0.408881[/C][/ROW]
[ROW][C]10[/C][C]-0.011734[/C][C]-0.1069[/C][C]0.457563[/C][/ROW]
[ROW][C]11[/C][C]-0.003055[/C][C]-0.0278[/C][C]0.488933[/C][/ROW]
[ROW][C]12[/C][C]-0.002359[/C][C]-0.0215[/C][C]0.491452[/C][/ROW]
[ROW][C]13[/C][C]-0.014837[/C][C]-0.1352[/C][C]0.446403[/C][/ROW]
[ROW][C]14[/C][C]-0.019613[/C][C]-0.1787[/C][C]0.429311[/C][/ROW]
[ROW][C]15[/C][C]0.000109[/C][C]0.001[/C][C]0.499605[/C][/ROW]
[ROW][C]16[/C][C]-0.009834[/C][C]-0.0896[/C][C]0.464412[/C][/ROW]
[ROW][C]17[/C][C]-0.037593[/C][C]-0.3425[/C][C]0.366423[/C][/ROW]
[ROW][C]18[/C][C]-0.033879[/C][C]-0.3087[/C][C]0.379179[/C][/ROW]
[ROW][C]19[/C][C]-0.026388[/C][C]-0.2404[/C][C]0.405304[/C][/ROW]
[ROW][C]20[/C][C]-0.01714[/C][C]-0.1562[/C][C]0.438145[/C][/ROW]
[ROW][C]21[/C][C]-0.003271[/C][C]-0.0298[/C][C]0.48815[/C][/ROW]
[ROW][C]22[/C][C]-0.016354[/C][C]-0.149[/C][C]0.440961[/C][/ROW]
[ROW][C]23[/C][C]-0.012913[/C][C]-0.1176[/C][C]0.453319[/C][/ROW]
[ROW][C]24[/C][C]-0.008462[/C][C]-0.0771[/C][C]0.469368[/C][/ROW]
[ROW][C]25[/C][C]-0.063696[/C][C]-0.5803[/C][C]0.281641[/C][/ROW]
[ROW][C]26[/C][C]0.008308[/C][C]0.0757[/C][C]0.469923[/C][/ROW]
[ROW][C]27[/C][C]-0.024451[/C][C]-0.2228[/C][C]0.412134[/C][/ROW]
[ROW][C]28[/C][C]-0.003621[/C][C]-0.033[/C][C]0.486882[/C][/ROW]
[ROW][C]29[/C][C]-0.034664[/C][C]-0.3158[/C][C]0.376472[/C][/ROW]
[ROW][C]30[/C][C]-0.029468[/C][C]-0.2685[/C][C]0.394504[/C][/ROW]
[ROW][C]31[/C][C]-0.01764[/C][C]-0.1607[/C][C]0.436358[/C][/ROW]
[ROW][C]32[/C][C]-0.024724[/C][C]-0.2253[/C][C]0.411169[/C][/ROW]
[ROW][C]33[/C][C]-0.028043[/C][C]-0.2555[/C][C]0.399491[/C][/ROW]
[ROW][C]34[/C][C]-0.026157[/C][C]-0.2383[/C][C]0.406119[/C][/ROW]
[ROW][C]35[/C][C]-0.012042[/C][C]-0.1097[/C][C]0.456453[/C][/ROW]
[ROW][C]36[/C][C]-0.023976[/C][C]-0.2184[/C][C]0.413815[/C][/ROW]
[ROW][C]37[/C][C]0.002839[/C][C]0.0259[/C][C]0.489715[/C][/ROW]
[ROW][C]38[/C][C]0.001914[/C][C]0.0174[/C][C]0.493064[/C][/ROW]
[ROW][C]39[/C][C]-0.03992[/C][C]-0.3637[/C][C]0.358509[/C][/ROW]
[ROW][C]40[/C][C]-0.017145[/C][C]-0.1562[/C][C]0.438128[/C][/ROW]
[ROW][C]41[/C][C]-0.034512[/C][C]-0.3144[/C][C]0.376996[/C][/ROW]
[ROW][C]42[/C][C]-0.021516[/C][C]-0.196[/C][C]0.422536[/C][/ROW]
[ROW][C]43[/C][C]-0.02919[/C][C]-0.2659[/C][C]0.395475[/C][/ROW]
[ROW][C]44[/C][C]-0.030687[/C][C]-0.2796[/C][C]0.390252[/C][/ROW]
[ROW][C]45[/C][C]-0.029178[/C][C]-0.2658[/C][C]0.395516[/C][/ROW]
[ROW][C]46[/C][C]-0.007919[/C][C]-0.0721[/C][C]0.471331[/C][/ROW]
[ROW][C]47[/C][C]-0.008823[/C][C]-0.0804[/C][C]0.468064[/C][/ROW]
[ROW][C]48[/C][C]0.011354[/C][C]0.1034[/C][C]0.458933[/C][/ROW]
[/TABLE]
Source: https://freestatistics.org/blog/index.php?pk=242326&T=2

Globally Unique Identifier (entire table): ba.freestatistics.org/blog/index.php?pk=242326&T=2

As an alternative you can also use a QR Code:  

The GUIDs for individual cells are displayed in the table below:

Partial Autocorrelation Function
Time lag kPACF(k)T-STATP-value
10.9694818.83240
2-0.056783-0.51730.303155
3-0.045572-0.41520.339542
4-0.039963-0.36410.358363
5-0.062909-0.57310.284055
6-0.08386-0.7640.223517
7-0.050114-0.45660.32459
8-0.057518-0.5240.300834
9-0.025373-0.23120.408881
10-0.011734-0.10690.457563
11-0.003055-0.02780.488933
12-0.002359-0.02150.491452
13-0.014837-0.13520.446403
14-0.019613-0.17870.429311
150.0001090.0010.499605
16-0.009834-0.08960.464412
17-0.037593-0.34250.366423
18-0.033879-0.30870.379179
19-0.026388-0.24040.405304
20-0.01714-0.15620.438145
21-0.003271-0.02980.48815
22-0.016354-0.1490.440961
23-0.012913-0.11760.453319
24-0.008462-0.07710.469368
25-0.063696-0.58030.281641
260.0083080.07570.469923
27-0.024451-0.22280.412134
28-0.003621-0.0330.486882
29-0.034664-0.31580.376472
30-0.029468-0.26850.394504
31-0.01764-0.16070.436358
32-0.024724-0.22530.411169
33-0.028043-0.25550.399491
34-0.026157-0.23830.406119
35-0.012042-0.10970.456453
36-0.023976-0.21840.413815
370.0028390.02590.489715
380.0019140.01740.493064
39-0.03992-0.36370.358509
40-0.017145-0.15620.438128
41-0.034512-0.31440.376996
42-0.021516-0.1960.422536
43-0.02919-0.26590.395475
44-0.030687-0.27960.390252
45-0.029178-0.26580.395516
46-0.007919-0.07210.471331
47-0.008823-0.08040.468064
480.0113540.10340.458933


Parameters (Session):
par1 = 48 ; par2 = 1 ; par3 = 0 ; par4 = 0 ; par5 = 12 ; par6 = White Noise ; par7 = 0.95 ;
Parameters (R input):
par1 = 48 ; par2 = 1 ; par3 = 0 ; par4 = 0 ; par5 = 12 ; par6 = White Noise ; par7 = 0.95 ; par8 = ;
R code (references can be found in the software module):
if (par1 == 'Default') {
par1 = 10*log10(length(x))
} else {
par1 <- as.numeric(par1)
}
par2 <- as.numeric(par2)
par3 <- as.numeric(par3)
par4 <- as.numeric(par4)
par5 <- as.numeric(par5)
if (par6 == 'White Noise') par6 <- 'white' else par6 <- 'ma'
par7 <- as.numeric(par7)
if (par8 != '') par8 <- as.numeric(par8)
ox <- x
if (par8 == '') {
if (par2 == 0) {
x <- log(x)
} else {
x <- (x ^ par2 - 1) / par2
}
} else {
x <- log(x,base=par8)
}
if (par3 > 0) x <- diff(x,lag=1,difference=par3)
if (par4 > 0) x <- diff(x,lag=par5,difference=par4)
bitmap(file='picts.png')
op <- par(mfrow=c(2,1))
plot(ox,type='l',main='Original Time Series',xlab='time',ylab='value')
if (par8=='') {
mytitle <- paste('Working Time Series (lambda=',par2,', d=',par3,', D=',par4,')',sep='')
mysub <- paste('(lambda=',par2,', d=',par3,', D=',par4,', CI=', par7, ', CI type=',par6,')',sep='')
} else {
mytitle <- paste('Working Time Series (base=',par8,', d=',par3,', D=',par4,')',sep='')
mysub <- paste('(base=',par8,', d=',par3,', D=',par4,', CI=', par7, ', CI type=',par6,')',sep='')
}
plot(x,type='l', main=mytitle,xlab='time',ylab='value')
par(op)
dev.off()
bitmap(file='pic1.png')
racf <- acf(x, par1, main='Autocorrelation', xlab='time lag', ylab='ACF', ci.type=par6, ci=par7, sub=mysub)
dev.off()
bitmap(file='pic2.png')
rpacf <- pacf(x,par1,main='Partial Autocorrelation',xlab='lags',ylab='PACF',sub=mysub)
dev.off()
(myacf <- c(racf$acf))
(mypacf <- c(rpacf$acf))
lengthx <- length(x)
sqrtn <- sqrt(lengthx)
load(file='createtable')
a<-table.start()
a<-table.row.start(a)
a<-table.element(a,'Autocorrelation Function',4,TRUE)
a<-table.row.end(a)
a<-table.row.start(a)
a<-table.element(a,'Time lag k',header=TRUE)
a<-table.element(a,hyperlink('basics.htm','ACF(k)','click here for more information about the Autocorrelation Function'),header=TRUE)
a<-table.element(a,'T-STAT',header=TRUE)
a<-table.element(a,'P-value',header=TRUE)
a<-table.row.end(a)
for (i in 2:(par1+1)) {
a<-table.row.start(a)
a<-table.element(a,i-1,header=TRUE)
a<-table.element(a,round(myacf[i],6))
mytstat <- myacf[i]*sqrtn
a<-table.element(a,round(mytstat,4))
a<-table.element(a,round(1-pt(abs(mytstat),lengthx),6))
a<-table.row.end(a)
}
a<-table.end(a)
table.save(a,file='mytable.tab')
a<-table.start()
a<-table.row.start(a)
a<-table.element(a,'Partial Autocorrelation Function',4,TRUE)
a<-table.row.end(a)
a<-table.row.start(a)
a<-table.element(a,'Time lag k',header=TRUE)
a<-table.element(a,hyperlink('basics.htm','PACF(k)','click here for more information about the Partial Autocorrelation Function'),header=TRUE)
a<-table.element(a,'T-STAT',header=TRUE)
a<-table.element(a,'P-value',header=TRUE)
a<-table.row.end(a)
for (i in 1:par1) {
a<-table.row.start(a)
a<-table.element(a,i,header=TRUE)
a<-table.element(a,round(mypacf[i],6))
mytstat <- mypacf[i]*sqrtn
a<-table.element(a,round(mytstat,4))
a<-table.element(a,round(1-pt(abs(mytstat),lengthx),6))
a<-table.row.end(a)
}
a<-table.end(a)
table.save(a,file='mytable1.tab')