Free Statistics

of Irreproducible Research!

Author's title

Author*Unverified author*
R Software Modulerwasp_centraltendency.wasp
Title produced by softwareCentral Tendency
Date of computationFri, 10 Oct 2014 15:01:34 +0100
Cite this page as followsStatistical Computations at FreeStatistics.org, Office for Research Development and Education, URL https://freestatistics.org/blog/index.php?v=date/2014/Oct/10/t1412949741oyop5bpzkd72x91.htm/, Retrieved Mon, 13 May 2024 12:10:21 +0000
Statistical Computations at FreeStatistics.org, Office for Research Development and Education, URL https://freestatistics.org/blog/index.php?pk=240318, Retrieved Mon, 13 May 2024 12:10:21 +0000
QR Codes:

Original text written by user:
IsPrivate?No (this computation is public)
User-defined keywords
Estimated Impact63
Family? (F = Feedback message, R = changed R code, M = changed R Module, P = changed Parameters, D = changed Data)
-       [Central Tendency] [De centrummaten -...] [2014-10-10 14:01:34] [115da6a797a228c0404960d99697d46c] [Current]
Feedback Forum

Post a new message
Dataseries X:
219
231
247
259
278
289
252
224
242
303
305
283
259
224
252
273
252
265
285
224
283
279
296
269
252
226
259
301
260
282
311
263
276
296
310
290
273
267
302
322
314
300
316
299
295
340
333
316
294
309
354
335
313
338
357
324
296
378
343
301
309
271
308
326
336
310
335
298
288
319
328
315


Summary of computational transaction
Raw Inputview raw input (R code)
Raw Outputview raw output of R engine
Computing time2 seconds
R Server'Herman Ole Andreas Wold' @ wold.wessa.net

\begin{tabular}{lllllllll}
\hline
Summary of computational transaction \tabularnewline
Raw Input & view raw input (R code)  \tabularnewline
Raw Output & view raw output of R engine  \tabularnewline
Computing time & 2 seconds \tabularnewline
R Server & 'Herman Ole Andreas Wold' @ wold.wessa.net \tabularnewline
\hline
\end{tabular}
%Source: https://freestatistics.org/blog/index.php?pk=240318&T=0

[TABLE]
[ROW][C]Summary of computational transaction[/C][/ROW]
[ROW][C]Raw Input[/C][C]view raw input (R code) [/C][/ROW]
[ROW][C]Raw Output[/C][C]view raw output of R engine [/C][/ROW]
[ROW][C]Computing time[/C][C]2 seconds[/C][/ROW]
[ROW][C]R Server[/C][C]'Herman Ole Andreas Wold' @ wold.wessa.net[/C][/ROW]
[/TABLE]
Source: https://freestatistics.org/blog/index.php?pk=240318&T=0

Globally Unique Identifier (entire table): ba.freestatistics.org/blog/index.php?pk=240318&T=0

As an alternative you can also use a QR Code:  

The GUIDs for individual cells are displayed in the table below:

Summary of computational transaction
Raw Inputview raw input (R code)
Raw Outputview raw output of R engine
Computing time2 seconds
R Server'Herman Ole Andreas Wold' @ wold.wessa.net


Central Tendency - Ungrouped Data
MeasureValueS.E.Value/S.E.
Arithmetic Mean291.4027777777784.1356431775797870.4612959255129
Geometric Mean289.26795666698
Harmonic Mean287.080014723608
Quadratic Mean293.479012121064
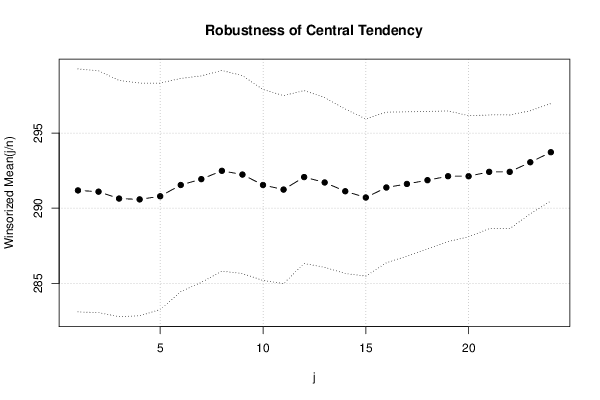
Winsorized Mean ( 1 / 24 )291.1805555555564.0423872301332872.0318314349006
Winsorized Mean ( 2 / 24 )291.0972222222224.023656558144172.346438622607
Winsorized Mean ( 3 / 24 )290.6388888888893.930106575882173.9519102795975
Winsorized Mean ( 4 / 24 )290.5833333333333.8731727480387875.0246250907537
Winsorized Mean ( 5 / 24 )290.7916666666673.768846096598277.1566838266859
Winsorized Mean ( 6 / 24 )291.5416666666673.5464687135886682.2061859870904
Winsorized Mean ( 7 / 24 )291.9305555555563.4366799854985884.9455162503889
Winsorized Mean ( 8 / 24 )292.4861111111113.3380244604751987.6225188204505
Winsorized Mean ( 9 / 24 )292.2361111111113.2938086900785788.7228550921519
Winsorized Mean ( 10 / 24 )291.5416666666673.177085497959791.7638719052075
Winsorized Mean ( 11 / 24 )291.2361111111113.1284757231555893.0920156917029
Winsorized Mean ( 12 / 24 )292.0694444444442.87856239039604101.463649153097
Winsorized Mean ( 13 / 24 )291.7083333333332.82305769228319103.330631226813
Winsorized Mean ( 14 / 24 )291.1252.73710788703871106.362267040547
Winsorized Mean ( 15 / 24 )290.7083333333332.61521950203391111.160203993295
Winsorized Mean ( 16 / 24 )291.3752.50691044133538116.228723290486
Winsorized Mean ( 17 / 24 )291.6111111111112.39983661705511121.512901769519
Winsorized Mean ( 18 / 24 )291.8611111111112.2883239005201127.543618735431
Winsorized Mean ( 19 / 24 )292.1252.17252165745538134.463561731375
Winsorized Mean ( 20 / 24 )292.1252.01558263457679144.933278838919
Winsorized Mean ( 21 / 24 )292.4166666666671.89201331853031154.553175605451
Winsorized Mean ( 22 / 24 )292.4166666666671.89201331853031154.553175605451
Winsorized Mean ( 23 / 24 )293.0555555555561.71364414264138171.013075739193
Winsorized Mean ( 24 / 24 )293.7222222222221.62135859275961181.158087750531
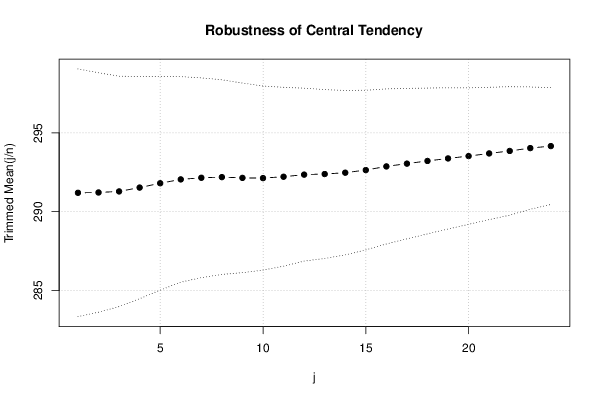
Trimmed Mean ( 1 / 24 )291.23.9323787310573374.051870360336
Trimmed Mean ( 2 / 24 )291.2205882352943.8015895656606376.6049525350815
Trimmed Mean ( 3 / 24 )291.2878787878793.6573370489675579.6448002707621
Trimmed Mean ( 4 / 24 )291.531253.5277365229277682.6397459405645
Trimmed Mean ( 5 / 24 )291.8064516129033.3925945660857786.0127686726731
Trimmed Mean ( 6 / 24 )292.053.2631675886880889.4989276715068
Trimmed Mean ( 7 / 24 )292.1551724137933.1717142301881892.112703481631
Trimmed Mean ( 8 / 24 )292.1964285714293.0886700835427894.6026673837149
Trimmed Mean ( 9 / 24 )292.1481481481483.0102790832271797.0501870660279
Trimmed Mean ( 10 / 24 )292.1346153846152.9227134706964199.9532175540312
Trimmed Mean ( 11 / 24 )292.222.83970248513495102.905146412235
Trimmed Mean ( 12 / 24 )292.3541666666672.7448355089222106.510632683218
Trimmed Mean ( 13 / 24 )292.3913043478262.68138659437109109.044814709535
Trimmed Mean ( 14 / 24 )292.4772727272732.61025150796725112.049460304705
Trimmed Mean ( 15 / 24 )292.6428571428572.53496373705159115.442620683493
Trimmed Mean ( 16 / 24 )292.8752.4615472255453118.980045136091
Trimmed Mean ( 17 / 24 )293.0526315789472.38891089430139122.672064612375
Trimmed Mean ( 18 / 24 )293.2222222222222.31527402852459126.646875751929
Trimmed Mean ( 19 / 24 )293.3823529411762.24085175503102130.924480962426
Trimmed Mean ( 20 / 24 )293.531252.16598724743439135.518457159749
Trimmed Mean ( 21 / 24 )293.72.1009849906733139.791574572781
Trimmed Mean ( 22 / 24 )293.8571428571432.03975974160609144.064586070202
Trimmed Mean ( 23 / 24 )294.0384615384621.94103918973695151.485072065088
Trimmed Mean ( 24 / 24 )294.1666666666671.85494508167726158.585108299098
Median296
Midrange298.5
Midmean - Weighted Average at Xnp292.459459459459
Midmean - Weighted Average at X(n+1)p293.222222222222
Midmean - Empirical Distribution Function292.459459459459
Midmean - Empirical Distribution Function - Averaging293.222222222222
Midmean - Empirical Distribution Function - Interpolation293.222222222222
Midmean - Closest Observation292.459459459459
Midmean - True Basic - Statistics Graphics Toolkit293.222222222222
Midmean - MS Excel (old versions)293.052631578947
Number of observations72

\begin{tabular}{lllllllll}
\hline
Central Tendency - Ungrouped Data \tabularnewline
Measure & Value & S.E. & Value/S.E. \tabularnewline
Arithmetic Mean & 291.402777777778 & 4.13564317757978 & 70.4612959255129 \tabularnewline
Geometric Mean & 289.26795666698 &  &  \tabularnewline
Harmonic Mean & 287.080014723608 &  &  \tabularnewline
Quadratic Mean & 293.479012121064 &  &  \tabularnewline
Winsorized Mean ( 1 / 24 ) & 291.180555555556 & 4.04238723013328 & 72.0318314349006 \tabularnewline
Winsorized Mean ( 2 / 24 ) & 291.097222222222 & 4.0236565581441 & 72.346438622607 \tabularnewline
Winsorized Mean ( 3 / 24 ) & 290.638888888889 & 3.9301065758821 & 73.9519102795975 \tabularnewline
Winsorized Mean ( 4 / 24 ) & 290.583333333333 & 3.87317274803878 & 75.0246250907537 \tabularnewline
Winsorized Mean ( 5 / 24 ) & 290.791666666667 & 3.7688460965982 & 77.1566838266859 \tabularnewline
Winsorized Mean ( 6 / 24 ) & 291.541666666667 & 3.54646871358866 & 82.2061859870904 \tabularnewline
Winsorized Mean ( 7 / 24 ) & 291.930555555556 & 3.43667998549858 & 84.9455162503889 \tabularnewline
Winsorized Mean ( 8 / 24 ) & 292.486111111111 & 3.33802446047519 & 87.6225188204505 \tabularnewline
Winsorized Mean ( 9 / 24 ) & 292.236111111111 & 3.29380869007857 & 88.7228550921519 \tabularnewline
Winsorized Mean ( 10 / 24 ) & 291.541666666667 & 3.1770854979597 & 91.7638719052075 \tabularnewline
Winsorized Mean ( 11 / 24 ) & 291.236111111111 & 3.12847572315558 & 93.0920156917029 \tabularnewline
Winsorized Mean ( 12 / 24 ) & 292.069444444444 & 2.87856239039604 & 101.463649153097 \tabularnewline
Winsorized Mean ( 13 / 24 ) & 291.708333333333 & 2.82305769228319 & 103.330631226813 \tabularnewline
Winsorized Mean ( 14 / 24 ) & 291.125 & 2.73710788703871 & 106.362267040547 \tabularnewline
Winsorized Mean ( 15 / 24 ) & 290.708333333333 & 2.61521950203391 & 111.160203993295 \tabularnewline
Winsorized Mean ( 16 / 24 ) & 291.375 & 2.50691044133538 & 116.228723290486 \tabularnewline
Winsorized Mean ( 17 / 24 ) & 291.611111111111 & 2.39983661705511 & 121.512901769519 \tabularnewline
Winsorized Mean ( 18 / 24 ) & 291.861111111111 & 2.2883239005201 & 127.543618735431 \tabularnewline
Winsorized Mean ( 19 / 24 ) & 292.125 & 2.17252165745538 & 134.463561731375 \tabularnewline
Winsorized Mean ( 20 / 24 ) & 292.125 & 2.01558263457679 & 144.933278838919 \tabularnewline
Winsorized Mean ( 21 / 24 ) & 292.416666666667 & 1.89201331853031 & 154.553175605451 \tabularnewline
Winsorized Mean ( 22 / 24 ) & 292.416666666667 & 1.89201331853031 & 154.553175605451 \tabularnewline
Winsorized Mean ( 23 / 24 ) & 293.055555555556 & 1.71364414264138 & 171.013075739193 \tabularnewline
Winsorized Mean ( 24 / 24 ) & 293.722222222222 & 1.62135859275961 & 181.158087750531 \tabularnewline
Trimmed Mean ( 1 / 24 ) & 291.2 & 3.93237873105733 & 74.051870360336 \tabularnewline
Trimmed Mean ( 2 / 24 ) & 291.220588235294 & 3.80158956566063 & 76.6049525350815 \tabularnewline
Trimmed Mean ( 3 / 24 ) & 291.287878787879 & 3.65733704896755 & 79.6448002707621 \tabularnewline
Trimmed Mean ( 4 / 24 ) & 291.53125 & 3.52773652292776 & 82.6397459405645 \tabularnewline
Trimmed Mean ( 5 / 24 ) & 291.806451612903 & 3.39259456608577 & 86.0127686726731 \tabularnewline
Trimmed Mean ( 6 / 24 ) & 292.05 & 3.26316758868808 & 89.4989276715068 \tabularnewline
Trimmed Mean ( 7 / 24 ) & 292.155172413793 & 3.17171423018818 & 92.112703481631 \tabularnewline
Trimmed Mean ( 8 / 24 ) & 292.196428571429 & 3.08867008354278 & 94.6026673837149 \tabularnewline
Trimmed Mean ( 9 / 24 ) & 292.148148148148 & 3.01027908322717 & 97.0501870660279 \tabularnewline
Trimmed Mean ( 10 / 24 ) & 292.134615384615 & 2.92271347069641 & 99.9532175540312 \tabularnewline
Trimmed Mean ( 11 / 24 ) & 292.22 & 2.83970248513495 & 102.905146412235 \tabularnewline
Trimmed Mean ( 12 / 24 ) & 292.354166666667 & 2.7448355089222 & 106.510632683218 \tabularnewline
Trimmed Mean ( 13 / 24 ) & 292.391304347826 & 2.68138659437109 & 109.044814709535 \tabularnewline
Trimmed Mean ( 14 / 24 ) & 292.477272727273 & 2.61025150796725 & 112.049460304705 \tabularnewline
Trimmed Mean ( 15 / 24 ) & 292.642857142857 & 2.53496373705159 & 115.442620683493 \tabularnewline
Trimmed Mean ( 16 / 24 ) & 292.875 & 2.4615472255453 & 118.980045136091 \tabularnewline
Trimmed Mean ( 17 / 24 ) & 293.052631578947 & 2.38891089430139 & 122.672064612375 \tabularnewline
Trimmed Mean ( 18 / 24 ) & 293.222222222222 & 2.31527402852459 & 126.646875751929 \tabularnewline
Trimmed Mean ( 19 / 24 ) & 293.382352941176 & 2.24085175503102 & 130.924480962426 \tabularnewline
Trimmed Mean ( 20 / 24 ) & 293.53125 & 2.16598724743439 & 135.518457159749 \tabularnewline
Trimmed Mean ( 21 / 24 ) & 293.7 & 2.1009849906733 & 139.791574572781 \tabularnewline
Trimmed Mean ( 22 / 24 ) & 293.857142857143 & 2.03975974160609 & 144.064586070202 \tabularnewline
Trimmed Mean ( 23 / 24 ) & 294.038461538462 & 1.94103918973695 & 151.485072065088 \tabularnewline
Trimmed Mean ( 24 / 24 ) & 294.166666666667 & 1.85494508167726 & 158.585108299098 \tabularnewline
Median & 296 &  &  \tabularnewline
Midrange & 298.5 &  &  \tabularnewline
Midmean - Weighted Average at Xnp & 292.459459459459 &  &  \tabularnewline
Midmean - Weighted Average at X(n+1)p & 293.222222222222 &  &  \tabularnewline
Midmean - Empirical Distribution Function & 292.459459459459 &  &  \tabularnewline
Midmean - Empirical Distribution Function - Averaging & 293.222222222222 &  &  \tabularnewline
Midmean - Empirical Distribution Function - Interpolation & 293.222222222222 &  &  \tabularnewline
Midmean - Closest Observation & 292.459459459459 &  &  \tabularnewline
Midmean - True Basic - Statistics Graphics Toolkit & 293.222222222222 &  &  \tabularnewline
Midmean - MS Excel (old versions) & 293.052631578947 &  &  \tabularnewline
Number of observations & 72 &  &  \tabularnewline
\hline
\end{tabular}
%Source: https://freestatistics.org/blog/index.php?pk=240318&T=1

[TABLE]
[ROW][C]Central Tendency - Ungrouped Data[/C][/ROW]
[ROW][C]Measure[/C][C]Value[/C][C]S.E.[/C][C]Value/S.E.[/C][/ROW]
[ROW][C]Arithmetic Mean[/C][C]291.402777777778[/C][C]4.13564317757978[/C][C]70.4612959255129[/C][/ROW]
[ROW][C]Geometric Mean[/C][C]289.26795666698[/C][C][/C][C][/C][/ROW]
[ROW][C]Harmonic Mean[/C][C]287.080014723608[/C][C][/C][C][/C][/ROW]
[ROW][C]Quadratic Mean[/C][C]293.479012121064[/C][C][/C][C][/C][/ROW]
[ROW][C]Winsorized Mean ( 1 / 24 )[/C][C]291.180555555556[/C][C]4.04238723013328[/C][C]72.0318314349006[/C][/ROW]
[ROW][C]Winsorized Mean ( 2 / 24 )[/C][C]291.097222222222[/C][C]4.0236565581441[/C][C]72.346438622607[/C][/ROW]
[ROW][C]Winsorized Mean ( 3 / 24 )[/C][C]290.638888888889[/C][C]3.9301065758821[/C][C]73.9519102795975[/C][/ROW]
[ROW][C]Winsorized Mean ( 4 / 24 )[/C][C]290.583333333333[/C][C]3.87317274803878[/C][C]75.0246250907537[/C][/ROW]
[ROW][C]Winsorized Mean ( 5 / 24 )[/C][C]290.791666666667[/C][C]3.7688460965982[/C][C]77.1566838266859[/C][/ROW]
[ROW][C]Winsorized Mean ( 6 / 24 )[/C][C]291.541666666667[/C][C]3.54646871358866[/C][C]82.2061859870904[/C][/ROW]
[ROW][C]Winsorized Mean ( 7 / 24 )[/C][C]291.930555555556[/C][C]3.43667998549858[/C][C]84.9455162503889[/C][/ROW]
[ROW][C]Winsorized Mean ( 8 / 24 )[/C][C]292.486111111111[/C][C]3.33802446047519[/C][C]87.6225188204505[/C][/ROW]
[ROW][C]Winsorized Mean ( 9 / 24 )[/C][C]292.236111111111[/C][C]3.29380869007857[/C][C]88.7228550921519[/C][/ROW]
[ROW][C]Winsorized Mean ( 10 / 24 )[/C][C]291.541666666667[/C][C]3.1770854979597[/C][C]91.7638719052075[/C][/ROW]
[ROW][C]Winsorized Mean ( 11 / 24 )[/C][C]291.236111111111[/C][C]3.12847572315558[/C][C]93.0920156917029[/C][/ROW]
[ROW][C]Winsorized Mean ( 12 / 24 )[/C][C]292.069444444444[/C][C]2.87856239039604[/C][C]101.463649153097[/C][/ROW]
[ROW][C]Winsorized Mean ( 13 / 24 )[/C][C]291.708333333333[/C][C]2.82305769228319[/C][C]103.330631226813[/C][/ROW]
[ROW][C]Winsorized Mean ( 14 / 24 )[/C][C]291.125[/C][C]2.73710788703871[/C][C]106.362267040547[/C][/ROW]
[ROW][C]Winsorized Mean ( 15 / 24 )[/C][C]290.708333333333[/C][C]2.61521950203391[/C][C]111.160203993295[/C][/ROW]
[ROW][C]Winsorized Mean ( 16 / 24 )[/C][C]291.375[/C][C]2.50691044133538[/C][C]116.228723290486[/C][/ROW]
[ROW][C]Winsorized Mean ( 17 / 24 )[/C][C]291.611111111111[/C][C]2.39983661705511[/C][C]121.512901769519[/C][/ROW]
[ROW][C]Winsorized Mean ( 18 / 24 )[/C][C]291.861111111111[/C][C]2.2883239005201[/C][C]127.543618735431[/C][/ROW]
[ROW][C]Winsorized Mean ( 19 / 24 )[/C][C]292.125[/C][C]2.17252165745538[/C][C]134.463561731375[/C][/ROW]
[ROW][C]Winsorized Mean ( 20 / 24 )[/C][C]292.125[/C][C]2.01558263457679[/C][C]144.933278838919[/C][/ROW]
[ROW][C]Winsorized Mean ( 21 / 24 )[/C][C]292.416666666667[/C][C]1.89201331853031[/C][C]154.553175605451[/C][/ROW]
[ROW][C]Winsorized Mean ( 22 / 24 )[/C][C]292.416666666667[/C][C]1.89201331853031[/C][C]154.553175605451[/C][/ROW]
[ROW][C]Winsorized Mean ( 23 / 24 )[/C][C]293.055555555556[/C][C]1.71364414264138[/C][C]171.013075739193[/C][/ROW]
[ROW][C]Winsorized Mean ( 24 / 24 )[/C][C]293.722222222222[/C][C]1.62135859275961[/C][C]181.158087750531[/C][/ROW]
[ROW][C]Trimmed Mean ( 1 / 24 )[/C][C]291.2[/C][C]3.93237873105733[/C][C]74.051870360336[/C][/ROW]
[ROW][C]Trimmed Mean ( 2 / 24 )[/C][C]291.220588235294[/C][C]3.80158956566063[/C][C]76.6049525350815[/C][/ROW]
[ROW][C]Trimmed Mean ( 3 / 24 )[/C][C]291.287878787879[/C][C]3.65733704896755[/C][C]79.6448002707621[/C][/ROW]
[ROW][C]Trimmed Mean ( 4 / 24 )[/C][C]291.53125[/C][C]3.52773652292776[/C][C]82.6397459405645[/C][/ROW]
[ROW][C]Trimmed Mean ( 5 / 24 )[/C][C]291.806451612903[/C][C]3.39259456608577[/C][C]86.0127686726731[/C][/ROW]
[ROW][C]Trimmed Mean ( 6 / 24 )[/C][C]292.05[/C][C]3.26316758868808[/C][C]89.4989276715068[/C][/ROW]
[ROW][C]Trimmed Mean ( 7 / 24 )[/C][C]292.155172413793[/C][C]3.17171423018818[/C][C]92.112703481631[/C][/ROW]
[ROW][C]Trimmed Mean ( 8 / 24 )[/C][C]292.196428571429[/C][C]3.08867008354278[/C][C]94.6026673837149[/C][/ROW]
[ROW][C]Trimmed Mean ( 9 / 24 )[/C][C]292.148148148148[/C][C]3.01027908322717[/C][C]97.0501870660279[/C][/ROW]
[ROW][C]Trimmed Mean ( 10 / 24 )[/C][C]292.134615384615[/C][C]2.92271347069641[/C][C]99.9532175540312[/C][/ROW]
[ROW][C]Trimmed Mean ( 11 / 24 )[/C][C]292.22[/C][C]2.83970248513495[/C][C]102.905146412235[/C][/ROW]
[ROW][C]Trimmed Mean ( 12 / 24 )[/C][C]292.354166666667[/C][C]2.7448355089222[/C][C]106.510632683218[/C][/ROW]
[ROW][C]Trimmed Mean ( 13 / 24 )[/C][C]292.391304347826[/C][C]2.68138659437109[/C][C]109.044814709535[/C][/ROW]
[ROW][C]Trimmed Mean ( 14 / 24 )[/C][C]292.477272727273[/C][C]2.61025150796725[/C][C]112.049460304705[/C][/ROW]
[ROW][C]Trimmed Mean ( 15 / 24 )[/C][C]292.642857142857[/C][C]2.53496373705159[/C][C]115.442620683493[/C][/ROW]
[ROW][C]Trimmed Mean ( 16 / 24 )[/C][C]292.875[/C][C]2.4615472255453[/C][C]118.980045136091[/C][/ROW]
[ROW][C]Trimmed Mean ( 17 / 24 )[/C][C]293.052631578947[/C][C]2.38891089430139[/C][C]122.672064612375[/C][/ROW]
[ROW][C]Trimmed Mean ( 18 / 24 )[/C][C]293.222222222222[/C][C]2.31527402852459[/C][C]126.646875751929[/C][/ROW]
[ROW][C]Trimmed Mean ( 19 / 24 )[/C][C]293.382352941176[/C][C]2.24085175503102[/C][C]130.924480962426[/C][/ROW]
[ROW][C]Trimmed Mean ( 20 / 24 )[/C][C]293.53125[/C][C]2.16598724743439[/C][C]135.518457159749[/C][/ROW]
[ROW][C]Trimmed Mean ( 21 / 24 )[/C][C]293.7[/C][C]2.1009849906733[/C][C]139.791574572781[/C][/ROW]
[ROW][C]Trimmed Mean ( 22 / 24 )[/C][C]293.857142857143[/C][C]2.03975974160609[/C][C]144.064586070202[/C][/ROW]
[ROW][C]Trimmed Mean ( 23 / 24 )[/C][C]294.038461538462[/C][C]1.94103918973695[/C][C]151.485072065088[/C][/ROW]
[ROW][C]Trimmed Mean ( 24 / 24 )[/C][C]294.166666666667[/C][C]1.85494508167726[/C][C]158.585108299098[/C][/ROW]
[ROW][C]Median[/C][C]296[/C][C][/C][C][/C][/ROW]
[ROW][C]Midrange[/C][C]298.5[/C][C][/C][C][/C][/ROW]
[ROW][C]Midmean - Weighted Average at Xnp[/C][C]292.459459459459[/C][C][/C][C][/C][/ROW]
[ROW][C]Midmean - Weighted Average at X(n+1)p[/C][C]293.222222222222[/C][C][/C][C][/C][/ROW]
[ROW][C]Midmean - Empirical Distribution Function[/C][C]292.459459459459[/C][C][/C][C][/C][/ROW]
[ROW][C]Midmean - Empirical Distribution Function - Averaging[/C][C]293.222222222222[/C][C][/C][C][/C][/ROW]
[ROW][C]Midmean - Empirical Distribution Function - Interpolation[/C][C]293.222222222222[/C][C][/C][C][/C][/ROW]
[ROW][C]Midmean - Closest Observation[/C][C]292.459459459459[/C][C][/C][C][/C][/ROW]
[ROW][C]Midmean - True Basic - Statistics Graphics Toolkit[/C][C]293.222222222222[/C][C][/C][C][/C][/ROW]
[ROW][C]Midmean - MS Excel (old versions)[/C][C]293.052631578947[/C][C][/C][C][/C][/ROW]
[ROW][C]Number of observations[/C][C]72[/C][C][/C][C][/C][/ROW]
[/TABLE]
Source: https://freestatistics.org/blog/index.php?pk=240318&T=1

Globally Unique Identifier (entire table): ba.freestatistics.org/blog/index.php?pk=240318&T=1

As an alternative you can also use a QR Code:  

The GUIDs for individual cells are displayed in the table below:

Central Tendency - Ungrouped Data
MeasureValueS.E.Value/S.E.
Arithmetic Mean291.4027777777784.1356431775797870.4612959255129
Geometric Mean289.26795666698
Harmonic Mean287.080014723608
Quadratic Mean293.479012121064
Winsorized Mean ( 1 / 24 )291.1805555555564.0423872301332872.0318314349006
Winsorized Mean ( 2 / 24 )291.0972222222224.023656558144172.346438622607
Winsorized Mean ( 3 / 24 )290.6388888888893.930106575882173.9519102795975
Winsorized Mean ( 4 / 24 )290.5833333333333.8731727480387875.0246250907537
Winsorized Mean ( 5 / 24 )290.7916666666673.768846096598277.1566838266859
Winsorized Mean ( 6 / 24 )291.5416666666673.5464687135886682.2061859870904
Winsorized Mean ( 7 / 24 )291.9305555555563.4366799854985884.9455162503889
Winsorized Mean ( 8 / 24 )292.4861111111113.3380244604751987.6225188204505
Winsorized Mean ( 9 / 24 )292.2361111111113.2938086900785788.7228550921519
Winsorized Mean ( 10 / 24 )291.5416666666673.177085497959791.7638719052075
Winsorized Mean ( 11 / 24 )291.2361111111113.1284757231555893.0920156917029
Winsorized Mean ( 12 / 24 )292.0694444444442.87856239039604101.463649153097
Winsorized Mean ( 13 / 24 )291.7083333333332.82305769228319103.330631226813
Winsorized Mean ( 14 / 24 )291.1252.73710788703871106.362267040547
Winsorized Mean ( 15 / 24 )290.7083333333332.61521950203391111.160203993295
Winsorized Mean ( 16 / 24 )291.3752.50691044133538116.228723290486
Winsorized Mean ( 17 / 24 )291.6111111111112.39983661705511121.512901769519
Winsorized Mean ( 18 / 24 )291.8611111111112.2883239005201127.543618735431
Winsorized Mean ( 19 / 24 )292.1252.17252165745538134.463561731375
Winsorized Mean ( 20 / 24 )292.1252.01558263457679144.933278838919
Winsorized Mean ( 21 / 24 )292.4166666666671.89201331853031154.553175605451
Winsorized Mean ( 22 / 24 )292.4166666666671.89201331853031154.553175605451
Winsorized Mean ( 23 / 24 )293.0555555555561.71364414264138171.013075739193
Winsorized Mean ( 24 / 24 )293.7222222222221.62135859275961181.158087750531
Trimmed Mean ( 1 / 24 )291.23.9323787310573374.051870360336
Trimmed Mean ( 2 / 24 )291.2205882352943.8015895656606376.6049525350815
Trimmed Mean ( 3 / 24 )291.2878787878793.6573370489675579.6448002707621
Trimmed Mean ( 4 / 24 )291.531253.5277365229277682.6397459405645
Trimmed Mean ( 5 / 24 )291.8064516129033.3925945660857786.0127686726731
Trimmed Mean ( 6 / 24 )292.053.2631675886880889.4989276715068
Trimmed Mean ( 7 / 24 )292.1551724137933.1717142301881892.112703481631
Trimmed Mean ( 8 / 24 )292.1964285714293.0886700835427894.6026673837149
Trimmed Mean ( 9 / 24 )292.1481481481483.0102790832271797.0501870660279
Trimmed Mean ( 10 / 24 )292.1346153846152.9227134706964199.9532175540312
Trimmed Mean ( 11 / 24 )292.222.83970248513495102.905146412235
Trimmed Mean ( 12 / 24 )292.3541666666672.7448355089222106.510632683218
Trimmed Mean ( 13 / 24 )292.3913043478262.68138659437109109.044814709535
Trimmed Mean ( 14 / 24 )292.4772727272732.61025150796725112.049460304705
Trimmed Mean ( 15 / 24 )292.6428571428572.53496373705159115.442620683493
Trimmed Mean ( 16 / 24 )292.8752.4615472255453118.980045136091
Trimmed Mean ( 17 / 24 )293.0526315789472.38891089430139122.672064612375
Trimmed Mean ( 18 / 24 )293.2222222222222.31527402852459126.646875751929
Trimmed Mean ( 19 / 24 )293.3823529411762.24085175503102130.924480962426
Trimmed Mean ( 20 / 24 )293.531252.16598724743439135.518457159749
Trimmed Mean ( 21 / 24 )293.72.1009849906733139.791574572781
Trimmed Mean ( 22 / 24 )293.8571428571432.03975974160609144.064586070202
Trimmed Mean ( 23 / 24 )294.0384615384621.94103918973695151.485072065088
Trimmed Mean ( 24 / 24 )294.1666666666671.85494508167726158.585108299098
Median296
Midrange298.5
Midmean - Weighted Average at Xnp292.459459459459
Midmean - Weighted Average at X(n+1)p293.222222222222
Midmean - Empirical Distribution Function292.459459459459
Midmean - Empirical Distribution Function - Averaging293.222222222222
Midmean - Empirical Distribution Function - Interpolation293.222222222222
Midmean - Closest Observation292.459459459459
Midmean - True Basic - Statistics Graphics Toolkit293.222222222222
Midmean - MS Excel (old versions)293.052631578947
Number of observations72


Parameters (Session):
Parameters (R input):
R code (references can be found in the software module):
geomean <- function(x) {
return(exp(mean(log(x))))
}
harmean <- function(x) {
return(1/mean(1/x))
}
quamean <- function(x) {
return(sqrt(mean(x*x)))
}
winmean <- function(x) {
x <-sort(x[!is.na(x)])
n<-length(x)
denom <- 3
nodenom <- n/denom
if (nodenom>40) denom <- n/40
sqrtn = sqrt(n)
roundnodenom = floor(nodenom)
win <- array(NA,dim=c(roundnodenom,2))
for (j in 1:roundnodenom) {
win[j,1] <- (j*x[j+1]+sum(x[(j+1):(n-j)])+j*x[n-j])/n
win[j,2] <- sd(c(rep(x[j+1],j),x[(j+1):(n-j)],rep(x[n-j],j)))/sqrtn
}
return(win)
}
trimean <- function(x) {
x <-sort(x[!is.na(x)])
n<-length(x)
denom <- 3
nodenom <- n/denom
if (nodenom>40) denom <- n/40
sqrtn = sqrt(n)
roundnodenom = floor(nodenom)
tri <- array(NA,dim=c(roundnodenom,2))
for (j in 1:roundnodenom) {
tri[j,1] <- mean(x,trim=j/n)
tri[j,2] <- sd(x[(j+1):(n-j)]) / sqrt(n-j*2)
}
return(tri)
}
midrange <- function(x) {
return((max(x)+min(x))/2)
}
q1 <- function(data,n,p,i,f) {
np <- n*p;
i <<- floor(np)
f <<- np - i
qvalue <- (1-f)*data[i] + f*data[i+1]
}
q2 <- function(data,n,p,i,f) {
np <- (n+1)*p
i <<- floor(np)
f <<- np - i
qvalue <- (1-f)*data[i] + f*data[i+1]
}
q3 <- function(data,n,p,i,f) {
np <- n*p
i <<- floor(np)
f <<- np - i
if (f==0) {
qvalue <- data[i]
} else {
qvalue <- data[i+1]
}
}
q4 <- function(data,n,p,i,f) {
np <- n*p
i <<- floor(np)
f <<- np - i
if (f==0) {
qvalue <- (data[i]+data[i+1])/2
} else {
qvalue <- data[i+1]
}
}
q5 <- function(data,n,p,i,f) {
np <- (n-1)*p
i <<- floor(np)
f <<- np - i
if (f==0) {
qvalue <- data[i+1]
} else {
qvalue <- data[i+1] + f*(data[i+2]-data[i+1])
}
}
q6 <- function(data,n,p,i,f) {
np <- n*p+0.5
i <<- floor(np)
f <<- np - i
qvalue <- data[i]
}
q7 <- function(data,n,p,i,f) {
np <- (n+1)*p
i <<- floor(np)
f <<- np - i
if (f==0) {
qvalue <- data[i]
} else {
qvalue <- f*data[i] + (1-f)*data[i+1]
}
}
q8 <- function(data,n,p,i,f) {
np <- (n+1)*p
i <<- floor(np)
f <<- np - i
if (f==0) {
qvalue <- data[i]
} else {
if (f == 0.5) {
qvalue <- (data[i]+data[i+1])/2
} else {
if (f < 0.5) {
qvalue <- data[i]
} else {
qvalue <- data[i+1]
}
}
}
}
midmean <- function(x,def) {
x <-sort(x[!is.na(x)])
n<-length(x)
if (def==1) {
qvalue1 <- q1(x,n,0.25,i,f)
qvalue3 <- q1(x,n,0.75,i,f)
}
if (def==2) {
qvalue1 <- q2(x,n,0.25,i,f)
qvalue3 <- q2(x,n,0.75,i,f)
}
if (def==3) {
qvalue1 <- q3(x,n,0.25,i,f)
qvalue3 <- q3(x,n,0.75,i,f)
}
if (def==4) {
qvalue1 <- q4(x,n,0.25,i,f)
qvalue3 <- q4(x,n,0.75,i,f)
}
if (def==5) {
qvalue1 <- q5(x,n,0.25,i,f)
qvalue3 <- q5(x,n,0.75,i,f)
}
if (def==6) {
qvalue1 <- q6(x,n,0.25,i,f)
qvalue3 <- q6(x,n,0.75,i,f)
}
if (def==7) {
qvalue1 <- q7(x,n,0.25,i,f)
qvalue3 <- q7(x,n,0.75,i,f)
}
if (def==8) {
qvalue1 <- q8(x,n,0.25,i,f)
qvalue3 <- q8(x,n,0.75,i,f)
}
midm <- 0
myn <- 0
roundno4 <- round(n/4)
round3no4 <- round(3*n/4)
for (i in 1:n) {
if ((x[i]>=qvalue1) & (x[i]<=qvalue3)){
midm = midm + x[i]
myn = myn + 1
}
}
midm = midm / myn
return(midm)
}
(arm <- mean(x))
sqrtn <- sqrt(length(x))
(armse <- sd(x) / sqrtn)
(armose <- arm / armse)
(geo <- geomean(x))
(har <- harmean(x))
(qua <- quamean(x))
(win <- winmean(x))
(tri <- trimean(x))
(midr <- midrange(x))
midm <- array(NA,dim=8)
for (j in 1:8) midm[j] <- midmean(x,j)
midm
bitmap(file='test1.png')
lb <- win[,1] - 2*win[,2]
ub <- win[,1] + 2*win[,2]
if ((ylimmin == '') | (ylimmax == '')) plot(win[,1],type='b',main=main, xlab='j', pch=19, ylab='Winsorized Mean(j/n)', ylim=c(min(lb),max(ub))) else plot(win[,1],type='l',main=main, xlab='j', pch=19, ylab='Winsorized Mean(j/n)', ylim=c(ylimmin,ylimmax))
lines(ub,lty=3)
lines(lb,lty=3)
grid()
dev.off()
bitmap(file='test2.png')
lb <- tri[,1] - 2*tri[,2]
ub <- tri[,1] + 2*tri[,2]
if ((ylimmin == '') | (ylimmax == '')) plot(tri[,1],type='b',main=main, xlab='j', pch=19, ylab='Trimmed Mean(j/n)', ylim=c(min(lb),max(ub))) else plot(tri[,1],type='l',main=main, xlab='j', pch=19, ylab='Trimmed Mean(j/n)', ylim=c(ylimmin,ylimmax))
lines(ub,lty=3)
lines(lb,lty=3)
grid()
dev.off()
load(file='createtable')
a<-table.start()
a<-table.row.start(a)
a<-table.element(a,'Central Tendency - Ungrouped Data',4,TRUE)
a<-table.row.end(a)
a<-table.row.start(a)
a<-table.element(a,'Measure',header=TRUE)
a<-table.element(a,'Value',header=TRUE)
a<-table.element(a,'S.E.',header=TRUE)
a<-table.element(a,'Value/S.E.',header=TRUE)
a<-table.row.end(a)
a<-table.row.start(a)
a<-table.element(a,hyperlink('arithmetic_mean.htm', 'Arithmetic Mean', 'click to view the definition of the Arithmetic Mean'),header=TRUE)
a<-table.element(a,arm)
a<-table.element(a,hyperlink('arithmetic_mean_standard_error.htm', armse, 'click to view the definition of the Standard Error of the Arithmetic Mean'))
a<-table.element(a,armose)
a<-table.row.end(a)
a<-table.row.start(a)
a<-table.element(a,hyperlink('geometric_mean.htm', 'Geometric Mean', 'click to view the definition of the Geometric Mean'),header=TRUE)
a<-table.element(a,geo)
a<-table.element(a,'')
a<-table.row.end(a)
a<-table.row.start(a)
a<-table.element(a,hyperlink('harmonic_mean.htm', 'Harmonic Mean', 'click to view the definition of the Harmonic Mean'),header=TRUE)
a<-table.element(a,har)
a<-table.element(a,'')
a<-table.row.end(a)
a<-table.row.start(a)
a<-table.element(a,hyperlink('quadratic_mean.htm', 'Quadratic Mean', 'click to view the definition of the Quadratic Mean'),header=TRUE)
a<-table.element(a,qua)
a<-table.element(a,'')
a<-table.row.end(a)
for (j in 1:length(win[,1])) {
a<-table.row.start(a)
mylabel <- paste('Winsorized Mean (',j)
mylabel <- paste(mylabel,'/')
mylabel <- paste(mylabel,length(win[,1]))
mylabel <- paste(mylabel,')')
a<-table.element(a,hyperlink('winsorized_mean.htm', mylabel, 'click to view the definition of the Winsorized Mean'),header=TRUE)
a<-table.element(a,win[j,1])
a<-table.element(a,win[j,2])
a<-table.element(a,win[j,1]/win[j,2])
a<-table.row.end(a)
}
for (j in 1:length(tri[,1])) {
a<-table.row.start(a)
mylabel <- paste('Trimmed Mean (',j)
mylabel <- paste(mylabel,'/')
mylabel <- paste(mylabel,length(tri[,1]))
mylabel <- paste(mylabel,')')
a<-table.element(a,hyperlink('arithmetic_mean.htm', mylabel, 'click to view the definition of the Trimmed Mean'),header=TRUE)
a<-table.element(a,tri[j,1])
a<-table.element(a,tri[j,2])
a<-table.element(a,tri[j,1]/tri[j,2])
a<-table.row.end(a)
}
a<-table.row.start(a)
a<-table.element(a,hyperlink('median_1.htm', 'Median', 'click to view the definition of the Median'),header=TRUE)
a<-table.element(a,median(x))
a<-table.element(a,'')
a<-table.row.end(a)
a<-table.row.start(a)
a<-table.element(a,hyperlink('midrange.htm', 'Midrange', 'click to view the definition of the Midrange'),header=TRUE)
a<-table.element(a,midr)
a<-table.element(a,'')
a<-table.row.end(a)
a<-table.row.start(a)
mymid <- hyperlink('midmean.htm', 'Midmean', 'click to view the definition of the Midmean')
mylabel <- paste(mymid,hyperlink('method_1.htm','Weighted Average at Xnp',''),sep=' - ')
a<-table.element(a,mylabel,header=TRUE)
a<-table.element(a,midm[1])
a<-table.element(a,'')
a<-table.row.end(a)
a<-table.row.start(a)
mymid <- hyperlink('midmean.htm', 'Midmean', 'click to view the definition of the Midmean')
mylabel <- paste(mymid,hyperlink('method_2.htm','Weighted Average at X(n+1)p',''),sep=' - ')
a<-table.element(a,mylabel,header=TRUE)
a<-table.element(a,midm[2])
a<-table.element(a,'')
a<-table.row.end(a)
a<-table.row.start(a)
mymid <- hyperlink('midmean.htm', 'Midmean', 'click to view the definition of the Midmean')
mylabel <- paste(mymid,hyperlink('method_3.htm','Empirical Distribution Function',''),sep=' - ')
a<-table.element(a,mylabel,header=TRUE)
a<-table.element(a,midm[3])
a<-table.element(a,'')
a<-table.row.end(a)
a<-table.row.start(a)
mymid <- hyperlink('midmean.htm', 'Midmean', 'click to view the definition of the Midmean')
mylabel <- paste(mymid,hyperlink('method_4.htm','Empirical Distribution Function - Averaging',''),sep=' - ')
a<-table.element(a,mylabel,header=TRUE)
a<-table.element(a,midm[4])
a<-table.element(a,'')
a<-table.row.end(a)
a<-table.row.start(a)
mymid <- hyperlink('midmean.htm', 'Midmean', 'click to view the definition of the Midmean')
mylabel <- paste(mymid,hyperlink('method_5.htm','Empirical Distribution Function - Interpolation',''),sep=' - ')
a<-table.element(a,mylabel,header=TRUE)
a<-table.element(a,midm[5])
a<-table.element(a,'')
a<-table.row.end(a)
a<-table.row.start(a)
mymid <- hyperlink('midmean.htm', 'Midmean', 'click to view the definition of the Midmean')
mylabel <- paste(mymid,hyperlink('method_6.htm','Closest Observation',''),sep=' - ')
a<-table.element(a,mylabel,header=TRUE)
a<-table.element(a,midm[6])
a<-table.element(a,'')
a<-table.row.end(a)
a<-table.row.start(a)
mymid <- hyperlink('midmean.htm', 'Midmean', 'click to view the definition of the Midmean')
mylabel <- paste(mymid,hyperlink('method_7.htm','True Basic - Statistics Graphics Toolkit',''),sep=' - ')
a<-table.element(a,mylabel,header=TRUE)
a<-table.element(a,midm[7])
a<-table.element(a,'')
a<-table.row.end(a)
a<-table.row.start(a)
mymid <- hyperlink('midmean.htm', 'Midmean', 'click to view the definition of the Midmean')
mylabel <- paste(mymid,hyperlink('method_8.htm','MS Excel (old versions)',''),sep=' - ')
a<-table.element(a,mylabel,header=TRUE)
a<-table.element(a,midm[8])
a<-table.element(a,'')
a<-table.row.end(a)
a<-table.row.start(a)
a<-table.element(a,'Number of observations',header=TRUE)
a<-table.element(a,length(x))
a<-table.element(a,'')
a<-table.row.end(a)
a<-table.end(a)
table.save(a,file='mytable.tab')