Free Statistics

of Irreproducible Research!

Author's title

Author*Unverified author*
R Software Modulerwasp_centraltendency.wasp
Title produced by softwareCentral Tendency
Date of computationFri, 10 Oct 2014 13:48:39 +0100
Cite this page as followsStatistical Computations at FreeStatistics.org, Office for Research Development and Education, URL https://freestatistics.org/blog/index.php?v=date/2014/Oct/10/t14129454188nkb4a4b2d9u59l.htm/, Retrieved Mon, 13 May 2024 15:49:33 +0000
Statistical Computations at FreeStatistics.org, Office for Research Development and Education, URL https://freestatistics.org/blog/index.php?pk=240291, Retrieved Mon, 13 May 2024 15:49:33 +0000
QR Codes:

Original text written by user:
IsPrivate?No (this computation is public)
User-defined keywords
Estimated Impact107
Family? (F = Feedback message, R = changed R code, M = changed R Module, P = changed Parameters, D = changed Data)
-     [Central Tendency] [] [2014-10-10 12:21:19] [5b8e3de349b425adf498340f25b552b3]
-    D    [Central Tendency] [] [2014-10-10 12:48:39] [a0c7ba102f88b9f955287def3adf2996] [Current]
Feedback Forum

Post a new message
Dataseries X:
12849
11380
12079
11366
11328
10444
10854
10434
10137
10992
10906
12367
14371
11695
11546
10922
10670
10254
10573
10239
10253
11176
10719
11817
12487
11519
12025
10976
11276
10657
11141
10423
10640
11426
10948
12540
12200
10644
12044
11338
11292
10612
10995
10686
10635
11285
11475
12535
12490
12511
12799
11876
11602
11062
11055
10855
10704
11510
11663
12686
13516
12539
13811
12354
11441
10814
11261
10788
10326
11490
11029
11876


Summary of computational transaction
Raw Inputview raw input (R code)
Raw Outputview raw output of R engine
Computing time1 seconds
R Server'Sir Maurice George Kendall' @ kendall.wessa.net

\begin{tabular}{lllllllll}
\hline
Summary of computational transaction \tabularnewline
Raw Input & view raw input (R code)  \tabularnewline
Raw Output & view raw output of R engine  \tabularnewline
Computing time & 1 seconds \tabularnewline
R Server & 'Sir Maurice George Kendall' @ kendall.wessa.net \tabularnewline
\hline
\end{tabular}
%Source: https://freestatistics.org/blog/index.php?pk=240291&T=0

[TABLE]
[ROW][C]Summary of computational transaction[/C][/ROW]
[ROW][C]Raw Input[/C][C]view raw input (R code) [/C][/ROW]
[ROW][C]Raw Output[/C][C]view raw output of R engine [/C][/ROW]
[ROW][C]Computing time[/C][C]1 seconds[/C][/ROW]
[ROW][C]R Server[/C][C]'Sir Maurice George Kendall' @ kendall.wessa.net[/C][/ROW]
[/TABLE]
Source: https://freestatistics.org/blog/index.php?pk=240291&T=0

Globally Unique Identifier (entire table): ba.freestatistics.org/blog/index.php?pk=240291&T=0

As an alternative you can also use a QR Code:  

The GUIDs for individual cells are displayed in the table below:

Summary of computational transaction
Raw Inputview raw input (R code)
Raw Outputview raw output of R engine
Computing time1 seconds
R Server'Sir Maurice George Kendall' @ kendall.wessa.net


Central Tendency - Ungrouped Data
MeasureValueS.E.Value/S.E.
Arithmetic Mean11433.7222222222103.765334334898110.188265623666
Geometric Mean11401.6908157699
Harmonic Mean11370.9731460518
Quadratic Mean11467.1041776999
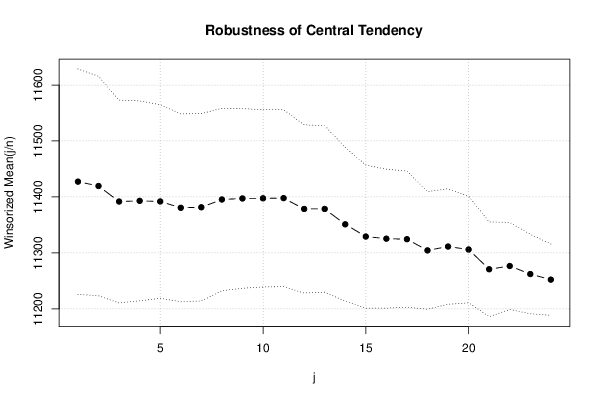
Winsorized Mean ( 1 / 24 )11427.3611111111100.67161265085113.511255161309
Winsorized Mean ( 2 / 24 )11419.555555555698.0041196494637116.521178868811
Winsorized Mean ( 3 / 24 )11391.805555555690.6225547700743125.706073774444
Winsorized Mean ( 4 / 24 )11393.027777777889.309652308091127.567709461854
Winsorized Mean ( 5 / 24 )11391.916666666786.5137707610696131.677495576148
Winsorized Mean ( 6 / 24 )11380.666666666783.9016069912374135.643011794223
Winsorized Mean ( 7 / 24 )11381.541666666783.7287658772577135.933469786853
Winsorized Mean ( 8 / 24 )11395.430555555681.4912743065297139.836205195315
Winsorized Mean ( 9 / 24 )11397.305555555680.2198798502963142.075824307202
Winsorized Mean ( 10 / 24 )11397.583333333379.2146426164464143.88227929677
Winsorized Mean ( 11 / 24 )11397.888888888979.0222640413676144.236425356304
Winsorized Mean ( 12 / 24 )11378.555555555675.1350632814472151.441351861684
Winsorized Mean ( 13 / 24 )11378.555555555674.3788569018467152.981049044235
Winsorized Mean ( 14 / 24 )11351.138888888968.6503390769607165.347164216679
Winsorized Mean ( 15 / 24 )11329.263888888963.8992445637038177.298870530375
Winsorized Mean ( 16 / 24 )11325.486111111162.0565772229327182.502590666986
Winsorized Mean ( 17 / 24 )11324.541666666760.8288921701898186.170440766574
Winsorized Mean ( 18 / 24 )11304.541666666752.5378615153456215.169429067164
Winsorized Mean ( 19 / 24 )11311.402777777851.5969378774204219.226241771371
Winsorized Mean ( 20 / 24 )11306.12547.5961917766051237.542638979728
Winsorized Mean ( 21 / 24 )11270.833333333342.3463530309692266.158299986084
Winsorized Mean ( 22 / 24 )11276.638888888938.8455133408207290.294500421465
Winsorized Mean ( 23 / 24 )11262.263888888935.4756081924723317.464998141418
Winsorized Mean ( 24 / 24 )11252.263888888931.8323316280193353.485381478763
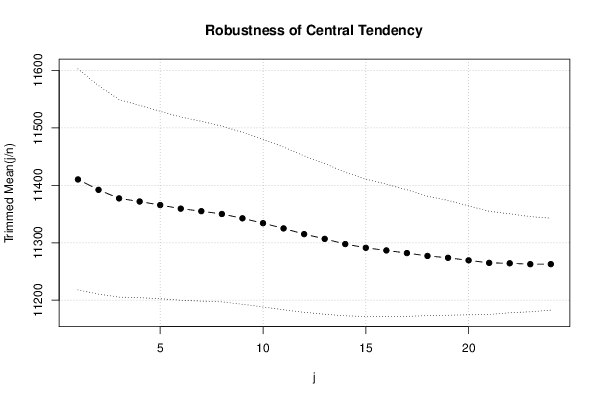
Trimmed Mean ( 1 / 24 )11410.285714285796.1953415943532118.615782481462
Trimmed Mean ( 2 / 24 )11392.205882352990.7691370555068125.507482520038
Trimmed Mean ( 3 / 24 )11377.287878787985.9799802283685132.324848744662
Trimmed Mean ( 4 / 24 )11371.8437583.7555678638112135.774182422008
Trimmed Mean ( 5 / 24 )11365.693548387181.5495605400666139.371610013802
Trimmed Mean ( 6 / 24 )11359.479.7547341987837142.429162533316
Trimmed Mean ( 7 / 24 )1135578.2947221776228145.028932783484
Trimmed Mean ( 8 / 24 )11350.12576.5168730331176148.334929932219
Trimmed Mean ( 9 / 24 )11342.574074074174.820893064905151.596347082288
Trimmed Mean ( 10 / 24 )11334.153846153872.9658972420913155.334947894201
Trimmed Mean ( 11 / 24 )11325.0270.827006782695159.896916648566
Trimmed Mean ( 12 / 24 )11315.083333333368.1120454748695166.124556301985
Trimmed Mean ( 13 / 24 )11306.804347826165.593224726451172.377625813944
Trimmed Mean ( 14 / 24 )11297.772727272762.4705500479566180.849579819608
Trimmed Mean ( 15 / 24 )11291.238095238159.8767395298806188.574698353496
Trimmed Mean ( 16 / 24 )11286.67557.6574809732396195.753869393608
Trimmed Mean ( 17 / 24 )11282.078947368455.1229504004638204.671173538518
Trimmed Mean ( 18 / 24 )11277.083333333351.9638057033413217.018041321177
Trimmed Mean ( 19 / 24 )11273.852941176549.9914454777013225.515642395361
Trimmed Mean ( 20 / 24 )11269.4062547.4061224135481237.72048158023
Trimmed Mean ( 21 / 24 )1126544.9310838824368250.717299174779
Trimmed Mean ( 22 / 24 )11264.285714285743.084507126648261.446317145373
Trimmed Mean ( 23 / 24 )11262.730769230841.4346401973521271.819200446455
Trimmed Mean ( 24 / 24 )11262.791666666740.0348118067385281.324955916765
Median11288.5
Midrange12254
Midmean - Weighted Average at Xnp11262
Midmean - Weighted Average at X(n+1)p11277.0833333333
Midmean - Empirical Distribution Function11262
Midmean - Empirical Distribution Function - Averaging11277.0833333333
Midmean - Empirical Distribution Function - Interpolation11277.0833333333
Midmean - Closest Observation11262
Midmean - True Basic - Statistics Graphics Toolkit11277.0833333333
Midmean - MS Excel (old versions)11282.0789473684
Number of observations72

\begin{tabular}{lllllllll}
\hline
Central Tendency - Ungrouped Data \tabularnewline
Measure & Value & S.E. & Value/S.E. \tabularnewline
Arithmetic Mean & 11433.7222222222 & 103.765334334898 & 110.188265623666 \tabularnewline
Geometric Mean & 11401.6908157699 &  &  \tabularnewline
Harmonic Mean & 11370.9731460518 &  &  \tabularnewline
Quadratic Mean & 11467.1041776999 &  &  \tabularnewline
Winsorized Mean ( 1 / 24 ) & 11427.3611111111 & 100.67161265085 & 113.511255161309 \tabularnewline
Winsorized Mean ( 2 / 24 ) & 11419.5555555556 & 98.0041196494637 & 116.521178868811 \tabularnewline
Winsorized Mean ( 3 / 24 ) & 11391.8055555556 & 90.6225547700743 & 125.706073774444 \tabularnewline
Winsorized Mean ( 4 / 24 ) & 11393.0277777778 & 89.309652308091 & 127.567709461854 \tabularnewline
Winsorized Mean ( 5 / 24 ) & 11391.9166666667 & 86.5137707610696 & 131.677495576148 \tabularnewline
Winsorized Mean ( 6 / 24 ) & 11380.6666666667 & 83.9016069912374 & 135.643011794223 \tabularnewline
Winsorized Mean ( 7 / 24 ) & 11381.5416666667 & 83.7287658772577 & 135.933469786853 \tabularnewline
Winsorized Mean ( 8 / 24 ) & 11395.4305555556 & 81.4912743065297 & 139.836205195315 \tabularnewline
Winsorized Mean ( 9 / 24 ) & 11397.3055555556 & 80.2198798502963 & 142.075824307202 \tabularnewline
Winsorized Mean ( 10 / 24 ) & 11397.5833333333 & 79.2146426164464 & 143.88227929677 \tabularnewline
Winsorized Mean ( 11 / 24 ) & 11397.8888888889 & 79.0222640413676 & 144.236425356304 \tabularnewline
Winsorized Mean ( 12 / 24 ) & 11378.5555555556 & 75.1350632814472 & 151.441351861684 \tabularnewline
Winsorized Mean ( 13 / 24 ) & 11378.5555555556 & 74.3788569018467 & 152.981049044235 \tabularnewline
Winsorized Mean ( 14 / 24 ) & 11351.1388888889 & 68.6503390769607 & 165.347164216679 \tabularnewline
Winsorized Mean ( 15 / 24 ) & 11329.2638888889 & 63.8992445637038 & 177.298870530375 \tabularnewline
Winsorized Mean ( 16 / 24 ) & 11325.4861111111 & 62.0565772229327 & 182.502590666986 \tabularnewline
Winsorized Mean ( 17 / 24 ) & 11324.5416666667 & 60.8288921701898 & 186.170440766574 \tabularnewline
Winsorized Mean ( 18 / 24 ) & 11304.5416666667 & 52.5378615153456 & 215.169429067164 \tabularnewline
Winsorized Mean ( 19 / 24 ) & 11311.4027777778 & 51.5969378774204 & 219.226241771371 \tabularnewline
Winsorized Mean ( 20 / 24 ) & 11306.125 & 47.5961917766051 & 237.542638979728 \tabularnewline
Winsorized Mean ( 21 / 24 ) & 11270.8333333333 & 42.3463530309692 & 266.158299986084 \tabularnewline
Winsorized Mean ( 22 / 24 ) & 11276.6388888889 & 38.8455133408207 & 290.294500421465 \tabularnewline
Winsorized Mean ( 23 / 24 ) & 11262.2638888889 & 35.4756081924723 & 317.464998141418 \tabularnewline
Winsorized Mean ( 24 / 24 ) & 11252.2638888889 & 31.8323316280193 & 353.485381478763 \tabularnewline
Trimmed Mean ( 1 / 24 ) & 11410.2857142857 & 96.1953415943532 & 118.615782481462 \tabularnewline
Trimmed Mean ( 2 / 24 ) & 11392.2058823529 & 90.7691370555068 & 125.507482520038 \tabularnewline
Trimmed Mean ( 3 / 24 ) & 11377.2878787879 & 85.9799802283685 & 132.324848744662 \tabularnewline
Trimmed Mean ( 4 / 24 ) & 11371.84375 & 83.7555678638112 & 135.774182422008 \tabularnewline
Trimmed Mean ( 5 / 24 ) & 11365.6935483871 & 81.5495605400666 & 139.371610013802 \tabularnewline
Trimmed Mean ( 6 / 24 ) & 11359.4 & 79.7547341987837 & 142.429162533316 \tabularnewline
Trimmed Mean ( 7 / 24 ) & 11355 & 78.2947221776228 & 145.028932783484 \tabularnewline
Trimmed Mean ( 8 / 24 ) & 11350.125 & 76.5168730331176 & 148.334929932219 \tabularnewline
Trimmed Mean ( 9 / 24 ) & 11342.5740740741 & 74.820893064905 & 151.596347082288 \tabularnewline
Trimmed Mean ( 10 / 24 ) & 11334.1538461538 & 72.9658972420913 & 155.334947894201 \tabularnewline
Trimmed Mean ( 11 / 24 ) & 11325.02 & 70.827006782695 & 159.896916648566 \tabularnewline
Trimmed Mean ( 12 / 24 ) & 11315.0833333333 & 68.1120454748695 & 166.124556301985 \tabularnewline
Trimmed Mean ( 13 / 24 ) & 11306.8043478261 & 65.593224726451 & 172.377625813944 \tabularnewline
Trimmed Mean ( 14 / 24 ) & 11297.7727272727 & 62.4705500479566 & 180.849579819608 \tabularnewline
Trimmed Mean ( 15 / 24 ) & 11291.2380952381 & 59.8767395298806 & 188.574698353496 \tabularnewline
Trimmed Mean ( 16 / 24 ) & 11286.675 & 57.6574809732396 & 195.753869393608 \tabularnewline
Trimmed Mean ( 17 / 24 ) & 11282.0789473684 & 55.1229504004638 & 204.671173538518 \tabularnewline
Trimmed Mean ( 18 / 24 ) & 11277.0833333333 & 51.9638057033413 & 217.018041321177 \tabularnewline
Trimmed Mean ( 19 / 24 ) & 11273.8529411765 & 49.9914454777013 & 225.515642395361 \tabularnewline
Trimmed Mean ( 20 / 24 ) & 11269.40625 & 47.4061224135481 & 237.72048158023 \tabularnewline
Trimmed Mean ( 21 / 24 ) & 11265 & 44.9310838824368 & 250.717299174779 \tabularnewline
Trimmed Mean ( 22 / 24 ) & 11264.2857142857 & 43.084507126648 & 261.446317145373 \tabularnewline
Trimmed Mean ( 23 / 24 ) & 11262.7307692308 & 41.4346401973521 & 271.819200446455 \tabularnewline
Trimmed Mean ( 24 / 24 ) & 11262.7916666667 & 40.0348118067385 & 281.324955916765 \tabularnewline
Median & 11288.5 &  &  \tabularnewline
Midrange & 12254 &  &  \tabularnewline
Midmean - Weighted Average at Xnp & 11262 &  &  \tabularnewline
Midmean - Weighted Average at X(n+1)p & 11277.0833333333 &  &  \tabularnewline
Midmean - Empirical Distribution Function & 11262 &  &  \tabularnewline
Midmean - Empirical Distribution Function - Averaging & 11277.0833333333 &  &  \tabularnewline
Midmean - Empirical Distribution Function - Interpolation & 11277.0833333333 &  &  \tabularnewline
Midmean - Closest Observation & 11262 &  &  \tabularnewline
Midmean - True Basic - Statistics Graphics Toolkit & 11277.0833333333 &  &  \tabularnewline
Midmean - MS Excel (old versions) & 11282.0789473684 &  &  \tabularnewline
Number of observations & 72 &  &  \tabularnewline
\hline
\end{tabular}
%Source: https://freestatistics.org/blog/index.php?pk=240291&T=1

[TABLE]
[ROW][C]Central Tendency - Ungrouped Data[/C][/ROW]
[ROW][C]Measure[/C][C]Value[/C][C]S.E.[/C][C]Value/S.E.[/C][/ROW]
[ROW][C]Arithmetic Mean[/C][C]11433.7222222222[/C][C]103.765334334898[/C][C]110.188265623666[/C][/ROW]
[ROW][C]Geometric Mean[/C][C]11401.6908157699[/C][C][/C][C][/C][/ROW]
[ROW][C]Harmonic Mean[/C][C]11370.9731460518[/C][C][/C][C][/C][/ROW]
[ROW][C]Quadratic Mean[/C][C]11467.1041776999[/C][C][/C][C][/C][/ROW]
[ROW][C]Winsorized Mean ( 1 / 24 )[/C][C]11427.3611111111[/C][C]100.67161265085[/C][C]113.511255161309[/C][/ROW]
[ROW][C]Winsorized Mean ( 2 / 24 )[/C][C]11419.5555555556[/C][C]98.0041196494637[/C][C]116.521178868811[/C][/ROW]
[ROW][C]Winsorized Mean ( 3 / 24 )[/C][C]11391.8055555556[/C][C]90.6225547700743[/C][C]125.706073774444[/C][/ROW]
[ROW][C]Winsorized Mean ( 4 / 24 )[/C][C]11393.0277777778[/C][C]89.309652308091[/C][C]127.567709461854[/C][/ROW]
[ROW][C]Winsorized Mean ( 5 / 24 )[/C][C]11391.9166666667[/C][C]86.5137707610696[/C][C]131.677495576148[/C][/ROW]
[ROW][C]Winsorized Mean ( 6 / 24 )[/C][C]11380.6666666667[/C][C]83.9016069912374[/C][C]135.643011794223[/C][/ROW]
[ROW][C]Winsorized Mean ( 7 / 24 )[/C][C]11381.5416666667[/C][C]83.7287658772577[/C][C]135.933469786853[/C][/ROW]
[ROW][C]Winsorized Mean ( 8 / 24 )[/C][C]11395.4305555556[/C][C]81.4912743065297[/C][C]139.836205195315[/C][/ROW]
[ROW][C]Winsorized Mean ( 9 / 24 )[/C][C]11397.3055555556[/C][C]80.2198798502963[/C][C]142.075824307202[/C][/ROW]
[ROW][C]Winsorized Mean ( 10 / 24 )[/C][C]11397.5833333333[/C][C]79.2146426164464[/C][C]143.88227929677[/C][/ROW]
[ROW][C]Winsorized Mean ( 11 / 24 )[/C][C]11397.8888888889[/C][C]79.0222640413676[/C][C]144.236425356304[/C][/ROW]
[ROW][C]Winsorized Mean ( 12 / 24 )[/C][C]11378.5555555556[/C][C]75.1350632814472[/C][C]151.441351861684[/C][/ROW]
[ROW][C]Winsorized Mean ( 13 / 24 )[/C][C]11378.5555555556[/C][C]74.3788569018467[/C][C]152.981049044235[/C][/ROW]
[ROW][C]Winsorized Mean ( 14 / 24 )[/C][C]11351.1388888889[/C][C]68.6503390769607[/C][C]165.347164216679[/C][/ROW]
[ROW][C]Winsorized Mean ( 15 / 24 )[/C][C]11329.2638888889[/C][C]63.8992445637038[/C][C]177.298870530375[/C][/ROW]
[ROW][C]Winsorized Mean ( 16 / 24 )[/C][C]11325.4861111111[/C][C]62.0565772229327[/C][C]182.502590666986[/C][/ROW]
[ROW][C]Winsorized Mean ( 17 / 24 )[/C][C]11324.5416666667[/C][C]60.8288921701898[/C][C]186.170440766574[/C][/ROW]
[ROW][C]Winsorized Mean ( 18 / 24 )[/C][C]11304.5416666667[/C][C]52.5378615153456[/C][C]215.169429067164[/C][/ROW]
[ROW][C]Winsorized Mean ( 19 / 24 )[/C][C]11311.4027777778[/C][C]51.5969378774204[/C][C]219.226241771371[/C][/ROW]
[ROW][C]Winsorized Mean ( 20 / 24 )[/C][C]11306.125[/C][C]47.5961917766051[/C][C]237.542638979728[/C][/ROW]
[ROW][C]Winsorized Mean ( 21 / 24 )[/C][C]11270.8333333333[/C][C]42.3463530309692[/C][C]266.158299986084[/C][/ROW]
[ROW][C]Winsorized Mean ( 22 / 24 )[/C][C]11276.6388888889[/C][C]38.8455133408207[/C][C]290.294500421465[/C][/ROW]
[ROW][C]Winsorized Mean ( 23 / 24 )[/C][C]11262.2638888889[/C][C]35.4756081924723[/C][C]317.464998141418[/C][/ROW]
[ROW][C]Winsorized Mean ( 24 / 24 )[/C][C]11252.2638888889[/C][C]31.8323316280193[/C][C]353.485381478763[/C][/ROW]
[ROW][C]Trimmed Mean ( 1 / 24 )[/C][C]11410.2857142857[/C][C]96.1953415943532[/C][C]118.615782481462[/C][/ROW]
[ROW][C]Trimmed Mean ( 2 / 24 )[/C][C]11392.2058823529[/C][C]90.7691370555068[/C][C]125.507482520038[/C][/ROW]
[ROW][C]Trimmed Mean ( 3 / 24 )[/C][C]11377.2878787879[/C][C]85.9799802283685[/C][C]132.324848744662[/C][/ROW]
[ROW][C]Trimmed Mean ( 4 / 24 )[/C][C]11371.84375[/C][C]83.7555678638112[/C][C]135.774182422008[/C][/ROW]
[ROW][C]Trimmed Mean ( 5 / 24 )[/C][C]11365.6935483871[/C][C]81.5495605400666[/C][C]139.371610013802[/C][/ROW]
[ROW][C]Trimmed Mean ( 6 / 24 )[/C][C]11359.4[/C][C]79.7547341987837[/C][C]142.429162533316[/C][/ROW]
[ROW][C]Trimmed Mean ( 7 / 24 )[/C][C]11355[/C][C]78.2947221776228[/C][C]145.028932783484[/C][/ROW]
[ROW][C]Trimmed Mean ( 8 / 24 )[/C][C]11350.125[/C][C]76.5168730331176[/C][C]148.334929932219[/C][/ROW]
[ROW][C]Trimmed Mean ( 9 / 24 )[/C][C]11342.5740740741[/C][C]74.820893064905[/C][C]151.596347082288[/C][/ROW]
[ROW][C]Trimmed Mean ( 10 / 24 )[/C][C]11334.1538461538[/C][C]72.9658972420913[/C][C]155.334947894201[/C][/ROW]
[ROW][C]Trimmed Mean ( 11 / 24 )[/C][C]11325.02[/C][C]70.827006782695[/C][C]159.896916648566[/C][/ROW]
[ROW][C]Trimmed Mean ( 12 / 24 )[/C][C]11315.0833333333[/C][C]68.1120454748695[/C][C]166.124556301985[/C][/ROW]
[ROW][C]Trimmed Mean ( 13 / 24 )[/C][C]11306.8043478261[/C][C]65.593224726451[/C][C]172.377625813944[/C][/ROW]
[ROW][C]Trimmed Mean ( 14 / 24 )[/C][C]11297.7727272727[/C][C]62.4705500479566[/C][C]180.849579819608[/C][/ROW]
[ROW][C]Trimmed Mean ( 15 / 24 )[/C][C]11291.2380952381[/C][C]59.8767395298806[/C][C]188.574698353496[/C][/ROW]
[ROW][C]Trimmed Mean ( 16 / 24 )[/C][C]11286.675[/C][C]57.6574809732396[/C][C]195.753869393608[/C][/ROW]
[ROW][C]Trimmed Mean ( 17 / 24 )[/C][C]11282.0789473684[/C][C]55.1229504004638[/C][C]204.671173538518[/C][/ROW]
[ROW][C]Trimmed Mean ( 18 / 24 )[/C][C]11277.0833333333[/C][C]51.9638057033413[/C][C]217.018041321177[/C][/ROW]
[ROW][C]Trimmed Mean ( 19 / 24 )[/C][C]11273.8529411765[/C][C]49.9914454777013[/C][C]225.515642395361[/C][/ROW]
[ROW][C]Trimmed Mean ( 20 / 24 )[/C][C]11269.40625[/C][C]47.4061224135481[/C][C]237.72048158023[/C][/ROW]
[ROW][C]Trimmed Mean ( 21 / 24 )[/C][C]11265[/C][C]44.9310838824368[/C][C]250.717299174779[/C][/ROW]
[ROW][C]Trimmed Mean ( 22 / 24 )[/C][C]11264.2857142857[/C][C]43.084507126648[/C][C]261.446317145373[/C][/ROW]
[ROW][C]Trimmed Mean ( 23 / 24 )[/C][C]11262.7307692308[/C][C]41.4346401973521[/C][C]271.819200446455[/C][/ROW]
[ROW][C]Trimmed Mean ( 24 / 24 )[/C][C]11262.7916666667[/C][C]40.0348118067385[/C][C]281.324955916765[/C][/ROW]
[ROW][C]Median[/C][C]11288.5[/C][C][/C][C][/C][/ROW]
[ROW][C]Midrange[/C][C]12254[/C][C][/C][C][/C][/ROW]
[ROW][C]Midmean - Weighted Average at Xnp[/C][C]11262[/C][C][/C][C][/C][/ROW]
[ROW][C]Midmean - Weighted Average at X(n+1)p[/C][C]11277.0833333333[/C][C][/C][C][/C][/ROW]
[ROW][C]Midmean - Empirical Distribution Function[/C][C]11262[/C][C][/C][C][/C][/ROW]
[ROW][C]Midmean - Empirical Distribution Function - Averaging[/C][C]11277.0833333333[/C][C][/C][C][/C][/ROW]
[ROW][C]Midmean - Empirical Distribution Function - Interpolation[/C][C]11277.0833333333[/C][C][/C][C][/C][/ROW]
[ROW][C]Midmean - Closest Observation[/C][C]11262[/C][C][/C][C][/C][/ROW]
[ROW][C]Midmean - True Basic - Statistics Graphics Toolkit[/C][C]11277.0833333333[/C][C][/C][C][/C][/ROW]
[ROW][C]Midmean - MS Excel (old versions)[/C][C]11282.0789473684[/C][C][/C][C][/C][/ROW]
[ROW][C]Number of observations[/C][C]72[/C][C][/C][C][/C][/ROW]
[/TABLE]
Source: https://freestatistics.org/blog/index.php?pk=240291&T=1

Globally Unique Identifier (entire table): ba.freestatistics.org/blog/index.php?pk=240291&T=1

As an alternative you can also use a QR Code:  

The GUIDs for individual cells are displayed in the table below:

Central Tendency - Ungrouped Data
MeasureValueS.E.Value/S.E.
Arithmetic Mean11433.7222222222103.765334334898110.188265623666
Geometric Mean11401.6908157699
Harmonic Mean11370.9731460518
Quadratic Mean11467.1041776999
Winsorized Mean ( 1 / 24 )11427.3611111111100.67161265085113.511255161309
Winsorized Mean ( 2 / 24 )11419.555555555698.0041196494637116.521178868811
Winsorized Mean ( 3 / 24 )11391.805555555690.6225547700743125.706073774444
Winsorized Mean ( 4 / 24 )11393.027777777889.309652308091127.567709461854
Winsorized Mean ( 5 / 24 )11391.916666666786.5137707610696131.677495576148
Winsorized Mean ( 6 / 24 )11380.666666666783.9016069912374135.643011794223
Winsorized Mean ( 7 / 24 )11381.541666666783.7287658772577135.933469786853
Winsorized Mean ( 8 / 24 )11395.430555555681.4912743065297139.836205195315
Winsorized Mean ( 9 / 24 )11397.305555555680.2198798502963142.075824307202
Winsorized Mean ( 10 / 24 )11397.583333333379.2146426164464143.88227929677
Winsorized Mean ( 11 / 24 )11397.888888888979.0222640413676144.236425356304
Winsorized Mean ( 12 / 24 )11378.555555555675.1350632814472151.441351861684
Winsorized Mean ( 13 / 24 )11378.555555555674.3788569018467152.981049044235
Winsorized Mean ( 14 / 24 )11351.138888888968.6503390769607165.347164216679
Winsorized Mean ( 15 / 24 )11329.263888888963.8992445637038177.298870530375
Winsorized Mean ( 16 / 24 )11325.486111111162.0565772229327182.502590666986
Winsorized Mean ( 17 / 24 )11324.541666666760.8288921701898186.170440766574
Winsorized Mean ( 18 / 24 )11304.541666666752.5378615153456215.169429067164
Winsorized Mean ( 19 / 24 )11311.402777777851.5969378774204219.226241771371
Winsorized Mean ( 20 / 24 )11306.12547.5961917766051237.542638979728
Winsorized Mean ( 21 / 24 )11270.833333333342.3463530309692266.158299986084
Winsorized Mean ( 22 / 24 )11276.638888888938.8455133408207290.294500421465
Winsorized Mean ( 23 / 24 )11262.263888888935.4756081924723317.464998141418
Winsorized Mean ( 24 / 24 )11252.263888888931.8323316280193353.485381478763
Trimmed Mean ( 1 / 24 )11410.285714285796.1953415943532118.615782481462
Trimmed Mean ( 2 / 24 )11392.205882352990.7691370555068125.507482520038
Trimmed Mean ( 3 / 24 )11377.287878787985.9799802283685132.324848744662
Trimmed Mean ( 4 / 24 )11371.8437583.7555678638112135.774182422008
Trimmed Mean ( 5 / 24 )11365.693548387181.5495605400666139.371610013802
Trimmed Mean ( 6 / 24 )11359.479.7547341987837142.429162533316
Trimmed Mean ( 7 / 24 )1135578.2947221776228145.028932783484
Trimmed Mean ( 8 / 24 )11350.12576.5168730331176148.334929932219
Trimmed Mean ( 9 / 24 )11342.574074074174.820893064905151.596347082288
Trimmed Mean ( 10 / 24 )11334.153846153872.9658972420913155.334947894201
Trimmed Mean ( 11 / 24 )11325.0270.827006782695159.896916648566
Trimmed Mean ( 12 / 24 )11315.083333333368.1120454748695166.124556301985
Trimmed Mean ( 13 / 24 )11306.804347826165.593224726451172.377625813944
Trimmed Mean ( 14 / 24 )11297.772727272762.4705500479566180.849579819608
Trimmed Mean ( 15 / 24 )11291.238095238159.8767395298806188.574698353496
Trimmed Mean ( 16 / 24 )11286.67557.6574809732396195.753869393608
Trimmed Mean ( 17 / 24 )11282.078947368455.1229504004638204.671173538518
Trimmed Mean ( 18 / 24 )11277.083333333351.9638057033413217.018041321177
Trimmed Mean ( 19 / 24 )11273.852941176549.9914454777013225.515642395361
Trimmed Mean ( 20 / 24 )11269.4062547.4061224135481237.72048158023
Trimmed Mean ( 21 / 24 )1126544.9310838824368250.717299174779
Trimmed Mean ( 22 / 24 )11264.285714285743.084507126648261.446317145373
Trimmed Mean ( 23 / 24 )11262.730769230841.4346401973521271.819200446455
Trimmed Mean ( 24 / 24 )11262.791666666740.0348118067385281.324955916765
Median11288.5
Midrange12254
Midmean - Weighted Average at Xnp11262
Midmean - Weighted Average at X(n+1)p11277.0833333333
Midmean - Empirical Distribution Function11262
Midmean - Empirical Distribution Function - Averaging11277.0833333333
Midmean - Empirical Distribution Function - Interpolation11277.0833333333
Midmean - Closest Observation11262
Midmean - True Basic - Statistics Graphics Toolkit11277.0833333333
Midmean - MS Excel (old versions)11282.0789473684
Number of observations72


Parameters (Session):
Parameters (R input):
R code (references can be found in the software module):
geomean <- function(x) {
return(exp(mean(log(x))))
}
harmean <- function(x) {
return(1/mean(1/x))
}
quamean <- function(x) {
return(sqrt(mean(x*x)))
}
winmean <- function(x) {
x <-sort(x[!is.na(x)])
n<-length(x)
denom <- 3
nodenom <- n/denom
if (nodenom>40) denom <- n/40
sqrtn = sqrt(n)
roundnodenom = floor(nodenom)
win <- array(NA,dim=c(roundnodenom,2))
for (j in 1:roundnodenom) {
win[j,1] <- (j*x[j+1]+sum(x[(j+1):(n-j)])+j*x[n-j])/n
win[j,2] <- sd(c(rep(x[j+1],j),x[(j+1):(n-j)],rep(x[n-j],j)))/sqrtn
}
return(win)
}
trimean <- function(x) {
x <-sort(x[!is.na(x)])
n<-length(x)
denom <- 3
nodenom <- n/denom
if (nodenom>40) denom <- n/40
sqrtn = sqrt(n)
roundnodenom = floor(nodenom)
tri <- array(NA,dim=c(roundnodenom,2))
for (j in 1:roundnodenom) {
tri[j,1] <- mean(x,trim=j/n)
tri[j,2] <- sd(x[(j+1):(n-j)]) / sqrt(n-j*2)
}
return(tri)
}
midrange <- function(x) {
return((max(x)+min(x))/2)
}
q1 <- function(data,n,p,i,f) {
np <- n*p;
i <<- floor(np)
f <<- np - i
qvalue <- (1-f)*data[i] + f*data[i+1]
}
q2 <- function(data,n,p,i,f) {
np <- (n+1)*p
i <<- floor(np)
f <<- np - i
qvalue <- (1-f)*data[i] + f*data[i+1]
}
q3 <- function(data,n,p,i,f) {
np <- n*p
i <<- floor(np)
f <<- np - i
if (f==0) {
qvalue <- data[i]
} else {
qvalue <- data[i+1]
}
}
q4 <- function(data,n,p,i,f) {
np <- n*p
i <<- floor(np)
f <<- np - i
if (f==0) {
qvalue <- (data[i]+data[i+1])/2
} else {
qvalue <- data[i+1]
}
}
q5 <- function(data,n,p,i,f) {
np <- (n-1)*p
i <<- floor(np)
f <<- np - i
if (f==0) {
qvalue <- data[i+1]
} else {
qvalue <- data[i+1] + f*(data[i+2]-data[i+1])
}
}
q6 <- function(data,n,p,i,f) {
np <- n*p+0.5
i <<- floor(np)
f <<- np - i
qvalue <- data[i]
}
q7 <- function(data,n,p,i,f) {
np <- (n+1)*p
i <<- floor(np)
f <<- np - i
if (f==0) {
qvalue <- data[i]
} else {
qvalue <- f*data[i] + (1-f)*data[i+1]
}
}
q8 <- function(data,n,p,i,f) {
np <- (n+1)*p
i <<- floor(np)
f <<- np - i
if (f==0) {
qvalue <- data[i]
} else {
if (f == 0.5) {
qvalue <- (data[i]+data[i+1])/2
} else {
if (f < 0.5) {
qvalue <- data[i]
} else {
qvalue <- data[i+1]
}
}
}
}
midmean <- function(x,def) {
x <-sort(x[!is.na(x)])
n<-length(x)
if (def==1) {
qvalue1 <- q1(x,n,0.25,i,f)
qvalue3 <- q1(x,n,0.75,i,f)
}
if (def==2) {
qvalue1 <- q2(x,n,0.25,i,f)
qvalue3 <- q2(x,n,0.75,i,f)
}
if (def==3) {
qvalue1 <- q3(x,n,0.25,i,f)
qvalue3 <- q3(x,n,0.75,i,f)
}
if (def==4) {
qvalue1 <- q4(x,n,0.25,i,f)
qvalue3 <- q4(x,n,0.75,i,f)
}
if (def==5) {
qvalue1 <- q5(x,n,0.25,i,f)
qvalue3 <- q5(x,n,0.75,i,f)
}
if (def==6) {
qvalue1 <- q6(x,n,0.25,i,f)
qvalue3 <- q6(x,n,0.75,i,f)
}
if (def==7) {
qvalue1 <- q7(x,n,0.25,i,f)
qvalue3 <- q7(x,n,0.75,i,f)
}
if (def==8) {
qvalue1 <- q8(x,n,0.25,i,f)
qvalue3 <- q8(x,n,0.75,i,f)
}
midm <- 0
myn <- 0
roundno4 <- round(n/4)
round3no4 <- round(3*n/4)
for (i in 1:n) {
if ((x[i]>=qvalue1) & (x[i]<=qvalue3)){
midm = midm + x[i]
myn = myn + 1
}
}
midm = midm / myn
return(midm)
}
(arm <- mean(x))
sqrtn <- sqrt(length(x))
(armse <- sd(x) / sqrtn)
(armose <- arm / armse)
(geo <- geomean(x))
(har <- harmean(x))
(qua <- quamean(x))
(win <- winmean(x))
(tri <- trimean(x))
(midr <- midrange(x))
midm <- array(NA,dim=8)
for (j in 1:8) midm[j] <- midmean(x,j)
midm
bitmap(file='test1.png')
lb <- win[,1] - 2*win[,2]
ub <- win[,1] + 2*win[,2]
if ((ylimmin == '') | (ylimmax == '')) plot(win[,1],type='b',main=main, xlab='j', pch=19, ylab='Winsorized Mean(j/n)', ylim=c(min(lb),max(ub))) else plot(win[,1],type='l',main=main, xlab='j', pch=19, ylab='Winsorized Mean(j/n)', ylim=c(ylimmin,ylimmax))
lines(ub,lty=3)
lines(lb,lty=3)
grid()
dev.off()
bitmap(file='test2.png')
lb <- tri[,1] - 2*tri[,2]
ub <- tri[,1] + 2*tri[,2]
if ((ylimmin == '') | (ylimmax == '')) plot(tri[,1],type='b',main=main, xlab='j', pch=19, ylab='Trimmed Mean(j/n)', ylim=c(min(lb),max(ub))) else plot(tri[,1],type='l',main=main, xlab='j', pch=19, ylab='Trimmed Mean(j/n)', ylim=c(ylimmin,ylimmax))
lines(ub,lty=3)
lines(lb,lty=3)
grid()
dev.off()
load(file='createtable')
a<-table.start()
a<-table.row.start(a)
a<-table.element(a,'Central Tendency - Ungrouped Data',4,TRUE)
a<-table.row.end(a)
a<-table.row.start(a)
a<-table.element(a,'Measure',header=TRUE)
a<-table.element(a,'Value',header=TRUE)
a<-table.element(a,'S.E.',header=TRUE)
a<-table.element(a,'Value/S.E.',header=TRUE)
a<-table.row.end(a)
a<-table.row.start(a)
a<-table.element(a,hyperlink('arithmetic_mean.htm', 'Arithmetic Mean', 'click to view the definition of the Arithmetic Mean'),header=TRUE)
a<-table.element(a,arm)
a<-table.element(a,hyperlink('arithmetic_mean_standard_error.htm', armse, 'click to view the definition of the Standard Error of the Arithmetic Mean'))
a<-table.element(a,armose)
a<-table.row.end(a)
a<-table.row.start(a)
a<-table.element(a,hyperlink('geometric_mean.htm', 'Geometric Mean', 'click to view the definition of the Geometric Mean'),header=TRUE)
a<-table.element(a,geo)
a<-table.element(a,'')
a<-table.row.end(a)
a<-table.row.start(a)
a<-table.element(a,hyperlink('harmonic_mean.htm', 'Harmonic Mean', 'click to view the definition of the Harmonic Mean'),header=TRUE)
a<-table.element(a,har)
a<-table.element(a,'')
a<-table.row.end(a)
a<-table.row.start(a)
a<-table.element(a,hyperlink('quadratic_mean.htm', 'Quadratic Mean', 'click to view the definition of the Quadratic Mean'),header=TRUE)
a<-table.element(a,qua)
a<-table.element(a,'')
a<-table.row.end(a)
for (j in 1:length(win[,1])) {
a<-table.row.start(a)
mylabel <- paste('Winsorized Mean (',j)
mylabel <- paste(mylabel,'/')
mylabel <- paste(mylabel,length(win[,1]))
mylabel <- paste(mylabel,')')
a<-table.element(a,hyperlink('winsorized_mean.htm', mylabel, 'click to view the definition of the Winsorized Mean'),header=TRUE)
a<-table.element(a,win[j,1])
a<-table.element(a,win[j,2])
a<-table.element(a,win[j,1]/win[j,2])
a<-table.row.end(a)
}
for (j in 1:length(tri[,1])) {
a<-table.row.start(a)
mylabel <- paste('Trimmed Mean (',j)
mylabel <- paste(mylabel,'/')
mylabel <- paste(mylabel,length(tri[,1]))
mylabel <- paste(mylabel,')')
a<-table.element(a,hyperlink('arithmetic_mean.htm', mylabel, 'click to view the definition of the Trimmed Mean'),header=TRUE)
a<-table.element(a,tri[j,1])
a<-table.element(a,tri[j,2])
a<-table.element(a,tri[j,1]/tri[j,2])
a<-table.row.end(a)
}
a<-table.row.start(a)
a<-table.element(a,hyperlink('median_1.htm', 'Median', 'click to view the definition of the Median'),header=TRUE)
a<-table.element(a,median(x))
a<-table.element(a,'')
a<-table.row.end(a)
a<-table.row.start(a)
a<-table.element(a,hyperlink('midrange.htm', 'Midrange', 'click to view the definition of the Midrange'),header=TRUE)
a<-table.element(a,midr)
a<-table.element(a,'')
a<-table.row.end(a)
a<-table.row.start(a)
mymid <- hyperlink('midmean.htm', 'Midmean', 'click to view the definition of the Midmean')
mylabel <- paste(mymid,hyperlink('method_1.htm','Weighted Average at Xnp',''),sep=' - ')
a<-table.element(a,mylabel,header=TRUE)
a<-table.element(a,midm[1])
a<-table.element(a,'')
a<-table.row.end(a)
a<-table.row.start(a)
mymid <- hyperlink('midmean.htm', 'Midmean', 'click to view the definition of the Midmean')
mylabel <- paste(mymid,hyperlink('method_2.htm','Weighted Average at X(n+1)p',''),sep=' - ')
a<-table.element(a,mylabel,header=TRUE)
a<-table.element(a,midm[2])
a<-table.element(a,'')
a<-table.row.end(a)
a<-table.row.start(a)
mymid <- hyperlink('midmean.htm', 'Midmean', 'click to view the definition of the Midmean')
mylabel <- paste(mymid,hyperlink('method_3.htm','Empirical Distribution Function',''),sep=' - ')
a<-table.element(a,mylabel,header=TRUE)
a<-table.element(a,midm[3])
a<-table.element(a,'')
a<-table.row.end(a)
a<-table.row.start(a)
mymid <- hyperlink('midmean.htm', 'Midmean', 'click to view the definition of the Midmean')
mylabel <- paste(mymid,hyperlink('method_4.htm','Empirical Distribution Function - Averaging',''),sep=' - ')
a<-table.element(a,mylabel,header=TRUE)
a<-table.element(a,midm[4])
a<-table.element(a,'')
a<-table.row.end(a)
a<-table.row.start(a)
mymid <- hyperlink('midmean.htm', 'Midmean', 'click to view the definition of the Midmean')
mylabel <- paste(mymid,hyperlink('method_5.htm','Empirical Distribution Function - Interpolation',''),sep=' - ')
a<-table.element(a,mylabel,header=TRUE)
a<-table.element(a,midm[5])
a<-table.element(a,'')
a<-table.row.end(a)
a<-table.row.start(a)
mymid <- hyperlink('midmean.htm', 'Midmean', 'click to view the definition of the Midmean')
mylabel <- paste(mymid,hyperlink('method_6.htm','Closest Observation',''),sep=' - ')
a<-table.element(a,mylabel,header=TRUE)
a<-table.element(a,midm[6])
a<-table.element(a,'')
a<-table.row.end(a)
a<-table.row.start(a)
mymid <- hyperlink('midmean.htm', 'Midmean', 'click to view the definition of the Midmean')
mylabel <- paste(mymid,hyperlink('method_7.htm','True Basic - Statistics Graphics Toolkit',''),sep=' - ')
a<-table.element(a,mylabel,header=TRUE)
a<-table.element(a,midm[7])
a<-table.element(a,'')
a<-table.row.end(a)
a<-table.row.start(a)
mymid <- hyperlink('midmean.htm', 'Midmean', 'click to view the definition of the Midmean')
mylabel <- paste(mymid,hyperlink('method_8.htm','MS Excel (old versions)',''),sep=' - ')
a<-table.element(a,mylabel,header=TRUE)
a<-table.element(a,midm[8])
a<-table.element(a,'')
a<-table.row.end(a)
a<-table.row.start(a)
a<-table.element(a,'Number of observations',header=TRUE)
a<-table.element(a,length(x))
a<-table.element(a,'')
a<-table.row.end(a)
a<-table.end(a)
table.save(a,file='mytable.tab')