Free Statistics

of Irreproducible Research!

Author's title

Author*Unverified author*
R Software Modulerwasp_centraltendency.wasp
Title produced by softwareCentral Tendency
Date of computationThu, 09 Oct 2014 17:06:50 +0100
Cite this page as followsStatistical Computations at FreeStatistics.org, Office for Research Development and Education, URL https://freestatistics.org/blog/index.php?v=date/2014/Oct/09/t1412871046w5gois3o8e72wpx.htm/, Retrieved Sun, 12 May 2024 07:01:20 +0000
Statistical Computations at FreeStatistics.org, Office for Research Development and Education, URL https://freestatistics.org/blog/index.php?pk=240057, Retrieved Sun, 12 May 2024 07:01:20 +0000
QR Codes:

Original text written by user:
IsPrivate?No (this computation is public)
User-defined keywords
Estimated Impact62
Family? (F = Feedback message, R = changed R code, M = changed R Module, P = changed Parameters, D = changed Data)
-       [Central Tendency] [] [2014-10-09 16:06:50] [d67845bcf6d8dd3cd224f69460cf281c] [Current]
Feedback Forum

Post a new message
Dataseries X:
11201
7804
8918
7874
8374
9099
7860
8000
7930
9079
8620
2513
13991
10095
11445
8792
8716
9607
7843
7221
8242
8839
6874
2478
11351
6480
6809
5464
4791
5179
4605
3809
5366
4402
4225
1719
7064
4820
6150
4971
4295
5713
4588
4253
5275
5114
5450
2088
9228
6060
7322
6147
6102
5988
5095
4971
5883
6211
6352
2581
9787
6187
7456
5127
5615
6243
5161
5439
4939
5349
4959
3080
7695
4965
6179
5166
5012
5094
4855
4272
4658
5146
5346
6009


Summary of computational transaction
Raw Inputview raw input (R code)
Raw Outputview raw output of R engine
Computing time2 seconds
R Server'Gertrude Mary Cox' @ cox.wessa.net

\begin{tabular}{lllllllll}
\hline
Summary of computational transaction \tabularnewline
Raw Input & view raw input (R code)  \tabularnewline
Raw Output & view raw output of R engine  \tabularnewline
Computing time & 2 seconds \tabularnewline
R Server & 'Gertrude Mary Cox' @ cox.wessa.net \tabularnewline
\hline
\end{tabular}
%Source: https://freestatistics.org/blog/index.php?pk=240057&T=0

[TABLE]
[ROW][C]Summary of computational transaction[/C][/ROW]
[ROW][C]Raw Input[/C][C]view raw input (R code) [/C][/ROW]
[ROW][C]Raw Output[/C][C]view raw output of R engine [/C][/ROW]
[ROW][C]Computing time[/C][C]2 seconds[/C][/ROW]
[ROW][C]R Server[/C][C]'Gertrude Mary Cox' @ cox.wessa.net[/C][/ROW]
[/TABLE]
Source: https://freestatistics.org/blog/index.php?pk=240057&T=0

Globally Unique Identifier (entire table): ba.freestatistics.org/blog/index.php?pk=240057&T=0

As an alternative you can also use a QR Code:  

The GUIDs for individual cells are displayed in the table below:

Summary of computational transaction
Raw Inputview raw input (R code)
Raw Outputview raw output of R engine
Computing time2 seconds
R Server'Gertrude Mary Cox' @ cox.wessa.net


Central Tendency - Ungrouped Data
MeasureValueS.E.Value/S.E.
Arithmetic Mean6322.32142857143245.1859470697325.7858229810104
Geometric Mean5921.37338845792
Harmonic Mean5482.36747780887
Quadratic Mean6705.32538981766
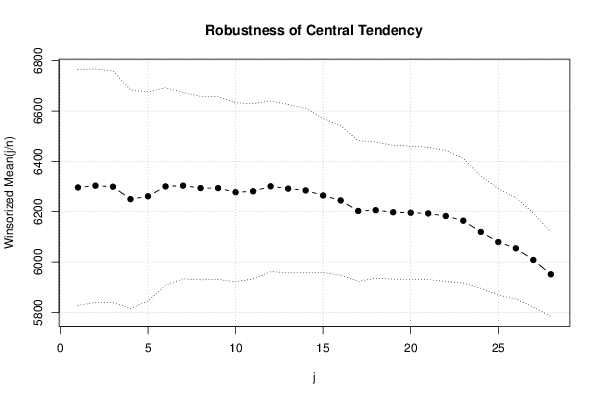
Winsorized Mean ( 1 / 28 )6296.40476190476234.45518021909526.8554729992353
Winsorized Mean ( 2 / 28 )6303.45238095238231.93856104590827.1772505293103
Winsorized Mean ( 3 / 28 )6299.34523809524230.30132516165227.3526226289564
Winsorized Mean ( 4 / 28 )6249.91666666667217.25033428664128.7682718058353
Winsorized Mean ( 5 / 28 )6261.28571428571207.64923890423230.1531840296002
Winsorized Mean ( 6 / 28 )6300.5196.21657328490332.1099277931625
Winsorized Mean ( 7 / 28 )6303.58333333333184.98960074377934.0753388730437
Winsorized Mean ( 8 / 28 )6293.96428571429182.3203777722434.5214526352995
Winsorized Mean ( 9 / 28 )6293.85714285714181.65006988580334.6482505997045
Winsorized Mean ( 10 / 28 )6277.42857142857177.79686195479935.3067455882573
Winsorized Mean ( 11 / 28 )6281.09523809524174.10308275517736.0768754848971
Winsorized Mean ( 12 / 28 )6300.95238095238169.5685658911237.1587289651209
Winsorized Mean ( 13 / 28 )6291.82142857143167.18013203245737.6349830095237
Winsorized Mean ( 14 / 28 )6284.65476190476163.33725523706638.476554248345
Winsorized Mean ( 15 / 28 )6264.47619047619153.09958311887540.91765674902
Winsorized Mean ( 16 / 28 )6244.85714285714148.33265531589142.1003529503199
Winsorized Mean ( 17 / 28 )6202.96428571429139.73937141628244.3895247477227
Winsorized Mean ( 18 / 28 )6205.96428571429135.364917059945.8461795013556
Winsorized Mean ( 19 / 28 )6197.82142857143132.92169838057746.6276123769202
Winsorized Mean ( 20 / 28 )6195.91666666667132.25551948776346.8480762894735
Winsorized Mean ( 21 / 28 )6193.16666666667131.44390856801547.1164220094844
Winsorized Mean ( 22 / 28 )6182.95238095238129.90371219478547.5964256639663
Winsorized Mean ( 23 / 28 )6164.33333333333124.18492301493949.6383392095977
Winsorized Mean ( 24 / 28 )6119.47619047619111.57180291128254.8478740219175
Winsorized Mean ( 25 / 28 )6079.89285714286105.83970578778257.4443476754707
Winsorized Mean ( 26 / 28 )6054.5119047619100.7890022567860.0711562689827
Winsorized Mean ( 27 / 28 )6008.2261904761993.357196181877864.3573975676284
Winsorized Mean ( 28 / 28 )5951.2261904761984.125773853815470.7420082793839
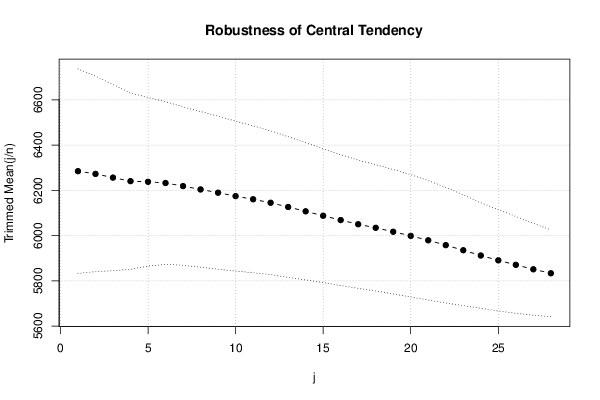
Trimmed Mean ( 1 / 28 )6284.93902439024225.92311178427527.818929080578
Trimmed Mean ( 2 / 28 )6272.9215.96262173659129.0462300816622
Trimmed Mean ( 3 / 28 )6256.44871794872205.87216955904130.3899683543893
Trimmed Mean ( 4 / 28 )6240.6447368421194.69878823900232.0528175510851
Trimmed Mean ( 5 / 28 )6238.01351351351186.46532710660833.4540131954241
Trimmed Mean ( 6 / 28 )6232.58333333333179.79588686912434.6647714909637
Trimmed Mean ( 7 / 28 )6219175.03623996249235.529785153821
Trimmed Mean ( 8 / 28 )6204.07352941176172.09571258913236.0501341728576
Trimmed Mean ( 9 / 28 )6189.77272727273169.14288768599636.5949335023988
Trimmed Mean ( 10 / 28 )6174.59375165.69189307844737.265515139456
Trimmed Mean ( 11 / 28 )6160.66129032258162.29982984141237.958519712204
Trimmed Mean ( 12 / 28 )6145.33333333333158.86431809279438.6829050545119
Trimmed Mean ( 13 / 28 )6126.55172413793155.45288747815439.4109869782824
Trimmed Mean ( 14 / 28 )6107.48214285714151.66901333031740.2684899753108
Trimmed Mean ( 15 / 28 )6087.7962962963147.67718959536441.2236738319361
Trimmed Mean ( 16 / 28 )6068.76923076923144.64921321388941.9550794361771
Trimmed Mean ( 17 / 28 )6050.28141.69440252219742.6994990084537
Trimmed Mean ( 18 / 28 )6034.5625139.57165000194143.2363055098661
Trimmed Mean ( 19 / 28 )6017.17391304348137.50816332147843.7586668871145
Trimmed Mean ( 20 / 28 )5999.02272727273135.15036058718544.387767085555
Trimmed Mean ( 21 / 28 )5979.33333333333132.01254501093245.2936751794172
Trimmed Mean ( 22 / 28 )5957.95127.85596839352546.5989196660898
Trimmed Mean ( 23 / 28 )5935.34210526316122.5039801154248.4501981051639
Trimmed Mean ( 24 / 28 )5912.11111111111116.60465547743950.7021875490639
Trimmed Mean ( 25 / 28 )5890.76470588235111.95628013204352.6166526695482
Trimmed Mean ( 26 / 28 )5870.90625107.05499942536954.8400941713402
Trimmed Mean ( 27 / 28 )5851.13333333333101.49286519664257.6506863019069
Trimmed Mean ( 28 / 28 )5833.6785714285795.934226442386160.80914797319
Median5935.5
Midrange7855
Midmean - Weighted Average at Xnp5955.74418604651
Midmean - Weighted Average at X(n+1)p5979.33333333333
Midmean - Empirical Distribution Function5955.74418604651
Midmean - Empirical Distribution Function - Averaging5979.33333333333
Midmean - Empirical Distribution Function - Interpolation5979.33333333333
Midmean - Closest Observation5955.74418604651
Midmean - True Basic - Statistics Graphics Toolkit5979.33333333333
Midmean - MS Excel (old versions)5999.02272727273
Number of observations84

\begin{tabular}{lllllllll}
\hline
Central Tendency - Ungrouped Data \tabularnewline
Measure & Value & S.E. & Value/S.E. \tabularnewline
Arithmetic Mean & 6322.32142857143 & 245.18594706973 & 25.7858229810104 \tabularnewline
Geometric Mean & 5921.37338845792 &  &  \tabularnewline
Harmonic Mean & 5482.36747780887 &  &  \tabularnewline
Quadratic Mean & 6705.32538981766 &  &  \tabularnewline
Winsorized Mean ( 1 / 28 ) & 6296.40476190476 & 234.455180219095 & 26.8554729992353 \tabularnewline
Winsorized Mean ( 2 / 28 ) & 6303.45238095238 & 231.938561045908 & 27.1772505293103 \tabularnewline
Winsorized Mean ( 3 / 28 ) & 6299.34523809524 & 230.301325161652 & 27.3526226289564 \tabularnewline
Winsorized Mean ( 4 / 28 ) & 6249.91666666667 & 217.250334286641 & 28.7682718058353 \tabularnewline
Winsorized Mean ( 5 / 28 ) & 6261.28571428571 & 207.649238904232 & 30.1531840296002 \tabularnewline
Winsorized Mean ( 6 / 28 ) & 6300.5 & 196.216573284903 & 32.1099277931625 \tabularnewline
Winsorized Mean ( 7 / 28 ) & 6303.58333333333 & 184.989600743779 & 34.0753388730437 \tabularnewline
Winsorized Mean ( 8 / 28 ) & 6293.96428571429 & 182.32037777224 & 34.5214526352995 \tabularnewline
Winsorized Mean ( 9 / 28 ) & 6293.85714285714 & 181.650069885803 & 34.6482505997045 \tabularnewline
Winsorized Mean ( 10 / 28 ) & 6277.42857142857 & 177.796861954799 & 35.3067455882573 \tabularnewline
Winsorized Mean ( 11 / 28 ) & 6281.09523809524 & 174.103082755177 & 36.0768754848971 \tabularnewline
Winsorized Mean ( 12 / 28 ) & 6300.95238095238 & 169.56856589112 & 37.1587289651209 \tabularnewline
Winsorized Mean ( 13 / 28 ) & 6291.82142857143 & 167.180132032457 & 37.6349830095237 \tabularnewline
Winsorized Mean ( 14 / 28 ) & 6284.65476190476 & 163.337255237066 & 38.476554248345 \tabularnewline
Winsorized Mean ( 15 / 28 ) & 6264.47619047619 & 153.099583118875 & 40.91765674902 \tabularnewline
Winsorized Mean ( 16 / 28 ) & 6244.85714285714 & 148.332655315891 & 42.1003529503199 \tabularnewline
Winsorized Mean ( 17 / 28 ) & 6202.96428571429 & 139.739371416282 & 44.3895247477227 \tabularnewline
Winsorized Mean ( 18 / 28 ) & 6205.96428571429 & 135.3649170599 & 45.8461795013556 \tabularnewline
Winsorized Mean ( 19 / 28 ) & 6197.82142857143 & 132.921698380577 & 46.6276123769202 \tabularnewline
Winsorized Mean ( 20 / 28 ) & 6195.91666666667 & 132.255519487763 & 46.8480762894735 \tabularnewline
Winsorized Mean ( 21 / 28 ) & 6193.16666666667 & 131.443908568015 & 47.1164220094844 \tabularnewline
Winsorized Mean ( 22 / 28 ) & 6182.95238095238 & 129.903712194785 & 47.5964256639663 \tabularnewline
Winsorized Mean ( 23 / 28 ) & 6164.33333333333 & 124.184923014939 & 49.6383392095977 \tabularnewline
Winsorized Mean ( 24 / 28 ) & 6119.47619047619 & 111.571802911282 & 54.8478740219175 \tabularnewline
Winsorized Mean ( 25 / 28 ) & 6079.89285714286 & 105.839705787782 & 57.4443476754707 \tabularnewline
Winsorized Mean ( 26 / 28 ) & 6054.5119047619 & 100.78900225678 & 60.0711562689827 \tabularnewline
Winsorized Mean ( 27 / 28 ) & 6008.22619047619 & 93.3571961818778 & 64.3573975676284 \tabularnewline
Winsorized Mean ( 28 / 28 ) & 5951.22619047619 & 84.1257738538154 & 70.7420082793839 \tabularnewline
Trimmed Mean ( 1 / 28 ) & 6284.93902439024 & 225.923111784275 & 27.818929080578 \tabularnewline
Trimmed Mean ( 2 / 28 ) & 6272.9 & 215.962621736591 & 29.0462300816622 \tabularnewline
Trimmed Mean ( 3 / 28 ) & 6256.44871794872 & 205.872169559041 & 30.3899683543893 \tabularnewline
Trimmed Mean ( 4 / 28 ) & 6240.6447368421 & 194.698788239002 & 32.0528175510851 \tabularnewline
Trimmed Mean ( 5 / 28 ) & 6238.01351351351 & 186.465327106608 & 33.4540131954241 \tabularnewline
Trimmed Mean ( 6 / 28 ) & 6232.58333333333 & 179.795886869124 & 34.6647714909637 \tabularnewline
Trimmed Mean ( 7 / 28 ) & 6219 & 175.036239962492 & 35.529785153821 \tabularnewline
Trimmed Mean ( 8 / 28 ) & 6204.07352941176 & 172.095712589132 & 36.0501341728576 \tabularnewline
Trimmed Mean ( 9 / 28 ) & 6189.77272727273 & 169.142887685996 & 36.5949335023988 \tabularnewline
Trimmed Mean ( 10 / 28 ) & 6174.59375 & 165.691893078447 & 37.265515139456 \tabularnewline
Trimmed Mean ( 11 / 28 ) & 6160.66129032258 & 162.299829841412 & 37.958519712204 \tabularnewline
Trimmed Mean ( 12 / 28 ) & 6145.33333333333 & 158.864318092794 & 38.6829050545119 \tabularnewline
Trimmed Mean ( 13 / 28 ) & 6126.55172413793 & 155.452887478154 & 39.4109869782824 \tabularnewline
Trimmed Mean ( 14 / 28 ) & 6107.48214285714 & 151.669013330317 & 40.2684899753108 \tabularnewline
Trimmed Mean ( 15 / 28 ) & 6087.7962962963 & 147.677189595364 & 41.2236738319361 \tabularnewline
Trimmed Mean ( 16 / 28 ) & 6068.76923076923 & 144.649213213889 & 41.9550794361771 \tabularnewline
Trimmed Mean ( 17 / 28 ) & 6050.28 & 141.694402522197 & 42.6994990084537 \tabularnewline
Trimmed Mean ( 18 / 28 ) & 6034.5625 & 139.571650001941 & 43.2363055098661 \tabularnewline
Trimmed Mean ( 19 / 28 ) & 6017.17391304348 & 137.508163321478 & 43.7586668871145 \tabularnewline
Trimmed Mean ( 20 / 28 ) & 5999.02272727273 & 135.150360587185 & 44.387767085555 \tabularnewline
Trimmed Mean ( 21 / 28 ) & 5979.33333333333 & 132.012545010932 & 45.2936751794172 \tabularnewline
Trimmed Mean ( 22 / 28 ) & 5957.95 & 127.855968393525 & 46.5989196660898 \tabularnewline
Trimmed Mean ( 23 / 28 ) & 5935.34210526316 & 122.50398011542 & 48.4501981051639 \tabularnewline
Trimmed Mean ( 24 / 28 ) & 5912.11111111111 & 116.604655477439 & 50.7021875490639 \tabularnewline
Trimmed Mean ( 25 / 28 ) & 5890.76470588235 & 111.956280132043 & 52.6166526695482 \tabularnewline
Trimmed Mean ( 26 / 28 ) & 5870.90625 & 107.054999425369 & 54.8400941713402 \tabularnewline
Trimmed Mean ( 27 / 28 ) & 5851.13333333333 & 101.492865196642 & 57.6506863019069 \tabularnewline
Trimmed Mean ( 28 / 28 ) & 5833.67857142857 & 95.9342264423861 & 60.80914797319 \tabularnewline
Median & 5935.5 &  &  \tabularnewline
Midrange & 7855 &  &  \tabularnewline
Midmean - Weighted Average at Xnp & 5955.74418604651 &  &  \tabularnewline
Midmean - Weighted Average at X(n+1)p & 5979.33333333333 &  &  \tabularnewline
Midmean - Empirical Distribution Function & 5955.74418604651 &  &  \tabularnewline
Midmean - Empirical Distribution Function - Averaging & 5979.33333333333 &  &  \tabularnewline
Midmean - Empirical Distribution Function - Interpolation & 5979.33333333333 &  &  \tabularnewline
Midmean - Closest Observation & 5955.74418604651 &  &  \tabularnewline
Midmean - True Basic - Statistics Graphics Toolkit & 5979.33333333333 &  &  \tabularnewline
Midmean - MS Excel (old versions) & 5999.02272727273 &  &  \tabularnewline
Number of observations & 84 &  &  \tabularnewline
\hline
\end{tabular}
%Source: https://freestatistics.org/blog/index.php?pk=240057&T=1

[TABLE]
[ROW][C]Central Tendency - Ungrouped Data[/C][/ROW]
[ROW][C]Measure[/C][C]Value[/C][C]S.E.[/C][C]Value/S.E.[/C][/ROW]
[ROW][C]Arithmetic Mean[/C][C]6322.32142857143[/C][C]245.18594706973[/C][C]25.7858229810104[/C][/ROW]
[ROW][C]Geometric Mean[/C][C]5921.37338845792[/C][C][/C][C][/C][/ROW]
[ROW][C]Harmonic Mean[/C][C]5482.36747780887[/C][C][/C][C][/C][/ROW]
[ROW][C]Quadratic Mean[/C][C]6705.32538981766[/C][C][/C][C][/C][/ROW]
[ROW][C]Winsorized Mean ( 1 / 28 )[/C][C]6296.40476190476[/C][C]234.455180219095[/C][C]26.8554729992353[/C][/ROW]
[ROW][C]Winsorized Mean ( 2 / 28 )[/C][C]6303.45238095238[/C][C]231.938561045908[/C][C]27.1772505293103[/C][/ROW]
[ROW][C]Winsorized Mean ( 3 / 28 )[/C][C]6299.34523809524[/C][C]230.301325161652[/C][C]27.3526226289564[/C][/ROW]
[ROW][C]Winsorized Mean ( 4 / 28 )[/C][C]6249.91666666667[/C][C]217.250334286641[/C][C]28.7682718058353[/C][/ROW]
[ROW][C]Winsorized Mean ( 5 / 28 )[/C][C]6261.28571428571[/C][C]207.649238904232[/C][C]30.1531840296002[/C][/ROW]
[ROW][C]Winsorized Mean ( 6 / 28 )[/C][C]6300.5[/C][C]196.216573284903[/C][C]32.1099277931625[/C][/ROW]
[ROW][C]Winsorized Mean ( 7 / 28 )[/C][C]6303.58333333333[/C][C]184.989600743779[/C][C]34.0753388730437[/C][/ROW]
[ROW][C]Winsorized Mean ( 8 / 28 )[/C][C]6293.96428571429[/C][C]182.32037777224[/C][C]34.5214526352995[/C][/ROW]
[ROW][C]Winsorized Mean ( 9 / 28 )[/C][C]6293.85714285714[/C][C]181.650069885803[/C][C]34.6482505997045[/C][/ROW]
[ROW][C]Winsorized Mean ( 10 / 28 )[/C][C]6277.42857142857[/C][C]177.796861954799[/C][C]35.3067455882573[/C][/ROW]
[ROW][C]Winsorized Mean ( 11 / 28 )[/C][C]6281.09523809524[/C][C]174.103082755177[/C][C]36.0768754848971[/C][/ROW]
[ROW][C]Winsorized Mean ( 12 / 28 )[/C][C]6300.95238095238[/C][C]169.56856589112[/C][C]37.1587289651209[/C][/ROW]
[ROW][C]Winsorized Mean ( 13 / 28 )[/C][C]6291.82142857143[/C][C]167.180132032457[/C][C]37.6349830095237[/C][/ROW]
[ROW][C]Winsorized Mean ( 14 / 28 )[/C][C]6284.65476190476[/C][C]163.337255237066[/C][C]38.476554248345[/C][/ROW]
[ROW][C]Winsorized Mean ( 15 / 28 )[/C][C]6264.47619047619[/C][C]153.099583118875[/C][C]40.91765674902[/C][/ROW]
[ROW][C]Winsorized Mean ( 16 / 28 )[/C][C]6244.85714285714[/C][C]148.332655315891[/C][C]42.1003529503199[/C][/ROW]
[ROW][C]Winsorized Mean ( 17 / 28 )[/C][C]6202.96428571429[/C][C]139.739371416282[/C][C]44.3895247477227[/C][/ROW]
[ROW][C]Winsorized Mean ( 18 / 28 )[/C][C]6205.96428571429[/C][C]135.3649170599[/C][C]45.8461795013556[/C][/ROW]
[ROW][C]Winsorized Mean ( 19 / 28 )[/C][C]6197.82142857143[/C][C]132.921698380577[/C][C]46.6276123769202[/C][/ROW]
[ROW][C]Winsorized Mean ( 20 / 28 )[/C][C]6195.91666666667[/C][C]132.255519487763[/C][C]46.8480762894735[/C][/ROW]
[ROW][C]Winsorized Mean ( 21 / 28 )[/C][C]6193.16666666667[/C][C]131.443908568015[/C][C]47.1164220094844[/C][/ROW]
[ROW][C]Winsorized Mean ( 22 / 28 )[/C][C]6182.95238095238[/C][C]129.903712194785[/C][C]47.5964256639663[/C][/ROW]
[ROW][C]Winsorized Mean ( 23 / 28 )[/C][C]6164.33333333333[/C][C]124.184923014939[/C][C]49.6383392095977[/C][/ROW]
[ROW][C]Winsorized Mean ( 24 / 28 )[/C][C]6119.47619047619[/C][C]111.571802911282[/C][C]54.8478740219175[/C][/ROW]
[ROW][C]Winsorized Mean ( 25 / 28 )[/C][C]6079.89285714286[/C][C]105.839705787782[/C][C]57.4443476754707[/C][/ROW]
[ROW][C]Winsorized Mean ( 26 / 28 )[/C][C]6054.5119047619[/C][C]100.78900225678[/C][C]60.0711562689827[/C][/ROW]
[ROW][C]Winsorized Mean ( 27 / 28 )[/C][C]6008.22619047619[/C][C]93.3571961818778[/C][C]64.3573975676284[/C][/ROW]
[ROW][C]Winsorized Mean ( 28 / 28 )[/C][C]5951.22619047619[/C][C]84.1257738538154[/C][C]70.7420082793839[/C][/ROW]
[ROW][C]Trimmed Mean ( 1 / 28 )[/C][C]6284.93902439024[/C][C]225.923111784275[/C][C]27.818929080578[/C][/ROW]
[ROW][C]Trimmed Mean ( 2 / 28 )[/C][C]6272.9[/C][C]215.962621736591[/C][C]29.0462300816622[/C][/ROW]
[ROW][C]Trimmed Mean ( 3 / 28 )[/C][C]6256.44871794872[/C][C]205.872169559041[/C][C]30.3899683543893[/C][/ROW]
[ROW][C]Trimmed Mean ( 4 / 28 )[/C][C]6240.6447368421[/C][C]194.698788239002[/C][C]32.0528175510851[/C][/ROW]
[ROW][C]Trimmed Mean ( 5 / 28 )[/C][C]6238.01351351351[/C][C]186.465327106608[/C][C]33.4540131954241[/C][/ROW]
[ROW][C]Trimmed Mean ( 6 / 28 )[/C][C]6232.58333333333[/C][C]179.795886869124[/C][C]34.6647714909637[/C][/ROW]
[ROW][C]Trimmed Mean ( 7 / 28 )[/C][C]6219[/C][C]175.036239962492[/C][C]35.529785153821[/C][/ROW]
[ROW][C]Trimmed Mean ( 8 / 28 )[/C][C]6204.07352941176[/C][C]172.095712589132[/C][C]36.0501341728576[/C][/ROW]
[ROW][C]Trimmed Mean ( 9 / 28 )[/C][C]6189.77272727273[/C][C]169.142887685996[/C][C]36.5949335023988[/C][/ROW]
[ROW][C]Trimmed Mean ( 10 / 28 )[/C][C]6174.59375[/C][C]165.691893078447[/C][C]37.265515139456[/C][/ROW]
[ROW][C]Trimmed Mean ( 11 / 28 )[/C][C]6160.66129032258[/C][C]162.299829841412[/C][C]37.958519712204[/C][/ROW]
[ROW][C]Trimmed Mean ( 12 / 28 )[/C][C]6145.33333333333[/C][C]158.864318092794[/C][C]38.6829050545119[/C][/ROW]
[ROW][C]Trimmed Mean ( 13 / 28 )[/C][C]6126.55172413793[/C][C]155.452887478154[/C][C]39.4109869782824[/C][/ROW]
[ROW][C]Trimmed Mean ( 14 / 28 )[/C][C]6107.48214285714[/C][C]151.669013330317[/C][C]40.2684899753108[/C][/ROW]
[ROW][C]Trimmed Mean ( 15 / 28 )[/C][C]6087.7962962963[/C][C]147.677189595364[/C][C]41.2236738319361[/C][/ROW]
[ROW][C]Trimmed Mean ( 16 / 28 )[/C][C]6068.76923076923[/C][C]144.649213213889[/C][C]41.9550794361771[/C][/ROW]
[ROW][C]Trimmed Mean ( 17 / 28 )[/C][C]6050.28[/C][C]141.694402522197[/C][C]42.6994990084537[/C][/ROW]
[ROW][C]Trimmed Mean ( 18 / 28 )[/C][C]6034.5625[/C][C]139.571650001941[/C][C]43.2363055098661[/C][/ROW]
[ROW][C]Trimmed Mean ( 19 / 28 )[/C][C]6017.17391304348[/C][C]137.508163321478[/C][C]43.7586668871145[/C][/ROW]
[ROW][C]Trimmed Mean ( 20 / 28 )[/C][C]5999.02272727273[/C][C]135.150360587185[/C][C]44.387767085555[/C][/ROW]
[ROW][C]Trimmed Mean ( 21 / 28 )[/C][C]5979.33333333333[/C][C]132.012545010932[/C][C]45.2936751794172[/C][/ROW]
[ROW][C]Trimmed Mean ( 22 / 28 )[/C][C]5957.95[/C][C]127.855968393525[/C][C]46.5989196660898[/C][/ROW]
[ROW][C]Trimmed Mean ( 23 / 28 )[/C][C]5935.34210526316[/C][C]122.50398011542[/C][C]48.4501981051639[/C][/ROW]
[ROW][C]Trimmed Mean ( 24 / 28 )[/C][C]5912.11111111111[/C][C]116.604655477439[/C][C]50.7021875490639[/C][/ROW]
[ROW][C]Trimmed Mean ( 25 / 28 )[/C][C]5890.76470588235[/C][C]111.956280132043[/C][C]52.6166526695482[/C][/ROW]
[ROW][C]Trimmed Mean ( 26 / 28 )[/C][C]5870.90625[/C][C]107.054999425369[/C][C]54.8400941713402[/C][/ROW]
[ROW][C]Trimmed Mean ( 27 / 28 )[/C][C]5851.13333333333[/C][C]101.492865196642[/C][C]57.6506863019069[/C][/ROW]
[ROW][C]Trimmed Mean ( 28 / 28 )[/C][C]5833.67857142857[/C][C]95.9342264423861[/C][C]60.80914797319[/C][/ROW]
[ROW][C]Median[/C][C]5935.5[/C][C][/C][C][/C][/ROW]
[ROW][C]Midrange[/C][C]7855[/C][C][/C][C][/C][/ROW]
[ROW][C]Midmean - Weighted Average at Xnp[/C][C]5955.74418604651[/C][C][/C][C][/C][/ROW]
[ROW][C]Midmean - Weighted Average at X(n+1)p[/C][C]5979.33333333333[/C][C][/C][C][/C][/ROW]
[ROW][C]Midmean - Empirical Distribution Function[/C][C]5955.74418604651[/C][C][/C][C][/C][/ROW]
[ROW][C]Midmean - Empirical Distribution Function - Averaging[/C][C]5979.33333333333[/C][C][/C][C][/C][/ROW]
[ROW][C]Midmean - Empirical Distribution Function - Interpolation[/C][C]5979.33333333333[/C][C][/C][C][/C][/ROW]
[ROW][C]Midmean - Closest Observation[/C][C]5955.74418604651[/C][C][/C][C][/C][/ROW]
[ROW][C]Midmean - True Basic - Statistics Graphics Toolkit[/C][C]5979.33333333333[/C][C][/C][C][/C][/ROW]
[ROW][C]Midmean - MS Excel (old versions)[/C][C]5999.02272727273[/C][C][/C][C][/C][/ROW]
[ROW][C]Number of observations[/C][C]84[/C][C][/C][C][/C][/ROW]
[/TABLE]
Source: https://freestatistics.org/blog/index.php?pk=240057&T=1

Globally Unique Identifier (entire table): ba.freestatistics.org/blog/index.php?pk=240057&T=1

As an alternative you can also use a QR Code:  

The GUIDs for individual cells are displayed in the table below:

Central Tendency - Ungrouped Data
MeasureValueS.E.Value/S.E.
Arithmetic Mean6322.32142857143245.1859470697325.7858229810104
Geometric Mean5921.37338845792
Harmonic Mean5482.36747780887
Quadratic Mean6705.32538981766
Winsorized Mean ( 1 / 28 )6296.40476190476234.45518021909526.8554729992353
Winsorized Mean ( 2 / 28 )6303.45238095238231.93856104590827.1772505293103
Winsorized Mean ( 3 / 28 )6299.34523809524230.30132516165227.3526226289564
Winsorized Mean ( 4 / 28 )6249.91666666667217.25033428664128.7682718058353
Winsorized Mean ( 5 / 28 )6261.28571428571207.64923890423230.1531840296002
Winsorized Mean ( 6 / 28 )6300.5196.21657328490332.1099277931625
Winsorized Mean ( 7 / 28 )6303.58333333333184.98960074377934.0753388730437
Winsorized Mean ( 8 / 28 )6293.96428571429182.3203777722434.5214526352995
Winsorized Mean ( 9 / 28 )6293.85714285714181.65006988580334.6482505997045
Winsorized Mean ( 10 / 28 )6277.42857142857177.79686195479935.3067455882573
Winsorized Mean ( 11 / 28 )6281.09523809524174.10308275517736.0768754848971
Winsorized Mean ( 12 / 28 )6300.95238095238169.5685658911237.1587289651209
Winsorized Mean ( 13 / 28 )6291.82142857143167.18013203245737.6349830095237
Winsorized Mean ( 14 / 28 )6284.65476190476163.33725523706638.476554248345
Winsorized Mean ( 15 / 28 )6264.47619047619153.09958311887540.91765674902
Winsorized Mean ( 16 / 28 )6244.85714285714148.33265531589142.1003529503199
Winsorized Mean ( 17 / 28 )6202.96428571429139.73937141628244.3895247477227
Winsorized Mean ( 18 / 28 )6205.96428571429135.364917059945.8461795013556
Winsorized Mean ( 19 / 28 )6197.82142857143132.92169838057746.6276123769202
Winsorized Mean ( 20 / 28 )6195.91666666667132.25551948776346.8480762894735
Winsorized Mean ( 21 / 28 )6193.16666666667131.44390856801547.1164220094844
Winsorized Mean ( 22 / 28 )6182.95238095238129.90371219478547.5964256639663
Winsorized Mean ( 23 / 28 )6164.33333333333124.18492301493949.6383392095977
Winsorized Mean ( 24 / 28 )6119.47619047619111.57180291128254.8478740219175
Winsorized Mean ( 25 / 28 )6079.89285714286105.83970578778257.4443476754707
Winsorized Mean ( 26 / 28 )6054.5119047619100.7890022567860.0711562689827
Winsorized Mean ( 27 / 28 )6008.2261904761993.357196181877864.3573975676284
Winsorized Mean ( 28 / 28 )5951.2261904761984.125773853815470.7420082793839
Trimmed Mean ( 1 / 28 )6284.93902439024225.92311178427527.818929080578
Trimmed Mean ( 2 / 28 )6272.9215.96262173659129.0462300816622
Trimmed Mean ( 3 / 28 )6256.44871794872205.87216955904130.3899683543893
Trimmed Mean ( 4 / 28 )6240.6447368421194.69878823900232.0528175510851
Trimmed Mean ( 5 / 28 )6238.01351351351186.46532710660833.4540131954241
Trimmed Mean ( 6 / 28 )6232.58333333333179.79588686912434.6647714909637
Trimmed Mean ( 7 / 28 )6219175.03623996249235.529785153821
Trimmed Mean ( 8 / 28 )6204.07352941176172.09571258913236.0501341728576
Trimmed Mean ( 9 / 28 )6189.77272727273169.14288768599636.5949335023988
Trimmed Mean ( 10 / 28 )6174.59375165.69189307844737.265515139456
Trimmed Mean ( 11 / 28 )6160.66129032258162.29982984141237.958519712204
Trimmed Mean ( 12 / 28 )6145.33333333333158.86431809279438.6829050545119
Trimmed Mean ( 13 / 28 )6126.55172413793155.45288747815439.4109869782824
Trimmed Mean ( 14 / 28 )6107.48214285714151.66901333031740.2684899753108
Trimmed Mean ( 15 / 28 )6087.7962962963147.67718959536441.2236738319361
Trimmed Mean ( 16 / 28 )6068.76923076923144.64921321388941.9550794361771
Trimmed Mean ( 17 / 28 )6050.28141.69440252219742.6994990084537
Trimmed Mean ( 18 / 28 )6034.5625139.57165000194143.2363055098661
Trimmed Mean ( 19 / 28 )6017.17391304348137.50816332147843.7586668871145
Trimmed Mean ( 20 / 28 )5999.02272727273135.15036058718544.387767085555
Trimmed Mean ( 21 / 28 )5979.33333333333132.01254501093245.2936751794172
Trimmed Mean ( 22 / 28 )5957.95127.85596839352546.5989196660898
Trimmed Mean ( 23 / 28 )5935.34210526316122.5039801154248.4501981051639
Trimmed Mean ( 24 / 28 )5912.11111111111116.60465547743950.7021875490639
Trimmed Mean ( 25 / 28 )5890.76470588235111.95628013204352.6166526695482
Trimmed Mean ( 26 / 28 )5870.90625107.05499942536954.8400941713402
Trimmed Mean ( 27 / 28 )5851.13333333333101.49286519664257.6506863019069
Trimmed Mean ( 28 / 28 )5833.6785714285795.934226442386160.80914797319
Median5935.5
Midrange7855
Midmean - Weighted Average at Xnp5955.74418604651
Midmean - Weighted Average at X(n+1)p5979.33333333333
Midmean - Empirical Distribution Function5955.74418604651
Midmean - Empirical Distribution Function - Averaging5979.33333333333
Midmean - Empirical Distribution Function - Interpolation5979.33333333333
Midmean - Closest Observation5955.74418604651
Midmean - True Basic - Statistics Graphics Toolkit5979.33333333333
Midmean - MS Excel (old versions)5999.02272727273
Number of observations84


Parameters (Session):
Parameters (R input):
R code (references can be found in the software module):
geomean <- function(x) {
return(exp(mean(log(x))))
}
harmean <- function(x) {
return(1/mean(1/x))
}
quamean <- function(x) {
return(sqrt(mean(x*x)))
}
winmean <- function(x) {
x <-sort(x[!is.na(x)])
n<-length(x)
denom <- 3
nodenom <- n/denom
if (nodenom>40) denom <- n/40
sqrtn = sqrt(n)
roundnodenom = floor(nodenom)
win <- array(NA,dim=c(roundnodenom,2))
for (j in 1:roundnodenom) {
win[j,1] <- (j*x[j+1]+sum(x[(j+1):(n-j)])+j*x[n-j])/n
win[j,2] <- sd(c(rep(x[j+1],j),x[(j+1):(n-j)],rep(x[n-j],j)))/sqrtn
}
return(win)
}
trimean <- function(x) {
x <-sort(x[!is.na(x)])
n<-length(x)
denom <- 3
nodenom <- n/denom
if (nodenom>40) denom <- n/40
sqrtn = sqrt(n)
roundnodenom = floor(nodenom)
tri <- array(NA,dim=c(roundnodenom,2))
for (j in 1:roundnodenom) {
tri[j,1] <- mean(x,trim=j/n)
tri[j,2] <- sd(x[(j+1):(n-j)]) / sqrt(n-j*2)
}
return(tri)
}
midrange <- function(x) {
return((max(x)+min(x))/2)
}
q1 <- function(data,n,p,i,f) {
np <- n*p;
i <<- floor(np)
f <<- np - i
qvalue <- (1-f)*data[i] + f*data[i+1]
}
q2 <- function(data,n,p,i,f) {
np <- (n+1)*p
i <<- floor(np)
f <<- np - i
qvalue <- (1-f)*data[i] + f*data[i+1]
}
q3 <- function(data,n,p,i,f) {
np <- n*p
i <<- floor(np)
f <<- np - i
if (f==0) {
qvalue <- data[i]
} else {
qvalue <- data[i+1]
}
}
q4 <- function(data,n,p,i,f) {
np <- n*p
i <<- floor(np)
f <<- np - i
if (f==0) {
qvalue <- (data[i]+data[i+1])/2
} else {
qvalue <- data[i+1]
}
}
q5 <- function(data,n,p,i,f) {
np <- (n-1)*p
i <<- floor(np)
f <<- np - i
if (f==0) {
qvalue <- data[i+1]
} else {
qvalue <- data[i+1] + f*(data[i+2]-data[i+1])
}
}
q6 <- function(data,n,p,i,f) {
np <- n*p+0.5
i <<- floor(np)
f <<- np - i
qvalue <- data[i]
}
q7 <- function(data,n,p,i,f) {
np <- (n+1)*p
i <<- floor(np)
f <<- np - i
if (f==0) {
qvalue <- data[i]
} else {
qvalue <- f*data[i] + (1-f)*data[i+1]
}
}
q8 <- function(data,n,p,i,f) {
np <- (n+1)*p
i <<- floor(np)
f <<- np - i
if (f==0) {
qvalue <- data[i]
} else {
if (f == 0.5) {
qvalue <- (data[i]+data[i+1])/2
} else {
if (f < 0.5) {
qvalue <- data[i]
} else {
qvalue <- data[i+1]
}
}
}
}
midmean <- function(x,def) {
x <-sort(x[!is.na(x)])
n<-length(x)
if (def==1) {
qvalue1 <- q1(x,n,0.25,i,f)
qvalue3 <- q1(x,n,0.75,i,f)
}
if (def==2) {
qvalue1 <- q2(x,n,0.25,i,f)
qvalue3 <- q2(x,n,0.75,i,f)
}
if (def==3) {
qvalue1 <- q3(x,n,0.25,i,f)
qvalue3 <- q3(x,n,0.75,i,f)
}
if (def==4) {
qvalue1 <- q4(x,n,0.25,i,f)
qvalue3 <- q4(x,n,0.75,i,f)
}
if (def==5) {
qvalue1 <- q5(x,n,0.25,i,f)
qvalue3 <- q5(x,n,0.75,i,f)
}
if (def==6) {
qvalue1 <- q6(x,n,0.25,i,f)
qvalue3 <- q6(x,n,0.75,i,f)
}
if (def==7) {
qvalue1 <- q7(x,n,0.25,i,f)
qvalue3 <- q7(x,n,0.75,i,f)
}
if (def==8) {
qvalue1 <- q8(x,n,0.25,i,f)
qvalue3 <- q8(x,n,0.75,i,f)
}
midm <- 0
myn <- 0
roundno4 <- round(n/4)
round3no4 <- round(3*n/4)
for (i in 1:n) {
if ((x[i]>=qvalue1) & (x[i]<=qvalue3)){
midm = midm + x[i]
myn = myn + 1
}
}
midm = midm / myn
return(midm)
}
(arm <- mean(x))
sqrtn <- sqrt(length(x))
(armse <- sd(x) / sqrtn)
(armose <- arm / armse)
(geo <- geomean(x))
(har <- harmean(x))
(qua <- quamean(x))
(win <- winmean(x))
(tri <- trimean(x))
(midr <- midrange(x))
midm <- array(NA,dim=8)
for (j in 1:8) midm[j] <- midmean(x,j)
midm
bitmap(file='test1.png')
lb <- win[,1] - 2*win[,2]
ub <- win[,1] + 2*win[,2]
if ((ylimmin == '') | (ylimmax == '')) plot(win[,1],type='b',main=main, xlab='j', pch=19, ylab='Winsorized Mean(j/n)', ylim=c(min(lb),max(ub))) else plot(win[,1],type='l',main=main, xlab='j', pch=19, ylab='Winsorized Mean(j/n)', ylim=c(ylimmin,ylimmax))
lines(ub,lty=3)
lines(lb,lty=3)
grid()
dev.off()
bitmap(file='test2.png')
lb <- tri[,1] - 2*tri[,2]
ub <- tri[,1] + 2*tri[,2]
if ((ylimmin == '') | (ylimmax == '')) plot(tri[,1],type='b',main=main, xlab='j', pch=19, ylab='Trimmed Mean(j/n)', ylim=c(min(lb),max(ub))) else plot(tri[,1],type='l',main=main, xlab='j', pch=19, ylab='Trimmed Mean(j/n)', ylim=c(ylimmin,ylimmax))
lines(ub,lty=3)
lines(lb,lty=3)
grid()
dev.off()
load(file='createtable')
a<-table.start()
a<-table.row.start(a)
a<-table.element(a,'Central Tendency - Ungrouped Data',4,TRUE)
a<-table.row.end(a)
a<-table.row.start(a)
a<-table.element(a,'Measure',header=TRUE)
a<-table.element(a,'Value',header=TRUE)
a<-table.element(a,'S.E.',header=TRUE)
a<-table.element(a,'Value/S.E.',header=TRUE)
a<-table.row.end(a)
a<-table.row.start(a)
a<-table.element(a,hyperlink('arithmetic_mean.htm', 'Arithmetic Mean', 'click to view the definition of the Arithmetic Mean'),header=TRUE)
a<-table.element(a,arm)
a<-table.element(a,hyperlink('arithmetic_mean_standard_error.htm', armse, 'click to view the definition of the Standard Error of the Arithmetic Mean'))
a<-table.element(a,armose)
a<-table.row.end(a)
a<-table.row.start(a)
a<-table.element(a,hyperlink('geometric_mean.htm', 'Geometric Mean', 'click to view the definition of the Geometric Mean'),header=TRUE)
a<-table.element(a,geo)
a<-table.element(a,'')
a<-table.row.end(a)
a<-table.row.start(a)
a<-table.element(a,hyperlink('harmonic_mean.htm', 'Harmonic Mean', 'click to view the definition of the Harmonic Mean'),header=TRUE)
a<-table.element(a,har)
a<-table.element(a,'')
a<-table.row.end(a)
a<-table.row.start(a)
a<-table.element(a,hyperlink('quadratic_mean.htm', 'Quadratic Mean', 'click to view the definition of the Quadratic Mean'),header=TRUE)
a<-table.element(a,qua)
a<-table.element(a,'')
a<-table.row.end(a)
for (j in 1:length(win[,1])) {
a<-table.row.start(a)
mylabel <- paste('Winsorized Mean (',j)
mylabel <- paste(mylabel,'/')
mylabel <- paste(mylabel,length(win[,1]))
mylabel <- paste(mylabel,')')
a<-table.element(a,hyperlink('winsorized_mean.htm', mylabel, 'click to view the definition of the Winsorized Mean'),header=TRUE)
a<-table.element(a,win[j,1])
a<-table.element(a,win[j,2])
a<-table.element(a,win[j,1]/win[j,2])
a<-table.row.end(a)
}
for (j in 1:length(tri[,1])) {
a<-table.row.start(a)
mylabel <- paste('Trimmed Mean (',j)
mylabel <- paste(mylabel,'/')
mylabel <- paste(mylabel,length(tri[,1]))
mylabel <- paste(mylabel,')')
a<-table.element(a,hyperlink('arithmetic_mean.htm', mylabel, 'click to view the definition of the Trimmed Mean'),header=TRUE)
a<-table.element(a,tri[j,1])
a<-table.element(a,tri[j,2])
a<-table.element(a,tri[j,1]/tri[j,2])
a<-table.row.end(a)
}
a<-table.row.start(a)
a<-table.element(a,hyperlink('median_1.htm', 'Median', 'click to view the definition of the Median'),header=TRUE)
a<-table.element(a,median(x))
a<-table.element(a,'')
a<-table.row.end(a)
a<-table.row.start(a)
a<-table.element(a,hyperlink('midrange.htm', 'Midrange', 'click to view the definition of the Midrange'),header=TRUE)
a<-table.element(a,midr)
a<-table.element(a,'')
a<-table.row.end(a)
a<-table.row.start(a)
mymid <- hyperlink('midmean.htm', 'Midmean', 'click to view the definition of the Midmean')
mylabel <- paste(mymid,hyperlink('method_1.htm','Weighted Average at Xnp',''),sep=' - ')
a<-table.element(a,mylabel,header=TRUE)
a<-table.element(a,midm[1])
a<-table.element(a,'')
a<-table.row.end(a)
a<-table.row.start(a)
mymid <- hyperlink('midmean.htm', 'Midmean', 'click to view the definition of the Midmean')
mylabel <- paste(mymid,hyperlink('method_2.htm','Weighted Average at X(n+1)p',''),sep=' - ')
a<-table.element(a,mylabel,header=TRUE)
a<-table.element(a,midm[2])
a<-table.element(a,'')
a<-table.row.end(a)
a<-table.row.start(a)
mymid <- hyperlink('midmean.htm', 'Midmean', 'click to view the definition of the Midmean')
mylabel <- paste(mymid,hyperlink('method_3.htm','Empirical Distribution Function',''),sep=' - ')
a<-table.element(a,mylabel,header=TRUE)
a<-table.element(a,midm[3])
a<-table.element(a,'')
a<-table.row.end(a)
a<-table.row.start(a)
mymid <- hyperlink('midmean.htm', 'Midmean', 'click to view the definition of the Midmean')
mylabel <- paste(mymid,hyperlink('method_4.htm','Empirical Distribution Function - Averaging',''),sep=' - ')
a<-table.element(a,mylabel,header=TRUE)
a<-table.element(a,midm[4])
a<-table.element(a,'')
a<-table.row.end(a)
a<-table.row.start(a)
mymid <- hyperlink('midmean.htm', 'Midmean', 'click to view the definition of the Midmean')
mylabel <- paste(mymid,hyperlink('method_5.htm','Empirical Distribution Function - Interpolation',''),sep=' - ')
a<-table.element(a,mylabel,header=TRUE)
a<-table.element(a,midm[5])
a<-table.element(a,'')
a<-table.row.end(a)
a<-table.row.start(a)
mymid <- hyperlink('midmean.htm', 'Midmean', 'click to view the definition of the Midmean')
mylabel <- paste(mymid,hyperlink('method_6.htm','Closest Observation',''),sep=' - ')
a<-table.element(a,mylabel,header=TRUE)
a<-table.element(a,midm[6])
a<-table.element(a,'')
a<-table.row.end(a)
a<-table.row.start(a)
mymid <- hyperlink('midmean.htm', 'Midmean', 'click to view the definition of the Midmean')
mylabel <- paste(mymid,hyperlink('method_7.htm','True Basic - Statistics Graphics Toolkit',''),sep=' - ')
a<-table.element(a,mylabel,header=TRUE)
a<-table.element(a,midm[7])
a<-table.element(a,'')
a<-table.row.end(a)
a<-table.row.start(a)
mymid <- hyperlink('midmean.htm', 'Midmean', 'click to view the definition of the Midmean')
mylabel <- paste(mymid,hyperlink('method_8.htm','MS Excel (old versions)',''),sep=' - ')
a<-table.element(a,mylabel,header=TRUE)
a<-table.element(a,midm[8])
a<-table.element(a,'')
a<-table.row.end(a)
a<-table.row.start(a)
a<-table.element(a,'Number of observations',header=TRUE)
a<-table.element(a,length(x))
a<-table.element(a,'')
a<-table.row.end(a)
a<-table.end(a)
table.save(a,file='mytable.tab')