Free Statistics

of Irreproducible Research!

Author's title

Author*Unverified author*
R Software Modulerwasp_centraltendency.wasp
Title produced by softwareCentral Tendency
Date of computationThu, 09 Oct 2014 15:57:50 +0100
Cite this page as followsStatistical Computations at FreeStatistics.org, Office for Research Development and Education, URL https://freestatistics.org/blog/index.php?v=date/2014/Oct/09/t141286670704lubwb3x6oddyw.htm/, Retrieved Sat, 11 May 2024 18:40:17 +0000
Statistical Computations at FreeStatistics.org, Office for Research Development and Education, URL https://freestatistics.org/blog/index.php?pk=239975, Retrieved Sat, 11 May 2024 18:40:17 +0000
QR Codes:

Original text written by user:
IsPrivate?No (this computation is public)
User-defined keywords
Estimated Impact72
Family? (F = Feedback message, R = changed R code, M = changed R Module, P = changed Parameters, D = changed Data)
-       [Central Tendency] [] [2014-10-09 14:57:50] [86aa9cab8dcce5e94006dddc76eef874] [Current]
Feedback Forum

Post a new message
Dataseries X:
18293,9
18613,4
18728,5
20091,8
18947,2
20124,9
19819,2
15908,6
19927,4
19551,9
15588,6
14206,2
13566,7
13941,5
14964,1
14086
13505,1
15300,4
14725,2
12484,9
16082,6
15915,8
15916,1
15713
14746
15253,2
18384,3
16848,5
16485,5
19257,1
17093,4
15700,1
19124,3
18640,8
18439,2
17106,3
18347,7
19372,7
22263,8
19422,9
21268,6
20310
19256
17535,9
19857,4
19628,4
19727,5
18112,2
19080,2
20684,6
22537,7
19954,6
20230,2
20445,5
19615,3
18071,6
19287,2
21031,4
19860,9
17671,3
19359,2
19287
21498
20859,7
20833,1
20318,8
21375,9
17403,4
21050,1
22010,2
20372,1
19028,4


Summary of computational transaction
Raw Inputview raw input (R code)
Raw Outputview raw output of R engine
Computing time1 seconds
R Server'Sir Maurice George Kendall' @ kendall.wessa.net

\begin{tabular}{lllllllll}
\hline
Summary of computational transaction \tabularnewline
Raw Input & view raw input (R code)  \tabularnewline
Raw Output & view raw output of R engine  \tabularnewline
Computing time & 1 seconds \tabularnewline
R Server & 'Sir Maurice George Kendall' @ kendall.wessa.net \tabularnewline
\hline
\end{tabular}
%Source: https://freestatistics.org/blog/index.php?pk=239975&T=0

[TABLE]
[ROW][C]Summary of computational transaction[/C][/ROW]
[ROW][C]Raw Input[/C][C]view raw input (R code) [/C][/ROW]
[ROW][C]Raw Output[/C][C]view raw output of R engine [/C][/ROW]
[ROW][C]Computing time[/C][C]1 seconds[/C][/ROW]
[ROW][C]R Server[/C][C]'Sir Maurice George Kendall' @ kendall.wessa.net[/C][/ROW]
[/TABLE]
Source: https://freestatistics.org/blog/index.php?pk=239975&T=0

Globally Unique Identifier (entire table): ba.freestatistics.org/blog/index.php?pk=239975&T=0

As an alternative you can also use a QR Code:  

The GUIDs for individual cells are displayed in the table below:

Summary of computational transaction
Raw Inputview raw input (R code)
Raw Outputview raw output of R engine
Computing time1 seconds
R Server'Sir Maurice George Kendall' @ kendall.wessa.net


Central Tendency - Ungrouped Data
MeasureValueS.E.Value/S.E.
Arithmetic Mean18334.0444444444282.144342386864.9810812768656
Geometric Mean18169.7827404376
Harmonic Mean17995.2410692173
Quadratic Mean18487.5409726839
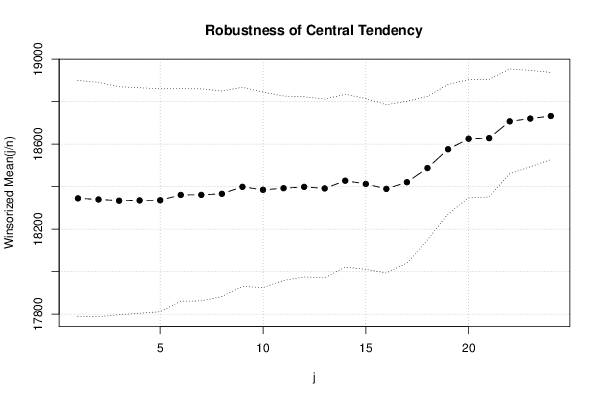
Winsorized Mean ( 1 / 24 )18344.4097222222277.55559392618566.0927400623778
Winsorized Mean ( 2 / 24 )18339.0763888889275.77591004403366.4999215702369
Winsorized Mean ( 3 / 24 )18333.3513888889268.29444538576568.3329517408696
Winsorized Mean ( 4 / 24 )18334.5958333333265.35267344522669.0951992127488
Winsorized Mean ( 5 / 24 )18335.4916666667262.29767985813269.9033696240992
Winsorized Mean ( 6 / 24 )18360.5333333333250.25636436057673.3668987010416
Winsorized Mean ( 7 / 24 )18360.7375249.56861802605173.5698969094079
Winsorized Mean ( 8 / 24 )18365.8930555556241.87176873108175.9323551975807
Winsorized Mean ( 9 / 24 )18398.7055555556234.39010923975578.4960833681582
Winsorized Mean ( 10 / 24 )18384.6361111111230.19170812489879.8666305614097
Winsorized Mean ( 11 / 24 )18392.1375217.01880454820884.7490499189181
Winsorized Mean ( 12 / 24 )18398.4875212.0454055383686.7667349513575
Winsorized Mean ( 13 / 24 )18391.1930555556210.37606380278187.4205587989162
Winsorized Mean ( 14 / 24 )18427.5152777778203.42633438125890.5856920335655
Winsorized Mean ( 15 / 24 )18412.3902777778201.02206334072991.5938776659011
Winsorized Mean ( 16 / 24 )18389.0569444444198.07574267184192.8385106444366
Winsorized Mean ( 17 / 24 )18420.5541666667190.25030581120796.8227309182152
Winsorized Mean ( 18 / 24 )18486.9791666667168.886375253406109.464005837817
Winsorized Mean ( 19 / 24 )18575.5930555556152.338659815425121.936172197273
Winsorized Mean ( 20 / 24 )18625.1486111111139.324935192818133.681372866493
Winsorized Mean ( 21 / 24 )18627.8902777778138.615247161122134.385579215
Winsorized Mean ( 22 / 24 )18706.9986111111123.356923427445151.649360987136
Winsorized Mean ( 23 / 24 )18720.0319444444113.39907244576165.080997054879
Winsorized Mean ( 24 / 24 )18732.1319444444102.696350634251182.40309250285
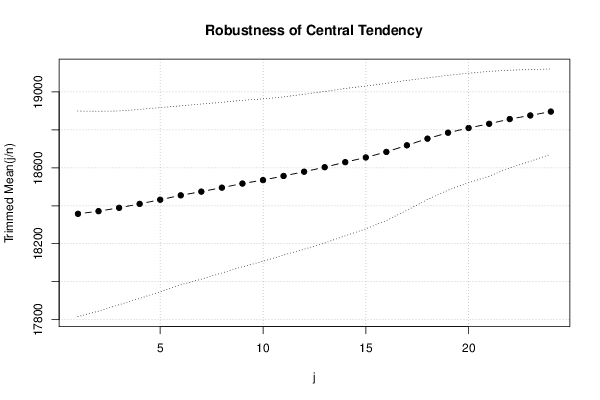
Trimmed Mean ( 1 / 24 )18357.5514285714271.11496901000467.7113163305049
Trimmed Mean ( 2 / 24 )18371.4661764706263.44564509119669.7353192918068
Trimmed Mean ( 3 / 24 )18389.1333333333255.41048607648171.9983490725859
Trimmed Mean ( 4 / 24 )18410.0515625249.19591746796273.8778217137803
Trimmed Mean ( 5 / 24 )18431.9580645161242.7467882647375.9308009645629
Trimmed Mean ( 6 / 24 )18455.11235.85546585211178.2475400064374
Trimmed Mean ( 7 / 24 )18474.6775862069230.89688447135780.0126759116091
Trimmed Mean ( 8 / 24 )18495.6053571429224.90229691705982.2384013444014
Trimmed Mean ( 9 / 24 )18517.2240740741219.3503378919284.4184889434635
Trimmed Mean ( 10 / 24 )18535.4576923077214.19240339891286.5364849461411
Trimmed Mean ( 11 / 24 )18557.176208.55331000675988.9804913640476
Trimmed Mean ( 12 / 24 )18579.68125204.29666720915590.944612576467
Trimmed Mean ( 13 / 24 )18603.3152173913199.79278417495693.1130485728684
Trimmed Mean ( 14 / 24 )18630.0159090909194.12667680782195.9683450798164
Trimmed Mean ( 15 / 24 )18654.8119047619188.28349406434399.0783180302936
Trimmed Mean ( 16 / 24 )18683.9025180.860082784211103.305838482294
Trimmed Mean ( 17 / 24 )18718.8184210526171.273876235488109.29173107121
Trimmed Mean ( 18 / 24 )18753.9083333333160.271576432946117.013314217818
Trimmed Mean ( 19 / 24 )18785.3117647059151.477352617073124.013995756806
Trimmed Mean ( 20 / 24 )18810.146875144.347053710866130.311955744366
Trimmed Mean ( 21 / 24 )18832.3466666667138.145752010214136.322300125988
Trimmed Mean ( 22 / 24 )18857.3821428571128.872682963131146.325673597189
Trimmed Mean ( 23 / 24 )18876.3115384615120.94055301637156.079256028427
Trimmed Mean ( 24 / 24 )18896.6958333333112.418278930301168.092733789753
Median19054.3
Midrange17511.3
Midmean - Weighted Average at Xnp18681.7108108108
Midmean - Weighted Average at X(n+1)p18753.9083333333
Midmean - Empirical Distribution Function18681.7108108108
Midmean - Empirical Distribution Function - Averaging18753.9083333333
Midmean - Empirical Distribution Function - Interpolation18753.9083333333
Midmean - Closest Observation18681.7108108108
Midmean - True Basic - Statistics Graphics Toolkit18753.9083333333
Midmean - MS Excel (old versions)18718.8184210526
Number of observations72

\begin{tabular}{lllllllll}
\hline
Central Tendency - Ungrouped Data \tabularnewline
Measure & Value & S.E. & Value/S.E. \tabularnewline
Arithmetic Mean & 18334.0444444444 & 282.1443423868 & 64.9810812768656 \tabularnewline
Geometric Mean & 18169.7827404376 &  &  \tabularnewline
Harmonic Mean & 17995.2410692173 &  &  \tabularnewline
Quadratic Mean & 18487.5409726839 &  &  \tabularnewline
Winsorized Mean ( 1 / 24 ) & 18344.4097222222 & 277.555593926185 & 66.0927400623778 \tabularnewline
Winsorized Mean ( 2 / 24 ) & 18339.0763888889 & 275.775910044033 & 66.4999215702369 \tabularnewline
Winsorized Mean ( 3 / 24 ) & 18333.3513888889 & 268.294445385765 & 68.3329517408696 \tabularnewline
Winsorized Mean ( 4 / 24 ) & 18334.5958333333 & 265.352673445226 & 69.0951992127488 \tabularnewline
Winsorized Mean ( 5 / 24 ) & 18335.4916666667 & 262.297679858132 & 69.9033696240992 \tabularnewline
Winsorized Mean ( 6 / 24 ) & 18360.5333333333 & 250.256364360576 & 73.3668987010416 \tabularnewline
Winsorized Mean ( 7 / 24 ) & 18360.7375 & 249.568618026051 & 73.5698969094079 \tabularnewline
Winsorized Mean ( 8 / 24 ) & 18365.8930555556 & 241.871768731081 & 75.9323551975807 \tabularnewline
Winsorized Mean ( 9 / 24 ) & 18398.7055555556 & 234.390109239755 & 78.4960833681582 \tabularnewline
Winsorized Mean ( 10 / 24 ) & 18384.6361111111 & 230.191708124898 & 79.8666305614097 \tabularnewline
Winsorized Mean ( 11 / 24 ) & 18392.1375 & 217.018804548208 & 84.7490499189181 \tabularnewline
Winsorized Mean ( 12 / 24 ) & 18398.4875 & 212.04540553836 & 86.7667349513575 \tabularnewline
Winsorized Mean ( 13 / 24 ) & 18391.1930555556 & 210.376063802781 & 87.4205587989162 \tabularnewline
Winsorized Mean ( 14 / 24 ) & 18427.5152777778 & 203.426334381258 & 90.5856920335655 \tabularnewline
Winsorized Mean ( 15 / 24 ) & 18412.3902777778 & 201.022063340729 & 91.5938776659011 \tabularnewline
Winsorized Mean ( 16 / 24 ) & 18389.0569444444 & 198.075742671841 & 92.8385106444366 \tabularnewline
Winsorized Mean ( 17 / 24 ) & 18420.5541666667 & 190.250305811207 & 96.8227309182152 \tabularnewline
Winsorized Mean ( 18 / 24 ) & 18486.9791666667 & 168.886375253406 & 109.464005837817 \tabularnewline
Winsorized Mean ( 19 / 24 ) & 18575.5930555556 & 152.338659815425 & 121.936172197273 \tabularnewline
Winsorized Mean ( 20 / 24 ) & 18625.1486111111 & 139.324935192818 & 133.681372866493 \tabularnewline
Winsorized Mean ( 21 / 24 ) & 18627.8902777778 & 138.615247161122 & 134.385579215 \tabularnewline
Winsorized Mean ( 22 / 24 ) & 18706.9986111111 & 123.356923427445 & 151.649360987136 \tabularnewline
Winsorized Mean ( 23 / 24 ) & 18720.0319444444 & 113.39907244576 & 165.080997054879 \tabularnewline
Winsorized Mean ( 24 / 24 ) & 18732.1319444444 & 102.696350634251 & 182.40309250285 \tabularnewline
Trimmed Mean ( 1 / 24 ) & 18357.5514285714 & 271.114969010004 & 67.7113163305049 \tabularnewline
Trimmed Mean ( 2 / 24 ) & 18371.4661764706 & 263.445645091196 & 69.7353192918068 \tabularnewline
Trimmed Mean ( 3 / 24 ) & 18389.1333333333 & 255.410486076481 & 71.9983490725859 \tabularnewline
Trimmed Mean ( 4 / 24 ) & 18410.0515625 & 249.195917467962 & 73.8778217137803 \tabularnewline
Trimmed Mean ( 5 / 24 ) & 18431.9580645161 & 242.74678826473 & 75.9308009645629 \tabularnewline
Trimmed Mean ( 6 / 24 ) & 18455.11 & 235.855465852111 & 78.2475400064374 \tabularnewline
Trimmed Mean ( 7 / 24 ) & 18474.6775862069 & 230.896884471357 & 80.0126759116091 \tabularnewline
Trimmed Mean ( 8 / 24 ) & 18495.6053571429 & 224.902296917059 & 82.2384013444014 \tabularnewline
Trimmed Mean ( 9 / 24 ) & 18517.2240740741 & 219.35033789192 & 84.4184889434635 \tabularnewline
Trimmed Mean ( 10 / 24 ) & 18535.4576923077 & 214.192403398912 & 86.5364849461411 \tabularnewline
Trimmed Mean ( 11 / 24 ) & 18557.176 & 208.553310006759 & 88.9804913640476 \tabularnewline
Trimmed Mean ( 12 / 24 ) & 18579.68125 & 204.296667209155 & 90.944612576467 \tabularnewline
Trimmed Mean ( 13 / 24 ) & 18603.3152173913 & 199.792784174956 & 93.1130485728684 \tabularnewline
Trimmed Mean ( 14 / 24 ) & 18630.0159090909 & 194.126676807821 & 95.9683450798164 \tabularnewline
Trimmed Mean ( 15 / 24 ) & 18654.8119047619 & 188.283494064343 & 99.0783180302936 \tabularnewline
Trimmed Mean ( 16 / 24 ) & 18683.9025 & 180.860082784211 & 103.305838482294 \tabularnewline
Trimmed Mean ( 17 / 24 ) & 18718.8184210526 & 171.273876235488 & 109.29173107121 \tabularnewline
Trimmed Mean ( 18 / 24 ) & 18753.9083333333 & 160.271576432946 & 117.013314217818 \tabularnewline
Trimmed Mean ( 19 / 24 ) & 18785.3117647059 & 151.477352617073 & 124.013995756806 \tabularnewline
Trimmed Mean ( 20 / 24 ) & 18810.146875 & 144.347053710866 & 130.311955744366 \tabularnewline
Trimmed Mean ( 21 / 24 ) & 18832.3466666667 & 138.145752010214 & 136.322300125988 \tabularnewline
Trimmed Mean ( 22 / 24 ) & 18857.3821428571 & 128.872682963131 & 146.325673597189 \tabularnewline
Trimmed Mean ( 23 / 24 ) & 18876.3115384615 & 120.94055301637 & 156.079256028427 \tabularnewline
Trimmed Mean ( 24 / 24 ) & 18896.6958333333 & 112.418278930301 & 168.092733789753 \tabularnewline
Median & 19054.3 &  &  \tabularnewline
Midrange & 17511.3 &  &  \tabularnewline
Midmean - Weighted Average at Xnp & 18681.7108108108 &  &  \tabularnewline
Midmean - Weighted Average at X(n+1)p & 18753.9083333333 &  &  \tabularnewline
Midmean - Empirical Distribution Function & 18681.7108108108 &  &  \tabularnewline
Midmean - Empirical Distribution Function - Averaging & 18753.9083333333 &  &  \tabularnewline
Midmean - Empirical Distribution Function - Interpolation & 18753.9083333333 &  &  \tabularnewline
Midmean - Closest Observation & 18681.7108108108 &  &  \tabularnewline
Midmean - True Basic - Statistics Graphics Toolkit & 18753.9083333333 &  &  \tabularnewline
Midmean - MS Excel (old versions) & 18718.8184210526 &  &  \tabularnewline
Number of observations & 72 &  &  \tabularnewline
\hline
\end{tabular}
%Source: https://freestatistics.org/blog/index.php?pk=239975&T=1

[TABLE]
[ROW][C]Central Tendency - Ungrouped Data[/C][/ROW]
[ROW][C]Measure[/C][C]Value[/C][C]S.E.[/C][C]Value/S.E.[/C][/ROW]
[ROW][C]Arithmetic Mean[/C][C]18334.0444444444[/C][C]282.1443423868[/C][C]64.9810812768656[/C][/ROW]
[ROW][C]Geometric Mean[/C][C]18169.7827404376[/C][C][/C][C][/C][/ROW]
[ROW][C]Harmonic Mean[/C][C]17995.2410692173[/C][C][/C][C][/C][/ROW]
[ROW][C]Quadratic Mean[/C][C]18487.5409726839[/C][C][/C][C][/C][/ROW]
[ROW][C]Winsorized Mean ( 1 / 24 )[/C][C]18344.4097222222[/C][C]277.555593926185[/C][C]66.0927400623778[/C][/ROW]
[ROW][C]Winsorized Mean ( 2 / 24 )[/C][C]18339.0763888889[/C][C]275.775910044033[/C][C]66.4999215702369[/C][/ROW]
[ROW][C]Winsorized Mean ( 3 / 24 )[/C][C]18333.3513888889[/C][C]268.294445385765[/C][C]68.3329517408696[/C][/ROW]
[ROW][C]Winsorized Mean ( 4 / 24 )[/C][C]18334.5958333333[/C][C]265.352673445226[/C][C]69.0951992127488[/C][/ROW]
[ROW][C]Winsorized Mean ( 5 / 24 )[/C][C]18335.4916666667[/C][C]262.297679858132[/C][C]69.9033696240992[/C][/ROW]
[ROW][C]Winsorized Mean ( 6 / 24 )[/C][C]18360.5333333333[/C][C]250.256364360576[/C][C]73.3668987010416[/C][/ROW]
[ROW][C]Winsorized Mean ( 7 / 24 )[/C][C]18360.7375[/C][C]249.568618026051[/C][C]73.5698969094079[/C][/ROW]
[ROW][C]Winsorized Mean ( 8 / 24 )[/C][C]18365.8930555556[/C][C]241.871768731081[/C][C]75.9323551975807[/C][/ROW]
[ROW][C]Winsorized Mean ( 9 / 24 )[/C][C]18398.7055555556[/C][C]234.390109239755[/C][C]78.4960833681582[/C][/ROW]
[ROW][C]Winsorized Mean ( 10 / 24 )[/C][C]18384.6361111111[/C][C]230.191708124898[/C][C]79.8666305614097[/C][/ROW]
[ROW][C]Winsorized Mean ( 11 / 24 )[/C][C]18392.1375[/C][C]217.018804548208[/C][C]84.7490499189181[/C][/ROW]
[ROW][C]Winsorized Mean ( 12 / 24 )[/C][C]18398.4875[/C][C]212.04540553836[/C][C]86.7667349513575[/C][/ROW]
[ROW][C]Winsorized Mean ( 13 / 24 )[/C][C]18391.1930555556[/C][C]210.376063802781[/C][C]87.4205587989162[/C][/ROW]
[ROW][C]Winsorized Mean ( 14 / 24 )[/C][C]18427.5152777778[/C][C]203.426334381258[/C][C]90.5856920335655[/C][/ROW]
[ROW][C]Winsorized Mean ( 15 / 24 )[/C][C]18412.3902777778[/C][C]201.022063340729[/C][C]91.5938776659011[/C][/ROW]
[ROW][C]Winsorized Mean ( 16 / 24 )[/C][C]18389.0569444444[/C][C]198.075742671841[/C][C]92.8385106444366[/C][/ROW]
[ROW][C]Winsorized Mean ( 17 / 24 )[/C][C]18420.5541666667[/C][C]190.250305811207[/C][C]96.8227309182152[/C][/ROW]
[ROW][C]Winsorized Mean ( 18 / 24 )[/C][C]18486.9791666667[/C][C]168.886375253406[/C][C]109.464005837817[/C][/ROW]
[ROW][C]Winsorized Mean ( 19 / 24 )[/C][C]18575.5930555556[/C][C]152.338659815425[/C][C]121.936172197273[/C][/ROW]
[ROW][C]Winsorized Mean ( 20 / 24 )[/C][C]18625.1486111111[/C][C]139.324935192818[/C][C]133.681372866493[/C][/ROW]
[ROW][C]Winsorized Mean ( 21 / 24 )[/C][C]18627.8902777778[/C][C]138.615247161122[/C][C]134.385579215[/C][/ROW]
[ROW][C]Winsorized Mean ( 22 / 24 )[/C][C]18706.9986111111[/C][C]123.356923427445[/C][C]151.649360987136[/C][/ROW]
[ROW][C]Winsorized Mean ( 23 / 24 )[/C][C]18720.0319444444[/C][C]113.39907244576[/C][C]165.080997054879[/C][/ROW]
[ROW][C]Winsorized Mean ( 24 / 24 )[/C][C]18732.1319444444[/C][C]102.696350634251[/C][C]182.40309250285[/C][/ROW]
[ROW][C]Trimmed Mean ( 1 / 24 )[/C][C]18357.5514285714[/C][C]271.114969010004[/C][C]67.7113163305049[/C][/ROW]
[ROW][C]Trimmed Mean ( 2 / 24 )[/C][C]18371.4661764706[/C][C]263.445645091196[/C][C]69.7353192918068[/C][/ROW]
[ROW][C]Trimmed Mean ( 3 / 24 )[/C][C]18389.1333333333[/C][C]255.410486076481[/C][C]71.9983490725859[/C][/ROW]
[ROW][C]Trimmed Mean ( 4 / 24 )[/C][C]18410.0515625[/C][C]249.195917467962[/C][C]73.8778217137803[/C][/ROW]
[ROW][C]Trimmed Mean ( 5 / 24 )[/C][C]18431.9580645161[/C][C]242.74678826473[/C][C]75.9308009645629[/C][/ROW]
[ROW][C]Trimmed Mean ( 6 / 24 )[/C][C]18455.11[/C][C]235.855465852111[/C][C]78.2475400064374[/C][/ROW]
[ROW][C]Trimmed Mean ( 7 / 24 )[/C][C]18474.6775862069[/C][C]230.896884471357[/C][C]80.0126759116091[/C][/ROW]
[ROW][C]Trimmed Mean ( 8 / 24 )[/C][C]18495.6053571429[/C][C]224.902296917059[/C][C]82.2384013444014[/C][/ROW]
[ROW][C]Trimmed Mean ( 9 / 24 )[/C][C]18517.2240740741[/C][C]219.35033789192[/C][C]84.4184889434635[/C][/ROW]
[ROW][C]Trimmed Mean ( 10 / 24 )[/C][C]18535.4576923077[/C][C]214.192403398912[/C][C]86.5364849461411[/C][/ROW]
[ROW][C]Trimmed Mean ( 11 / 24 )[/C][C]18557.176[/C][C]208.553310006759[/C][C]88.9804913640476[/C][/ROW]
[ROW][C]Trimmed Mean ( 12 / 24 )[/C][C]18579.68125[/C][C]204.296667209155[/C][C]90.944612576467[/C][/ROW]
[ROW][C]Trimmed Mean ( 13 / 24 )[/C][C]18603.3152173913[/C][C]199.792784174956[/C][C]93.1130485728684[/C][/ROW]
[ROW][C]Trimmed Mean ( 14 / 24 )[/C][C]18630.0159090909[/C][C]194.126676807821[/C][C]95.9683450798164[/C][/ROW]
[ROW][C]Trimmed Mean ( 15 / 24 )[/C][C]18654.8119047619[/C][C]188.283494064343[/C][C]99.0783180302936[/C][/ROW]
[ROW][C]Trimmed Mean ( 16 / 24 )[/C][C]18683.9025[/C][C]180.860082784211[/C][C]103.305838482294[/C][/ROW]
[ROW][C]Trimmed Mean ( 17 / 24 )[/C][C]18718.8184210526[/C][C]171.273876235488[/C][C]109.29173107121[/C][/ROW]
[ROW][C]Trimmed Mean ( 18 / 24 )[/C][C]18753.9083333333[/C][C]160.271576432946[/C][C]117.013314217818[/C][/ROW]
[ROW][C]Trimmed Mean ( 19 / 24 )[/C][C]18785.3117647059[/C][C]151.477352617073[/C][C]124.013995756806[/C][/ROW]
[ROW][C]Trimmed Mean ( 20 / 24 )[/C][C]18810.146875[/C][C]144.347053710866[/C][C]130.311955744366[/C][/ROW]
[ROW][C]Trimmed Mean ( 21 / 24 )[/C][C]18832.3466666667[/C][C]138.145752010214[/C][C]136.322300125988[/C][/ROW]
[ROW][C]Trimmed Mean ( 22 / 24 )[/C][C]18857.3821428571[/C][C]128.872682963131[/C][C]146.325673597189[/C][/ROW]
[ROW][C]Trimmed Mean ( 23 / 24 )[/C][C]18876.3115384615[/C][C]120.94055301637[/C][C]156.079256028427[/C][/ROW]
[ROW][C]Trimmed Mean ( 24 / 24 )[/C][C]18896.6958333333[/C][C]112.418278930301[/C][C]168.092733789753[/C][/ROW]
[ROW][C]Median[/C][C]19054.3[/C][C][/C][C][/C][/ROW]
[ROW][C]Midrange[/C][C]17511.3[/C][C][/C][C][/C][/ROW]
[ROW][C]Midmean - Weighted Average at Xnp[/C][C]18681.7108108108[/C][C][/C][C][/C][/ROW]
[ROW][C]Midmean - Weighted Average at X(n+1)p[/C][C]18753.9083333333[/C][C][/C][C][/C][/ROW]
[ROW][C]Midmean - Empirical Distribution Function[/C][C]18681.7108108108[/C][C][/C][C][/C][/ROW]
[ROW][C]Midmean - Empirical Distribution Function - Averaging[/C][C]18753.9083333333[/C][C][/C][C][/C][/ROW]
[ROW][C]Midmean - Empirical Distribution Function - Interpolation[/C][C]18753.9083333333[/C][C][/C][C][/C][/ROW]
[ROW][C]Midmean - Closest Observation[/C][C]18681.7108108108[/C][C][/C][C][/C][/ROW]
[ROW][C]Midmean - True Basic - Statistics Graphics Toolkit[/C][C]18753.9083333333[/C][C][/C][C][/C][/ROW]
[ROW][C]Midmean - MS Excel (old versions)[/C][C]18718.8184210526[/C][C][/C][C][/C][/ROW]
[ROW][C]Number of observations[/C][C]72[/C][C][/C][C][/C][/ROW]
[/TABLE]
Source: https://freestatistics.org/blog/index.php?pk=239975&T=1

Globally Unique Identifier (entire table): ba.freestatistics.org/blog/index.php?pk=239975&T=1

As an alternative you can also use a QR Code:  

The GUIDs for individual cells are displayed in the table below:

Central Tendency - Ungrouped Data
MeasureValueS.E.Value/S.E.
Arithmetic Mean18334.0444444444282.144342386864.9810812768656
Geometric Mean18169.7827404376
Harmonic Mean17995.2410692173
Quadratic Mean18487.5409726839
Winsorized Mean ( 1 / 24 )18344.4097222222277.55559392618566.0927400623778
Winsorized Mean ( 2 / 24 )18339.0763888889275.77591004403366.4999215702369
Winsorized Mean ( 3 / 24 )18333.3513888889268.29444538576568.3329517408696
Winsorized Mean ( 4 / 24 )18334.5958333333265.35267344522669.0951992127488
Winsorized Mean ( 5 / 24 )18335.4916666667262.29767985813269.9033696240992
Winsorized Mean ( 6 / 24 )18360.5333333333250.25636436057673.3668987010416
Winsorized Mean ( 7 / 24 )18360.7375249.56861802605173.5698969094079
Winsorized Mean ( 8 / 24 )18365.8930555556241.87176873108175.9323551975807
Winsorized Mean ( 9 / 24 )18398.7055555556234.39010923975578.4960833681582
Winsorized Mean ( 10 / 24 )18384.6361111111230.19170812489879.8666305614097
Winsorized Mean ( 11 / 24 )18392.1375217.01880454820884.7490499189181
Winsorized Mean ( 12 / 24 )18398.4875212.0454055383686.7667349513575
Winsorized Mean ( 13 / 24 )18391.1930555556210.37606380278187.4205587989162
Winsorized Mean ( 14 / 24 )18427.5152777778203.42633438125890.5856920335655
Winsorized Mean ( 15 / 24 )18412.3902777778201.02206334072991.5938776659011
Winsorized Mean ( 16 / 24 )18389.0569444444198.07574267184192.8385106444366
Winsorized Mean ( 17 / 24 )18420.5541666667190.25030581120796.8227309182152
Winsorized Mean ( 18 / 24 )18486.9791666667168.886375253406109.464005837817
Winsorized Mean ( 19 / 24 )18575.5930555556152.338659815425121.936172197273
Winsorized Mean ( 20 / 24 )18625.1486111111139.324935192818133.681372866493
Winsorized Mean ( 21 / 24 )18627.8902777778138.615247161122134.385579215
Winsorized Mean ( 22 / 24 )18706.9986111111123.356923427445151.649360987136
Winsorized Mean ( 23 / 24 )18720.0319444444113.39907244576165.080997054879
Winsorized Mean ( 24 / 24 )18732.1319444444102.696350634251182.40309250285
Trimmed Mean ( 1 / 24 )18357.5514285714271.11496901000467.7113163305049
Trimmed Mean ( 2 / 24 )18371.4661764706263.44564509119669.7353192918068
Trimmed Mean ( 3 / 24 )18389.1333333333255.41048607648171.9983490725859
Trimmed Mean ( 4 / 24 )18410.0515625249.19591746796273.8778217137803
Trimmed Mean ( 5 / 24 )18431.9580645161242.7467882647375.9308009645629
Trimmed Mean ( 6 / 24 )18455.11235.85546585211178.2475400064374
Trimmed Mean ( 7 / 24 )18474.6775862069230.89688447135780.0126759116091
Trimmed Mean ( 8 / 24 )18495.6053571429224.90229691705982.2384013444014
Trimmed Mean ( 9 / 24 )18517.2240740741219.3503378919284.4184889434635
Trimmed Mean ( 10 / 24 )18535.4576923077214.19240339891286.5364849461411
Trimmed Mean ( 11 / 24 )18557.176208.55331000675988.9804913640476
Trimmed Mean ( 12 / 24 )18579.68125204.29666720915590.944612576467
Trimmed Mean ( 13 / 24 )18603.3152173913199.79278417495693.1130485728684
Trimmed Mean ( 14 / 24 )18630.0159090909194.12667680782195.9683450798164
Trimmed Mean ( 15 / 24 )18654.8119047619188.28349406434399.0783180302936
Trimmed Mean ( 16 / 24 )18683.9025180.860082784211103.305838482294
Trimmed Mean ( 17 / 24 )18718.8184210526171.273876235488109.29173107121
Trimmed Mean ( 18 / 24 )18753.9083333333160.271576432946117.013314217818
Trimmed Mean ( 19 / 24 )18785.3117647059151.477352617073124.013995756806
Trimmed Mean ( 20 / 24 )18810.146875144.347053710866130.311955744366
Trimmed Mean ( 21 / 24 )18832.3466666667138.145752010214136.322300125988
Trimmed Mean ( 22 / 24 )18857.3821428571128.872682963131146.325673597189
Trimmed Mean ( 23 / 24 )18876.3115384615120.94055301637156.079256028427
Trimmed Mean ( 24 / 24 )18896.6958333333112.418278930301168.092733789753
Median19054.3
Midrange17511.3
Midmean - Weighted Average at Xnp18681.7108108108
Midmean - Weighted Average at X(n+1)p18753.9083333333
Midmean - Empirical Distribution Function18681.7108108108
Midmean - Empirical Distribution Function - Averaging18753.9083333333
Midmean - Empirical Distribution Function - Interpolation18753.9083333333
Midmean - Closest Observation18681.7108108108
Midmean - True Basic - Statistics Graphics Toolkit18753.9083333333
Midmean - MS Excel (old versions)18718.8184210526
Number of observations72


Parameters (Session):
Parameters (R input):
R code (references can be found in the software module):
geomean <- function(x) {
return(exp(mean(log(x))))
}
harmean <- function(x) {
return(1/mean(1/x))
}
quamean <- function(x) {
return(sqrt(mean(x*x)))
}
winmean <- function(x) {
x <-sort(x[!is.na(x)])
n<-length(x)
denom <- 3
nodenom <- n/denom
if (nodenom>40) denom <- n/40
sqrtn = sqrt(n)
roundnodenom = floor(nodenom)
win <- array(NA,dim=c(roundnodenom,2))
for (j in 1:roundnodenom) {
win[j,1] <- (j*x[j+1]+sum(x[(j+1):(n-j)])+j*x[n-j])/n
win[j,2] <- sd(c(rep(x[j+1],j),x[(j+1):(n-j)],rep(x[n-j],j)))/sqrtn
}
return(win)
}
trimean <- function(x) {
x <-sort(x[!is.na(x)])
n<-length(x)
denom <- 3
nodenom <- n/denom
if (nodenom>40) denom <- n/40
sqrtn = sqrt(n)
roundnodenom = floor(nodenom)
tri <- array(NA,dim=c(roundnodenom,2))
for (j in 1:roundnodenom) {
tri[j,1] <- mean(x,trim=j/n)
tri[j,2] <- sd(x[(j+1):(n-j)]) / sqrt(n-j*2)
}
return(tri)
}
midrange <- function(x) {
return((max(x)+min(x))/2)
}
q1 <- function(data,n,p,i,f) {
np <- n*p;
i <<- floor(np)
f <<- np - i
qvalue <- (1-f)*data[i] + f*data[i+1]
}
q2 <- function(data,n,p,i,f) {
np <- (n+1)*p
i <<- floor(np)
f <<- np - i
qvalue <- (1-f)*data[i] + f*data[i+1]
}
q3 <- function(data,n,p,i,f) {
np <- n*p
i <<- floor(np)
f <<- np - i
if (f==0) {
qvalue <- data[i]
} else {
qvalue <- data[i+1]
}
}
q4 <- function(data,n,p,i,f) {
np <- n*p
i <<- floor(np)
f <<- np - i
if (f==0) {
qvalue <- (data[i]+data[i+1])/2
} else {
qvalue <- data[i+1]
}
}
q5 <- function(data,n,p,i,f) {
np <- (n-1)*p
i <<- floor(np)
f <<- np - i
if (f==0) {
qvalue <- data[i+1]
} else {
qvalue <- data[i+1] + f*(data[i+2]-data[i+1])
}
}
q6 <- function(data,n,p,i,f) {
np <- n*p+0.5
i <<- floor(np)
f <<- np - i
qvalue <- data[i]
}
q7 <- function(data,n,p,i,f) {
np <- (n+1)*p
i <<- floor(np)
f <<- np - i
if (f==0) {
qvalue <- data[i]
} else {
qvalue <- f*data[i] + (1-f)*data[i+1]
}
}
q8 <- function(data,n,p,i,f) {
np <- (n+1)*p
i <<- floor(np)
f <<- np - i
if (f==0) {
qvalue <- data[i]
} else {
if (f == 0.5) {
qvalue <- (data[i]+data[i+1])/2
} else {
if (f < 0.5) {
qvalue <- data[i]
} else {
qvalue <- data[i+1]
}
}
}
}
midmean <- function(x,def) {
x <-sort(x[!is.na(x)])
n<-length(x)
if (def==1) {
qvalue1 <- q1(x,n,0.25,i,f)
qvalue3 <- q1(x,n,0.75,i,f)
}
if (def==2) {
qvalue1 <- q2(x,n,0.25,i,f)
qvalue3 <- q2(x,n,0.75,i,f)
}
if (def==3) {
qvalue1 <- q3(x,n,0.25,i,f)
qvalue3 <- q3(x,n,0.75,i,f)
}
if (def==4) {
qvalue1 <- q4(x,n,0.25,i,f)
qvalue3 <- q4(x,n,0.75,i,f)
}
if (def==5) {
qvalue1 <- q5(x,n,0.25,i,f)
qvalue3 <- q5(x,n,0.75,i,f)
}
if (def==6) {
qvalue1 <- q6(x,n,0.25,i,f)
qvalue3 <- q6(x,n,0.75,i,f)
}
if (def==7) {
qvalue1 <- q7(x,n,0.25,i,f)
qvalue3 <- q7(x,n,0.75,i,f)
}
if (def==8) {
qvalue1 <- q8(x,n,0.25,i,f)
qvalue3 <- q8(x,n,0.75,i,f)
}
midm <- 0
myn <- 0
roundno4 <- round(n/4)
round3no4 <- round(3*n/4)
for (i in 1:n) {
if ((x[i]>=qvalue1) & (x[i]<=qvalue3)){
midm = midm + x[i]
myn = myn + 1
}
}
midm = midm / myn
return(midm)
}
(arm <- mean(x))
sqrtn <- sqrt(length(x))
(armse <- sd(x) / sqrtn)
(armose <- arm / armse)
(geo <- geomean(x))
(har <- harmean(x))
(qua <- quamean(x))
(win <- winmean(x))
(tri <- trimean(x))
(midr <- midrange(x))
midm <- array(NA,dim=8)
for (j in 1:8) midm[j] <- midmean(x,j)
midm
bitmap(file='test1.png')
lb <- win[,1] - 2*win[,2]
ub <- win[,1] + 2*win[,2]
if ((ylimmin == '') | (ylimmax == '')) plot(win[,1],type='b',main=main, xlab='j', pch=19, ylab='Winsorized Mean(j/n)', ylim=c(min(lb),max(ub))) else plot(win[,1],type='l',main=main, xlab='j', pch=19, ylab='Winsorized Mean(j/n)', ylim=c(ylimmin,ylimmax))
lines(ub,lty=3)
lines(lb,lty=3)
grid()
dev.off()
bitmap(file='test2.png')
lb <- tri[,1] - 2*tri[,2]
ub <- tri[,1] + 2*tri[,2]
if ((ylimmin == '') | (ylimmax == '')) plot(tri[,1],type='b',main=main, xlab='j', pch=19, ylab='Trimmed Mean(j/n)', ylim=c(min(lb),max(ub))) else plot(tri[,1],type='l',main=main, xlab='j', pch=19, ylab='Trimmed Mean(j/n)', ylim=c(ylimmin,ylimmax))
lines(ub,lty=3)
lines(lb,lty=3)
grid()
dev.off()
load(file='createtable')
a<-table.start()
a<-table.row.start(a)
a<-table.element(a,'Central Tendency - Ungrouped Data',4,TRUE)
a<-table.row.end(a)
a<-table.row.start(a)
a<-table.element(a,'Measure',header=TRUE)
a<-table.element(a,'Value',header=TRUE)
a<-table.element(a,'S.E.',header=TRUE)
a<-table.element(a,'Value/S.E.',header=TRUE)
a<-table.row.end(a)
a<-table.row.start(a)
a<-table.element(a,hyperlink('arithmetic_mean.htm', 'Arithmetic Mean', 'click to view the definition of the Arithmetic Mean'),header=TRUE)
a<-table.element(a,arm)
a<-table.element(a,hyperlink('arithmetic_mean_standard_error.htm', armse, 'click to view the definition of the Standard Error of the Arithmetic Mean'))
a<-table.element(a,armose)
a<-table.row.end(a)
a<-table.row.start(a)
a<-table.element(a,hyperlink('geometric_mean.htm', 'Geometric Mean', 'click to view the definition of the Geometric Mean'),header=TRUE)
a<-table.element(a,geo)
a<-table.element(a,'')
a<-table.row.end(a)
a<-table.row.start(a)
a<-table.element(a,hyperlink('harmonic_mean.htm', 'Harmonic Mean', 'click to view the definition of the Harmonic Mean'),header=TRUE)
a<-table.element(a,har)
a<-table.element(a,'')
a<-table.row.end(a)
a<-table.row.start(a)
a<-table.element(a,hyperlink('quadratic_mean.htm', 'Quadratic Mean', 'click to view the definition of the Quadratic Mean'),header=TRUE)
a<-table.element(a,qua)
a<-table.element(a,'')
a<-table.row.end(a)
for (j in 1:length(win[,1])) {
a<-table.row.start(a)
mylabel <- paste('Winsorized Mean (',j)
mylabel <- paste(mylabel,'/')
mylabel <- paste(mylabel,length(win[,1]))
mylabel <- paste(mylabel,')')
a<-table.element(a,hyperlink('winsorized_mean.htm', mylabel, 'click to view the definition of the Winsorized Mean'),header=TRUE)
a<-table.element(a,win[j,1])
a<-table.element(a,win[j,2])
a<-table.element(a,win[j,1]/win[j,2])
a<-table.row.end(a)
}
for (j in 1:length(tri[,1])) {
a<-table.row.start(a)
mylabel <- paste('Trimmed Mean (',j)
mylabel <- paste(mylabel,'/')
mylabel <- paste(mylabel,length(tri[,1]))
mylabel <- paste(mylabel,')')
a<-table.element(a,hyperlink('arithmetic_mean.htm', mylabel, 'click to view the definition of the Trimmed Mean'),header=TRUE)
a<-table.element(a,tri[j,1])
a<-table.element(a,tri[j,2])
a<-table.element(a,tri[j,1]/tri[j,2])
a<-table.row.end(a)
}
a<-table.row.start(a)
a<-table.element(a,hyperlink('median_1.htm', 'Median', 'click to view the definition of the Median'),header=TRUE)
a<-table.element(a,median(x))
a<-table.element(a,'')
a<-table.row.end(a)
a<-table.row.start(a)
a<-table.element(a,hyperlink('midrange.htm', 'Midrange', 'click to view the definition of the Midrange'),header=TRUE)
a<-table.element(a,midr)
a<-table.element(a,'')
a<-table.row.end(a)
a<-table.row.start(a)
mymid <- hyperlink('midmean.htm', 'Midmean', 'click to view the definition of the Midmean')
mylabel <- paste(mymid,hyperlink('method_1.htm','Weighted Average at Xnp',''),sep=' - ')
a<-table.element(a,mylabel,header=TRUE)
a<-table.element(a,midm[1])
a<-table.element(a,'')
a<-table.row.end(a)
a<-table.row.start(a)
mymid <- hyperlink('midmean.htm', 'Midmean', 'click to view the definition of the Midmean')
mylabel <- paste(mymid,hyperlink('method_2.htm','Weighted Average at X(n+1)p',''),sep=' - ')
a<-table.element(a,mylabel,header=TRUE)
a<-table.element(a,midm[2])
a<-table.element(a,'')
a<-table.row.end(a)
a<-table.row.start(a)
mymid <- hyperlink('midmean.htm', 'Midmean', 'click to view the definition of the Midmean')
mylabel <- paste(mymid,hyperlink('method_3.htm','Empirical Distribution Function',''),sep=' - ')
a<-table.element(a,mylabel,header=TRUE)
a<-table.element(a,midm[3])
a<-table.element(a,'')
a<-table.row.end(a)
a<-table.row.start(a)
mymid <- hyperlink('midmean.htm', 'Midmean', 'click to view the definition of the Midmean')
mylabel <- paste(mymid,hyperlink('method_4.htm','Empirical Distribution Function - Averaging',''),sep=' - ')
a<-table.element(a,mylabel,header=TRUE)
a<-table.element(a,midm[4])
a<-table.element(a,'')
a<-table.row.end(a)
a<-table.row.start(a)
mymid <- hyperlink('midmean.htm', 'Midmean', 'click to view the definition of the Midmean')
mylabel <- paste(mymid,hyperlink('method_5.htm','Empirical Distribution Function - Interpolation',''),sep=' - ')
a<-table.element(a,mylabel,header=TRUE)
a<-table.element(a,midm[5])
a<-table.element(a,'')
a<-table.row.end(a)
a<-table.row.start(a)
mymid <- hyperlink('midmean.htm', 'Midmean', 'click to view the definition of the Midmean')
mylabel <- paste(mymid,hyperlink('method_6.htm','Closest Observation',''),sep=' - ')
a<-table.element(a,mylabel,header=TRUE)
a<-table.element(a,midm[6])
a<-table.element(a,'')
a<-table.row.end(a)
a<-table.row.start(a)
mymid <- hyperlink('midmean.htm', 'Midmean', 'click to view the definition of the Midmean')
mylabel <- paste(mymid,hyperlink('method_7.htm','True Basic - Statistics Graphics Toolkit',''),sep=' - ')
a<-table.element(a,mylabel,header=TRUE)
a<-table.element(a,midm[7])
a<-table.element(a,'')
a<-table.row.end(a)
a<-table.row.start(a)
mymid <- hyperlink('midmean.htm', 'Midmean', 'click to view the definition of the Midmean')
mylabel <- paste(mymid,hyperlink('method_8.htm','MS Excel (old versions)',''),sep=' - ')
a<-table.element(a,mylabel,header=TRUE)
a<-table.element(a,midm[8])
a<-table.element(a,'')
a<-table.row.end(a)
a<-table.row.start(a)
a<-table.element(a,'Number of observations',header=TRUE)
a<-table.element(a,length(x))
a<-table.element(a,'')
a<-table.row.end(a)
a<-table.end(a)
table.save(a,file='mytable.tab')