Free Statistics

of Irreproducible Research!

Author's title

Author*Unverified author*
R Software Modulerwasp_centraltendency.wasp
Title produced by softwareCentral Tendency
Date of computationWed, 08 Oct 2014 18:36:10 +0100
Cite this page as followsStatistical Computations at FreeStatistics.org, Office for Research Development and Education, URL https://freestatistics.org/blog/index.php?v=date/2014/Oct/08/t1412789949jmw4e8uc4po3hwx.htm/, Retrieved Sun, 12 May 2024 07:28:03 +0000
Statistical Computations at FreeStatistics.org, Office for Research Development and Education, URL https://freestatistics.org/blog/index.php?pk=239805, Retrieved Sun, 12 May 2024 07:28:03 +0000
QR Codes:

Original text written by user:
IsPrivate?No (this computation is public)
User-defined keywords
Estimated Impact52
Family? (F = Feedback message, R = changed R code, M = changed R Module, P = changed Parameters, D = changed Data)
-       [Central Tendency] [] [2014-10-08 17:36:10] [ba3f7115fe3efa85f8b130de707d46eb] [Current]
Feedback Forum

Post a new message
Dataseries X:
1143
1162
1169
1184
1169
1189
1192
1198
1168
1179
1173
1172
1125
1127
1123
1132
1114
1127
1129
1139
1117
1131
1132
1140
1105
1126
1129
1139
1123
1101
1110
1128
1101
1134
1139
1137
1141
1165
1146
1134
1141
1159
1166
1192
1171
1179
1181
1195
1167
1176
1181
1197
1194
1173
1179
1184
1193
1193
1193
1191
1222
1198
1218
1219
1260
1235
1256
1258
1295
1294
1318
1262


Summary of computational transaction
Raw Inputview raw input (R code)
Raw Outputview raw output of R engine
Computing time2 seconds
R Server'George Udny Yule' @ yule.wessa.net

\begin{tabular}{lllllllll}
\hline
Summary of computational transaction \tabularnewline
Raw Input & view raw input (R code)  \tabularnewline
Raw Output & view raw output of R engine  \tabularnewline
Computing time & 2 seconds \tabularnewline
R Server & 'George Udny Yule' @ yule.wessa.net \tabularnewline
\hline
\end{tabular}
%Source: https://freestatistics.org/blog/index.php?pk=239805&T=0

[TABLE]
[ROW][C]Summary of computational transaction[/C][/ROW]
[ROW][C]Raw Input[/C][C]view raw input (R code) [/C][/ROW]
[ROW][C]Raw Output[/C][C]view raw output of R engine [/C][/ROW]
[ROW][C]Computing time[/C][C]2 seconds[/C][/ROW]
[ROW][C]R Server[/C][C]'George Udny Yule' @ yule.wessa.net[/C][/ROW]
[/TABLE]
Source: https://freestatistics.org/blog/index.php?pk=239805&T=0

Globally Unique Identifier (entire table): ba.freestatistics.org/blog/index.php?pk=239805&T=0

As an alternative you can also use a QR Code:  

The GUIDs for individual cells are displayed in the table below:

Summary of computational transaction
Raw Inputview raw input (R code)
Raw Outputview raw output of R engine
Computing time2 seconds
R Server'George Udny Yule' @ yule.wessa.net


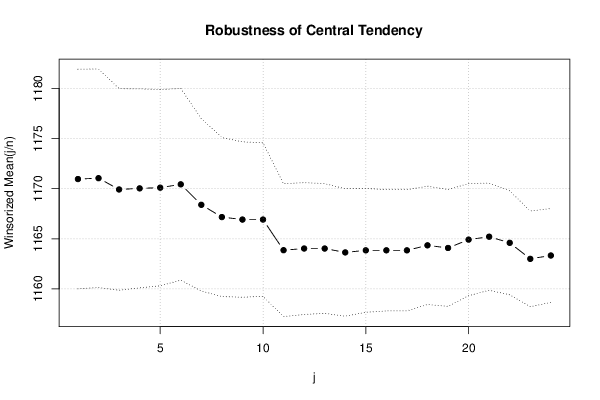
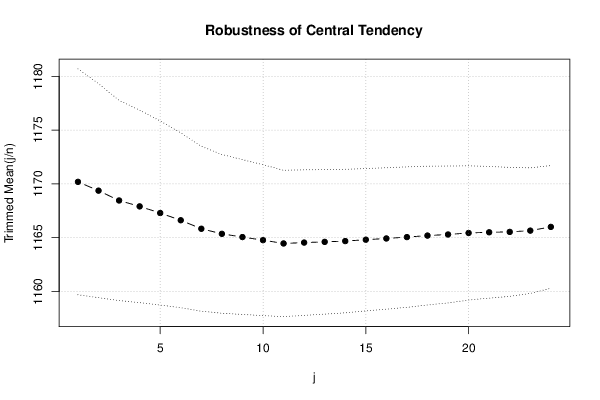
Central Tendency - Ungrouped Data
MeasureValueS.E.Value/S.E.
Arithmetic Mean1171.277777777785.58601197822747209.680498778566
Geometric Mean1170.35466016431
Harmonic Mean1169.45334185462
Quadratic Mean1172.2231371771
Winsorized Mean ( 1 / 24 )1170.958333333335.47588387260253213.83914644209
Winsorized Mean ( 2 / 24 )1171.041666666675.4475532367849214.966539245389
Winsorized Mean ( 3 / 24 )1169.916666666675.0267185181819232.739641663844
Winsorized Mean ( 4 / 24 )1170.027777777784.9618644357228235.804059730894
Winsorized Mean ( 5 / 24 )1170.097222222224.89407196753426239.084596627161
Winsorized Mean ( 6 / 24 )1170.430555555564.77878504822345244.922201719592
Winsorized Mean ( 7 / 24 )1168.388888888894.29659196183721271.933872070386
Winsorized Mean ( 8 / 24 )1167.166666666673.96433631788658294.416662229327
Winsorized Mean ( 9 / 24 )1166.916666666673.8736272746498301.246502032688
Winsorized Mean ( 10 / 24 )1166.916666666673.82688526882109304.92596059096
Winsorized Mean ( 11 / 24 )1163.861111111113.31322016151006351.277927326345
Winsorized Mean ( 12 / 24 )1164.027777777783.28729785089423354.098664184364
Winsorized Mean ( 13 / 24 )1164.027777777783.23347927059347359.992342726271
Winsorized Mean ( 14 / 24 )1163.638888888893.17852398026141366.094104092047
Winsorized Mean ( 15 / 24 )1163.847222222223.08649816780061377.076919845237
Winsorized Mean ( 16 / 24 )1163.847222222223.02297279570312385.000891796488
Winsorized Mean ( 17 / 24 )1163.847222222223.02297279570312385.000891796488
Winsorized Mean ( 18 / 24 )1164.347222222222.94963988957596394.742160335242
Winsorized Mean ( 19 / 24 )1164.083333333332.91378126894506399.509512172405
Winsorized Mean ( 20 / 24 )1164.916666666672.79452502396135416.856766956179
Winsorized Mean ( 21 / 24 )1165.208333333332.6734755722407435.840276766301
Winsorized Mean ( 22 / 24 )1164.597222222222.59141622978378449.405699029442
Winsorized Mean ( 23 / 24 )11632.38622153375116487.381403423913
Winsorized Mean ( 24 / 24 )1163.333333333332.33919451647688497.322187248224
Trimmed Mean ( 1 / 24 )1170.185714285715.24675953852772223.030178092377
Trimmed Mean ( 2 / 24 )1169.367647058824.97032035840922235.270075716626
Trimmed Mean ( 3 / 24 )1168.454545454554.6514995861641251.199537656656
Trimmed Mean ( 4 / 24 )1167.906254.47195397961935261.162403576302
Trimmed Mean ( 5 / 24 )1167.290322580654.27822614911348272.844464480338
Trimmed Mean ( 6 / 24 )1166.616666666674.06299906394242287.131906334891
Trimmed Mean ( 7 / 24 )1165.82758620693.83058803279234304.346898237725
Trimmed Mean ( 8 / 24 )1165.357142857143.6874152925713316.036315520219
Trimmed Mean ( 9 / 24 )1165.055555555563.59734515302767323.865380160978
Trimmed Mean ( 10 / 24 )1164.769230769233.50593284972328332.228049051529
Trimmed Mean ( 11 / 24 )1164.463.40062539266302342.425249929724
Trimmed Mean ( 12 / 24 )1164.541666666673.38199738673422344.335472059957
Trimmed Mean ( 13 / 24 )1164.608695652173.35852484596091346.761971123357
Trimmed Mean ( 14 / 24 )1164.681818181823.33407240829523349.327091782431
Trimmed Mean ( 15 / 24 )1164.809523809523.30754918991606352.166954118401
Trimmed Mean ( 16 / 24 )1164.9253.28582571677587354.53036783188
Trimmed Mean ( 17 / 24 )1165.052631578953.26299728875632357.049831329466
Trimmed Mean ( 18 / 24 )1165.194444444443.223874097655361.426783165009
Trimmed Mean ( 19 / 24 )1165.294117647063.18041281745313366.397126578123
Trimmed Mean ( 20 / 24 )1165.43753.1198950238233373.550228806033
Trimmed Mean ( 21 / 24 )1165.53.05909234528994380.995363475873
Trimmed Mean ( 22 / 24 )1165.535714285712.99668341488387388.941891057545
Trimmed Mean ( 23 / 24 )1165.653846153852.9178191580448399.494890881085
Trimmed Mean ( 24 / 24 )11662.850120770388409.105470938084
Median1169
Midrange1209.5
Midmean - Weighted Average at Xnp1164.925
Midmean - Weighted Average at X(n+1)p1166.65789473684
Midmean - Empirical Distribution Function1164.925
Midmean - Empirical Distribution Function - Averaging1166.65789473684
Midmean - Empirical Distribution Function - Interpolation1166.65789473684
Midmean - Closest Observation1164.925
Midmean - True Basic - Statistics Graphics Toolkit1166.65789473684
Midmean - MS Excel (old versions)1164.925
Number of observations72

\begin{tabular}{lllllllll}
\hline
Central Tendency - Ungrouped Data \tabularnewline
Measure & Value & S.E. & Value/S.E. \tabularnewline
Arithmetic Mean & 1171.27777777778 & 5.58601197822747 & 209.680498778566 \tabularnewline
Geometric Mean & 1170.35466016431 &  &  \tabularnewline
Harmonic Mean & 1169.45334185462 &  &  \tabularnewline
Quadratic Mean & 1172.2231371771 &  &  \tabularnewline
Winsorized Mean ( 1 / 24 ) & 1170.95833333333 & 5.47588387260253 & 213.83914644209 \tabularnewline
Winsorized Mean ( 2 / 24 ) & 1171.04166666667 & 5.4475532367849 & 214.966539245389 \tabularnewline
Winsorized Mean ( 3 / 24 ) & 1169.91666666667 & 5.0267185181819 & 232.739641663844 \tabularnewline
Winsorized Mean ( 4 / 24 ) & 1170.02777777778 & 4.9618644357228 & 235.804059730894 \tabularnewline
Winsorized Mean ( 5 / 24 ) & 1170.09722222222 & 4.89407196753426 & 239.084596627161 \tabularnewline
Winsorized Mean ( 6 / 24 ) & 1170.43055555556 & 4.77878504822345 & 244.922201719592 \tabularnewline
Winsorized Mean ( 7 / 24 ) & 1168.38888888889 & 4.29659196183721 & 271.933872070386 \tabularnewline
Winsorized Mean ( 8 / 24 ) & 1167.16666666667 & 3.96433631788658 & 294.416662229327 \tabularnewline
Winsorized Mean ( 9 / 24 ) & 1166.91666666667 & 3.8736272746498 & 301.246502032688 \tabularnewline
Winsorized Mean ( 10 / 24 ) & 1166.91666666667 & 3.82688526882109 & 304.92596059096 \tabularnewline
Winsorized Mean ( 11 / 24 ) & 1163.86111111111 & 3.31322016151006 & 351.277927326345 \tabularnewline
Winsorized Mean ( 12 / 24 ) & 1164.02777777778 & 3.28729785089423 & 354.098664184364 \tabularnewline
Winsorized Mean ( 13 / 24 ) & 1164.02777777778 & 3.23347927059347 & 359.992342726271 \tabularnewline
Winsorized Mean ( 14 / 24 ) & 1163.63888888889 & 3.17852398026141 & 366.094104092047 \tabularnewline
Winsorized Mean ( 15 / 24 ) & 1163.84722222222 & 3.08649816780061 & 377.076919845237 \tabularnewline
Winsorized Mean ( 16 / 24 ) & 1163.84722222222 & 3.02297279570312 & 385.000891796488 \tabularnewline
Winsorized Mean ( 17 / 24 ) & 1163.84722222222 & 3.02297279570312 & 385.000891796488 \tabularnewline
Winsorized Mean ( 18 / 24 ) & 1164.34722222222 & 2.94963988957596 & 394.742160335242 \tabularnewline
Winsorized Mean ( 19 / 24 ) & 1164.08333333333 & 2.91378126894506 & 399.509512172405 \tabularnewline
Winsorized Mean ( 20 / 24 ) & 1164.91666666667 & 2.79452502396135 & 416.856766956179 \tabularnewline
Winsorized Mean ( 21 / 24 ) & 1165.20833333333 & 2.6734755722407 & 435.840276766301 \tabularnewline
Winsorized Mean ( 22 / 24 ) & 1164.59722222222 & 2.59141622978378 & 449.405699029442 \tabularnewline
Winsorized Mean ( 23 / 24 ) & 1163 & 2.38622153375116 & 487.381403423913 \tabularnewline
Winsorized Mean ( 24 / 24 ) & 1163.33333333333 & 2.33919451647688 & 497.322187248224 \tabularnewline
Trimmed Mean ( 1 / 24 ) & 1170.18571428571 & 5.24675953852772 & 223.030178092377 \tabularnewline
Trimmed Mean ( 2 / 24 ) & 1169.36764705882 & 4.97032035840922 & 235.270075716626 \tabularnewline
Trimmed Mean ( 3 / 24 ) & 1168.45454545455 & 4.6514995861641 & 251.199537656656 \tabularnewline
Trimmed Mean ( 4 / 24 ) & 1167.90625 & 4.47195397961935 & 261.162403576302 \tabularnewline
Trimmed Mean ( 5 / 24 ) & 1167.29032258065 & 4.27822614911348 & 272.844464480338 \tabularnewline
Trimmed Mean ( 6 / 24 ) & 1166.61666666667 & 4.06299906394242 & 287.131906334891 \tabularnewline
Trimmed Mean ( 7 / 24 ) & 1165.8275862069 & 3.83058803279234 & 304.346898237725 \tabularnewline
Trimmed Mean ( 8 / 24 ) & 1165.35714285714 & 3.6874152925713 & 316.036315520219 \tabularnewline
Trimmed Mean ( 9 / 24 ) & 1165.05555555556 & 3.59734515302767 & 323.865380160978 \tabularnewline
Trimmed Mean ( 10 / 24 ) & 1164.76923076923 & 3.50593284972328 & 332.228049051529 \tabularnewline
Trimmed Mean ( 11 / 24 ) & 1164.46 & 3.40062539266302 & 342.425249929724 \tabularnewline
Trimmed Mean ( 12 / 24 ) & 1164.54166666667 & 3.38199738673422 & 344.335472059957 \tabularnewline
Trimmed Mean ( 13 / 24 ) & 1164.60869565217 & 3.35852484596091 & 346.761971123357 \tabularnewline
Trimmed Mean ( 14 / 24 ) & 1164.68181818182 & 3.33407240829523 & 349.327091782431 \tabularnewline
Trimmed Mean ( 15 / 24 ) & 1164.80952380952 & 3.30754918991606 & 352.166954118401 \tabularnewline
Trimmed Mean ( 16 / 24 ) & 1164.925 & 3.28582571677587 & 354.53036783188 \tabularnewline
Trimmed Mean ( 17 / 24 ) & 1165.05263157895 & 3.26299728875632 & 357.049831329466 \tabularnewline
Trimmed Mean ( 18 / 24 ) & 1165.19444444444 & 3.223874097655 & 361.426783165009 \tabularnewline
Trimmed Mean ( 19 / 24 ) & 1165.29411764706 & 3.18041281745313 & 366.397126578123 \tabularnewline
Trimmed Mean ( 20 / 24 ) & 1165.4375 & 3.1198950238233 & 373.550228806033 \tabularnewline
Trimmed Mean ( 21 / 24 ) & 1165.5 & 3.05909234528994 & 380.995363475873 \tabularnewline
Trimmed Mean ( 22 / 24 ) & 1165.53571428571 & 2.99668341488387 & 388.941891057545 \tabularnewline
Trimmed Mean ( 23 / 24 ) & 1165.65384615385 & 2.9178191580448 & 399.494890881085 \tabularnewline
Trimmed Mean ( 24 / 24 ) & 1166 & 2.850120770388 & 409.105470938084 \tabularnewline
Median & 1169 &  &  \tabularnewline
Midrange & 1209.5 &  &  \tabularnewline
Midmean - Weighted Average at Xnp & 1164.925 &  &  \tabularnewline
Midmean - Weighted Average at X(n+1)p & 1166.65789473684 &  &  \tabularnewline
Midmean - Empirical Distribution Function & 1164.925 &  &  \tabularnewline
Midmean - Empirical Distribution Function - Averaging & 1166.65789473684 &  &  \tabularnewline
Midmean - Empirical Distribution Function - Interpolation & 1166.65789473684 &  &  \tabularnewline
Midmean - Closest Observation & 1164.925 &  &  \tabularnewline
Midmean - True Basic - Statistics Graphics Toolkit & 1166.65789473684 &  &  \tabularnewline
Midmean - MS Excel (old versions) & 1164.925 &  &  \tabularnewline
Number of observations & 72 &  &  \tabularnewline
\hline
\end{tabular}
%Source: https://freestatistics.org/blog/index.php?pk=239805&T=1

[TABLE]
[ROW][C]Central Tendency - Ungrouped Data[/C][/ROW]
[ROW][C]Measure[/C][C]Value[/C][C]S.E.[/C][C]Value/S.E.[/C][/ROW]
[ROW][C]Arithmetic Mean[/C][C]1171.27777777778[/C][C]5.58601197822747[/C][C]209.680498778566[/C][/ROW]
[ROW][C]Geometric Mean[/C][C]1170.35466016431[/C][C][/C][C][/C][/ROW]
[ROW][C]Harmonic Mean[/C][C]1169.45334185462[/C][C][/C][C][/C][/ROW]
[ROW][C]Quadratic Mean[/C][C]1172.2231371771[/C][C][/C][C][/C][/ROW]
[ROW][C]Winsorized Mean ( 1 / 24 )[/C][C]1170.95833333333[/C][C]5.47588387260253[/C][C]213.83914644209[/C][/ROW]
[ROW][C]Winsorized Mean ( 2 / 24 )[/C][C]1171.04166666667[/C][C]5.4475532367849[/C][C]214.966539245389[/C][/ROW]
[ROW][C]Winsorized Mean ( 3 / 24 )[/C][C]1169.91666666667[/C][C]5.0267185181819[/C][C]232.739641663844[/C][/ROW]
[ROW][C]Winsorized Mean ( 4 / 24 )[/C][C]1170.02777777778[/C][C]4.9618644357228[/C][C]235.804059730894[/C][/ROW]
[ROW][C]Winsorized Mean ( 5 / 24 )[/C][C]1170.09722222222[/C][C]4.89407196753426[/C][C]239.084596627161[/C][/ROW]
[ROW][C]Winsorized Mean ( 6 / 24 )[/C][C]1170.43055555556[/C][C]4.77878504822345[/C][C]244.922201719592[/C][/ROW]
[ROW][C]Winsorized Mean ( 7 / 24 )[/C][C]1168.38888888889[/C][C]4.29659196183721[/C][C]271.933872070386[/C][/ROW]
[ROW][C]Winsorized Mean ( 8 / 24 )[/C][C]1167.16666666667[/C][C]3.96433631788658[/C][C]294.416662229327[/C][/ROW]
[ROW][C]Winsorized Mean ( 9 / 24 )[/C][C]1166.91666666667[/C][C]3.8736272746498[/C][C]301.246502032688[/C][/ROW]
[ROW][C]Winsorized Mean ( 10 / 24 )[/C][C]1166.91666666667[/C][C]3.82688526882109[/C][C]304.92596059096[/C][/ROW]
[ROW][C]Winsorized Mean ( 11 / 24 )[/C][C]1163.86111111111[/C][C]3.31322016151006[/C][C]351.277927326345[/C][/ROW]
[ROW][C]Winsorized Mean ( 12 / 24 )[/C][C]1164.02777777778[/C][C]3.28729785089423[/C][C]354.098664184364[/C][/ROW]
[ROW][C]Winsorized Mean ( 13 / 24 )[/C][C]1164.02777777778[/C][C]3.23347927059347[/C][C]359.992342726271[/C][/ROW]
[ROW][C]Winsorized Mean ( 14 / 24 )[/C][C]1163.63888888889[/C][C]3.17852398026141[/C][C]366.094104092047[/C][/ROW]
[ROW][C]Winsorized Mean ( 15 / 24 )[/C][C]1163.84722222222[/C][C]3.08649816780061[/C][C]377.076919845237[/C][/ROW]
[ROW][C]Winsorized Mean ( 16 / 24 )[/C][C]1163.84722222222[/C][C]3.02297279570312[/C][C]385.000891796488[/C][/ROW]
[ROW][C]Winsorized Mean ( 17 / 24 )[/C][C]1163.84722222222[/C][C]3.02297279570312[/C][C]385.000891796488[/C][/ROW]
[ROW][C]Winsorized Mean ( 18 / 24 )[/C][C]1164.34722222222[/C][C]2.94963988957596[/C][C]394.742160335242[/C][/ROW]
[ROW][C]Winsorized Mean ( 19 / 24 )[/C][C]1164.08333333333[/C][C]2.91378126894506[/C][C]399.509512172405[/C][/ROW]
[ROW][C]Winsorized Mean ( 20 / 24 )[/C][C]1164.91666666667[/C][C]2.79452502396135[/C][C]416.856766956179[/C][/ROW]
[ROW][C]Winsorized Mean ( 21 / 24 )[/C][C]1165.20833333333[/C][C]2.6734755722407[/C][C]435.840276766301[/C][/ROW]
[ROW][C]Winsorized Mean ( 22 / 24 )[/C][C]1164.59722222222[/C][C]2.59141622978378[/C][C]449.405699029442[/C][/ROW]
[ROW][C]Winsorized Mean ( 23 / 24 )[/C][C]1163[/C][C]2.38622153375116[/C][C]487.381403423913[/C][/ROW]
[ROW][C]Winsorized Mean ( 24 / 24 )[/C][C]1163.33333333333[/C][C]2.33919451647688[/C][C]497.322187248224[/C][/ROW]
[ROW][C]Trimmed Mean ( 1 / 24 )[/C][C]1170.18571428571[/C][C]5.24675953852772[/C][C]223.030178092377[/C][/ROW]
[ROW][C]Trimmed Mean ( 2 / 24 )[/C][C]1169.36764705882[/C][C]4.97032035840922[/C][C]235.270075716626[/C][/ROW]
[ROW][C]Trimmed Mean ( 3 / 24 )[/C][C]1168.45454545455[/C][C]4.6514995861641[/C][C]251.199537656656[/C][/ROW]
[ROW][C]Trimmed Mean ( 4 / 24 )[/C][C]1167.90625[/C][C]4.47195397961935[/C][C]261.162403576302[/C][/ROW]
[ROW][C]Trimmed Mean ( 5 / 24 )[/C][C]1167.29032258065[/C][C]4.27822614911348[/C][C]272.844464480338[/C][/ROW]
[ROW][C]Trimmed Mean ( 6 / 24 )[/C][C]1166.61666666667[/C][C]4.06299906394242[/C][C]287.131906334891[/C][/ROW]
[ROW][C]Trimmed Mean ( 7 / 24 )[/C][C]1165.8275862069[/C][C]3.83058803279234[/C][C]304.346898237725[/C][/ROW]
[ROW][C]Trimmed Mean ( 8 / 24 )[/C][C]1165.35714285714[/C][C]3.6874152925713[/C][C]316.036315520219[/C][/ROW]
[ROW][C]Trimmed Mean ( 9 / 24 )[/C][C]1165.05555555556[/C][C]3.59734515302767[/C][C]323.865380160978[/C][/ROW]
[ROW][C]Trimmed Mean ( 10 / 24 )[/C][C]1164.76923076923[/C][C]3.50593284972328[/C][C]332.228049051529[/C][/ROW]
[ROW][C]Trimmed Mean ( 11 / 24 )[/C][C]1164.46[/C][C]3.40062539266302[/C][C]342.425249929724[/C][/ROW]
[ROW][C]Trimmed Mean ( 12 / 24 )[/C][C]1164.54166666667[/C][C]3.38199738673422[/C][C]344.335472059957[/C][/ROW]
[ROW][C]Trimmed Mean ( 13 / 24 )[/C][C]1164.60869565217[/C][C]3.35852484596091[/C][C]346.761971123357[/C][/ROW]
[ROW][C]Trimmed Mean ( 14 / 24 )[/C][C]1164.68181818182[/C][C]3.33407240829523[/C][C]349.327091782431[/C][/ROW]
[ROW][C]Trimmed Mean ( 15 / 24 )[/C][C]1164.80952380952[/C][C]3.30754918991606[/C][C]352.166954118401[/C][/ROW]
[ROW][C]Trimmed Mean ( 16 / 24 )[/C][C]1164.925[/C][C]3.28582571677587[/C][C]354.53036783188[/C][/ROW]
[ROW][C]Trimmed Mean ( 17 / 24 )[/C][C]1165.05263157895[/C][C]3.26299728875632[/C][C]357.049831329466[/C][/ROW]
[ROW][C]Trimmed Mean ( 18 / 24 )[/C][C]1165.19444444444[/C][C]3.223874097655[/C][C]361.426783165009[/C][/ROW]
[ROW][C]Trimmed Mean ( 19 / 24 )[/C][C]1165.29411764706[/C][C]3.18041281745313[/C][C]366.397126578123[/C][/ROW]
[ROW][C]Trimmed Mean ( 20 / 24 )[/C][C]1165.4375[/C][C]3.1198950238233[/C][C]373.550228806033[/C][/ROW]
[ROW][C]Trimmed Mean ( 21 / 24 )[/C][C]1165.5[/C][C]3.05909234528994[/C][C]380.995363475873[/C][/ROW]
[ROW][C]Trimmed Mean ( 22 / 24 )[/C][C]1165.53571428571[/C][C]2.99668341488387[/C][C]388.941891057545[/C][/ROW]
[ROW][C]Trimmed Mean ( 23 / 24 )[/C][C]1165.65384615385[/C][C]2.9178191580448[/C][C]399.494890881085[/C][/ROW]
[ROW][C]Trimmed Mean ( 24 / 24 )[/C][C]1166[/C][C]2.850120770388[/C][C]409.105470938084[/C][/ROW]
[ROW][C]Median[/C][C]1169[/C][C][/C][C][/C][/ROW]
[ROW][C]Midrange[/C][C]1209.5[/C][C][/C][C][/C][/ROW]
[ROW][C]Midmean - Weighted Average at Xnp[/C][C]1164.925[/C][C][/C][C][/C][/ROW]
[ROW][C]Midmean - Weighted Average at X(n+1)p[/C][C]1166.65789473684[/C][C][/C][C][/C][/ROW]
[ROW][C]Midmean - Empirical Distribution Function[/C][C]1164.925[/C][C][/C][C][/C][/ROW]
[ROW][C]Midmean - Empirical Distribution Function - Averaging[/C][C]1166.65789473684[/C][C][/C][C][/C][/ROW]
[ROW][C]Midmean - Empirical Distribution Function - Interpolation[/C][C]1166.65789473684[/C][C][/C][C][/C][/ROW]
[ROW][C]Midmean - Closest Observation[/C][C]1164.925[/C][C][/C][C][/C][/ROW]
[ROW][C]Midmean - True Basic - Statistics Graphics Toolkit[/C][C]1166.65789473684[/C][C][/C][C][/C][/ROW]
[ROW][C]Midmean - MS Excel (old versions)[/C][C]1164.925[/C][C][/C][C][/C][/ROW]
[ROW][C]Number of observations[/C][C]72[/C][C][/C][C][/C][/ROW]
[/TABLE]
Source: https://freestatistics.org/blog/index.php?pk=239805&T=1

Globally Unique Identifier (entire table): ba.freestatistics.org/blog/index.php?pk=239805&T=1

As an alternative you can also use a QR Code:  

The GUIDs for individual cells are displayed in the table below:

Central Tendency - Ungrouped Data
MeasureValueS.E.Value/S.E.
Arithmetic Mean1171.277777777785.58601197822747209.680498778566
Geometric Mean1170.35466016431
Harmonic Mean1169.45334185462
Quadratic Mean1172.2231371771
Winsorized Mean ( 1 / 24 )1170.958333333335.47588387260253213.83914644209
Winsorized Mean ( 2 / 24 )1171.041666666675.4475532367849214.966539245389
Winsorized Mean ( 3 / 24 )1169.916666666675.0267185181819232.739641663844
Winsorized Mean ( 4 / 24 )1170.027777777784.9618644357228235.804059730894
Winsorized Mean ( 5 / 24 )1170.097222222224.89407196753426239.084596627161
Winsorized Mean ( 6 / 24 )1170.430555555564.77878504822345244.922201719592
Winsorized Mean ( 7 / 24 )1168.388888888894.29659196183721271.933872070386
Winsorized Mean ( 8 / 24 )1167.166666666673.96433631788658294.416662229327
Winsorized Mean ( 9 / 24 )1166.916666666673.8736272746498301.246502032688
Winsorized Mean ( 10 / 24 )1166.916666666673.82688526882109304.92596059096
Winsorized Mean ( 11 / 24 )1163.861111111113.31322016151006351.277927326345
Winsorized Mean ( 12 / 24 )1164.027777777783.28729785089423354.098664184364
Winsorized Mean ( 13 / 24 )1164.027777777783.23347927059347359.992342726271
Winsorized Mean ( 14 / 24 )1163.638888888893.17852398026141366.094104092047
Winsorized Mean ( 15 / 24 )1163.847222222223.08649816780061377.076919845237
Winsorized Mean ( 16 / 24 )1163.847222222223.02297279570312385.000891796488
Winsorized Mean ( 17 / 24 )1163.847222222223.02297279570312385.000891796488
Winsorized Mean ( 18 / 24 )1164.347222222222.94963988957596394.742160335242
Winsorized Mean ( 19 / 24 )1164.083333333332.91378126894506399.509512172405
Winsorized Mean ( 20 / 24 )1164.916666666672.79452502396135416.856766956179
Winsorized Mean ( 21 / 24 )1165.208333333332.6734755722407435.840276766301
Winsorized Mean ( 22 / 24 )1164.597222222222.59141622978378449.405699029442
Winsorized Mean ( 23 / 24 )11632.38622153375116487.381403423913
Winsorized Mean ( 24 / 24 )1163.333333333332.33919451647688497.322187248224
Trimmed Mean ( 1 / 24 )1170.185714285715.24675953852772223.030178092377
Trimmed Mean ( 2 / 24 )1169.367647058824.97032035840922235.270075716626
Trimmed Mean ( 3 / 24 )1168.454545454554.6514995861641251.199537656656
Trimmed Mean ( 4 / 24 )1167.906254.47195397961935261.162403576302
Trimmed Mean ( 5 / 24 )1167.290322580654.27822614911348272.844464480338
Trimmed Mean ( 6 / 24 )1166.616666666674.06299906394242287.131906334891
Trimmed Mean ( 7 / 24 )1165.82758620693.83058803279234304.346898237725
Trimmed Mean ( 8 / 24 )1165.357142857143.6874152925713316.036315520219
Trimmed Mean ( 9 / 24 )1165.055555555563.59734515302767323.865380160978
Trimmed Mean ( 10 / 24 )1164.769230769233.50593284972328332.228049051529
Trimmed Mean ( 11 / 24 )1164.463.40062539266302342.425249929724
Trimmed Mean ( 12 / 24 )1164.541666666673.38199738673422344.335472059957
Trimmed Mean ( 13 / 24 )1164.608695652173.35852484596091346.761971123357
Trimmed Mean ( 14 / 24 )1164.681818181823.33407240829523349.327091782431
Trimmed Mean ( 15 / 24 )1164.809523809523.30754918991606352.166954118401
Trimmed Mean ( 16 / 24 )1164.9253.28582571677587354.53036783188
Trimmed Mean ( 17 / 24 )1165.052631578953.26299728875632357.049831329466
Trimmed Mean ( 18 / 24 )1165.194444444443.223874097655361.426783165009
Trimmed Mean ( 19 / 24 )1165.294117647063.18041281745313366.397126578123
Trimmed Mean ( 20 / 24 )1165.43753.1198950238233373.550228806033
Trimmed Mean ( 21 / 24 )1165.53.05909234528994380.995363475873
Trimmed Mean ( 22 / 24 )1165.535714285712.99668341488387388.941891057545
Trimmed Mean ( 23 / 24 )1165.653846153852.9178191580448399.494890881085
Trimmed Mean ( 24 / 24 )11662.850120770388409.105470938084
Median1169
Midrange1209.5
Midmean - Weighted Average at Xnp1164.925
Midmean - Weighted Average at X(n+1)p1166.65789473684
Midmean - Empirical Distribution Function1164.925
Midmean - Empirical Distribution Function - Averaging1166.65789473684
Midmean - Empirical Distribution Function - Interpolation1166.65789473684
Midmean - Closest Observation1164.925
Midmean - True Basic - Statistics Graphics Toolkit1166.65789473684
Midmean - MS Excel (old versions)1164.925
Number of observations72


Parameters (Session):
Parameters (R input):
R code (references can be found in the software module):
geomean <- function(x) {
return(exp(mean(log(x))))
}
harmean <- function(x) {
return(1/mean(1/x))
}
quamean <- function(x) {
return(sqrt(mean(x*x)))
}
winmean <- function(x) {
x <-sort(x[!is.na(x)])
n<-length(x)
denom <- 3
nodenom <- n/denom
if (nodenom>40) denom <- n/40
sqrtn = sqrt(n)
roundnodenom = floor(nodenom)
win <- array(NA,dim=c(roundnodenom,2))
for (j in 1:roundnodenom) {
win[j,1] <- (j*x[j+1]+sum(x[(j+1):(n-j)])+j*x[n-j])/n
win[j,2] <- sd(c(rep(x[j+1],j),x[(j+1):(n-j)],rep(x[n-j],j)))/sqrtn
}
return(win)
}
trimean <- function(x) {
x <-sort(x[!is.na(x)])
n<-length(x)
denom <- 3
nodenom <- n/denom
if (nodenom>40) denom <- n/40
sqrtn = sqrt(n)
roundnodenom = floor(nodenom)
tri <- array(NA,dim=c(roundnodenom,2))
for (j in 1:roundnodenom) {
tri[j,1] <- mean(x,trim=j/n)
tri[j,2] <- sd(x[(j+1):(n-j)]) / sqrt(n-j*2)
}
return(tri)
}
midrange <- function(x) {
return((max(x)+min(x))/2)
}
q1 <- function(data,n,p,i,f) {
np <- n*p;
i <<- floor(np)
f <<- np - i
qvalue <- (1-f)*data[i] + f*data[i+1]
}
q2 <- function(data,n,p,i,f) {
np <- (n+1)*p
i <<- floor(np)
f <<- np - i
qvalue <- (1-f)*data[i] + f*data[i+1]
}
q3 <- function(data,n,p,i,f) {
np <- n*p
i <<- floor(np)
f <<- np - i
if (f==0) {
qvalue <- data[i]
} else {
qvalue <- data[i+1]
}
}
q4 <- function(data,n,p,i,f) {
np <- n*p
i <<- floor(np)
f <<- np - i
if (f==0) {
qvalue <- (data[i]+data[i+1])/2
} else {
qvalue <- data[i+1]
}
}
q5 <- function(data,n,p,i,f) {
np <- (n-1)*p
i <<- floor(np)
f <<- np - i
if (f==0) {
qvalue <- data[i+1]
} else {
qvalue <- data[i+1] + f*(data[i+2]-data[i+1])
}
}
q6 <- function(data,n,p,i,f) {
np <- n*p+0.5
i <<- floor(np)
f <<- np - i
qvalue <- data[i]
}
q7 <- function(data,n,p,i,f) {
np <- (n+1)*p
i <<- floor(np)
f <<- np - i
if (f==0) {
qvalue <- data[i]
} else {
qvalue <- f*data[i] + (1-f)*data[i+1]
}
}
q8 <- function(data,n,p,i,f) {
np <- (n+1)*p
i <<- floor(np)
f <<- np - i
if (f==0) {
qvalue <- data[i]
} else {
if (f == 0.5) {
qvalue <- (data[i]+data[i+1])/2
} else {
if (f < 0.5) {
qvalue <- data[i]
} else {
qvalue <- data[i+1]
}
}
}
}
midmean <- function(x,def) {
x <-sort(x[!is.na(x)])
n<-length(x)
if (def==1) {
qvalue1 <- q1(x,n,0.25,i,f)
qvalue3 <- q1(x,n,0.75,i,f)
}
if (def==2) {
qvalue1 <- q2(x,n,0.25,i,f)
qvalue3 <- q2(x,n,0.75,i,f)
}
if (def==3) {
qvalue1 <- q3(x,n,0.25,i,f)
qvalue3 <- q3(x,n,0.75,i,f)
}
if (def==4) {
qvalue1 <- q4(x,n,0.25,i,f)
qvalue3 <- q4(x,n,0.75,i,f)
}
if (def==5) {
qvalue1 <- q5(x,n,0.25,i,f)
qvalue3 <- q5(x,n,0.75,i,f)
}
if (def==6) {
qvalue1 <- q6(x,n,0.25,i,f)
qvalue3 <- q6(x,n,0.75,i,f)
}
if (def==7) {
qvalue1 <- q7(x,n,0.25,i,f)
qvalue3 <- q7(x,n,0.75,i,f)
}
if (def==8) {
qvalue1 <- q8(x,n,0.25,i,f)
qvalue3 <- q8(x,n,0.75,i,f)
}
midm <- 0
myn <- 0
roundno4 <- round(n/4)
round3no4 <- round(3*n/4)
for (i in 1:n) {
if ((x[i]>=qvalue1) & (x[i]<=qvalue3)){
midm = midm + x[i]
myn = myn + 1
}
}
midm = midm / myn
return(midm)
}
(arm <- mean(x))
sqrtn <- sqrt(length(x))
(armse <- sd(x) / sqrtn)
(armose <- arm / armse)
(geo <- geomean(x))
(har <- harmean(x))
(qua <- quamean(x))
(win <- winmean(x))
(tri <- trimean(x))
(midr <- midrange(x))
midm <- array(NA,dim=8)
for (j in 1:8) midm[j] <- midmean(x,j)
midm
bitmap(file='test1.png')
lb <- win[,1] - 2*win[,2]
ub <- win[,1] + 2*win[,2]
if ((ylimmin == '') | (ylimmax == '')) plot(win[,1],type='b',main=main, xlab='j', pch=19, ylab='Winsorized Mean(j/n)', ylim=c(min(lb),max(ub))) else plot(win[,1],type='l',main=main, xlab='j', pch=19, ylab='Winsorized Mean(j/n)', ylim=c(ylimmin,ylimmax))
lines(ub,lty=3)
lines(lb,lty=3)
grid()
dev.off()
bitmap(file='test2.png')
lb <- tri[,1] - 2*tri[,2]
ub <- tri[,1] + 2*tri[,2]
if ((ylimmin == '') | (ylimmax == '')) plot(tri[,1],type='b',main=main, xlab='j', pch=19, ylab='Trimmed Mean(j/n)', ylim=c(min(lb),max(ub))) else plot(tri[,1],type='l',main=main, xlab='j', pch=19, ylab='Trimmed Mean(j/n)', ylim=c(ylimmin,ylimmax))
lines(ub,lty=3)
lines(lb,lty=3)
grid()
dev.off()
load(file='createtable')
a<-table.start()
a<-table.row.start(a)
a<-table.element(a,'Central Tendency - Ungrouped Data',4,TRUE)
a<-table.row.end(a)
a<-table.row.start(a)
a<-table.element(a,'Measure',header=TRUE)
a<-table.element(a,'Value',header=TRUE)
a<-table.element(a,'S.E.',header=TRUE)
a<-table.element(a,'Value/S.E.',header=TRUE)
a<-table.row.end(a)
a<-table.row.start(a)
a<-table.element(a,hyperlink('arithmetic_mean.htm', 'Arithmetic Mean', 'click to view the definition of the Arithmetic Mean'),header=TRUE)
a<-table.element(a,arm)
a<-table.element(a,hyperlink('arithmetic_mean_standard_error.htm', armse, 'click to view the definition of the Standard Error of the Arithmetic Mean'))
a<-table.element(a,armose)
a<-table.row.end(a)
a<-table.row.start(a)
a<-table.element(a,hyperlink('geometric_mean.htm', 'Geometric Mean', 'click to view the definition of the Geometric Mean'),header=TRUE)
a<-table.element(a,geo)
a<-table.element(a,'')
a<-table.row.end(a)
a<-table.row.start(a)
a<-table.element(a,hyperlink('harmonic_mean.htm', 'Harmonic Mean', 'click to view the definition of the Harmonic Mean'),header=TRUE)
a<-table.element(a,har)
a<-table.element(a,'')
a<-table.row.end(a)
a<-table.row.start(a)
a<-table.element(a,hyperlink('quadratic_mean.htm', 'Quadratic Mean', 'click to view the definition of the Quadratic Mean'),header=TRUE)
a<-table.element(a,qua)
a<-table.element(a,'')
a<-table.row.end(a)
for (j in 1:length(win[,1])) {
a<-table.row.start(a)
mylabel <- paste('Winsorized Mean (',j)
mylabel <- paste(mylabel,'/')
mylabel <- paste(mylabel,length(win[,1]))
mylabel <- paste(mylabel,')')
a<-table.element(a,hyperlink('winsorized_mean.htm', mylabel, 'click to view the definition of the Winsorized Mean'),header=TRUE)
a<-table.element(a,win[j,1])
a<-table.element(a,win[j,2])
a<-table.element(a,win[j,1]/win[j,2])
a<-table.row.end(a)
}
for (j in 1:length(tri[,1])) {
a<-table.row.start(a)
mylabel <- paste('Trimmed Mean (',j)
mylabel <- paste(mylabel,'/')
mylabel <- paste(mylabel,length(tri[,1]))
mylabel <- paste(mylabel,')')
a<-table.element(a,hyperlink('arithmetic_mean.htm', mylabel, 'click to view the definition of the Trimmed Mean'),header=TRUE)
a<-table.element(a,tri[j,1])
a<-table.element(a,tri[j,2])
a<-table.element(a,tri[j,1]/tri[j,2])
a<-table.row.end(a)
}
a<-table.row.start(a)
a<-table.element(a,hyperlink('median_1.htm', 'Median', 'click to view the definition of the Median'),header=TRUE)
a<-table.element(a,median(x))
a<-table.element(a,'')
a<-table.row.end(a)
a<-table.row.start(a)
a<-table.element(a,hyperlink('midrange.htm', 'Midrange', 'click to view the definition of the Midrange'),header=TRUE)
a<-table.element(a,midr)
a<-table.element(a,'')
a<-table.row.end(a)
a<-table.row.start(a)
mymid <- hyperlink('midmean.htm', 'Midmean', 'click to view the definition of the Midmean')
mylabel <- paste(mymid,hyperlink('method_1.htm','Weighted Average at Xnp',''),sep=' - ')
a<-table.element(a,mylabel,header=TRUE)
a<-table.element(a,midm[1])
a<-table.element(a,'')
a<-table.row.end(a)
a<-table.row.start(a)
mymid <- hyperlink('midmean.htm', 'Midmean', 'click to view the definition of the Midmean')
mylabel <- paste(mymid,hyperlink('method_2.htm','Weighted Average at X(n+1)p',''),sep=' - ')
a<-table.element(a,mylabel,header=TRUE)
a<-table.element(a,midm[2])
a<-table.element(a,'')
a<-table.row.end(a)
a<-table.row.start(a)
mymid <- hyperlink('midmean.htm', 'Midmean', 'click to view the definition of the Midmean')
mylabel <- paste(mymid,hyperlink('method_3.htm','Empirical Distribution Function',''),sep=' - ')
a<-table.element(a,mylabel,header=TRUE)
a<-table.element(a,midm[3])
a<-table.element(a,'')
a<-table.row.end(a)
a<-table.row.start(a)
mymid <- hyperlink('midmean.htm', 'Midmean', 'click to view the definition of the Midmean')
mylabel <- paste(mymid,hyperlink('method_4.htm','Empirical Distribution Function - Averaging',''),sep=' - ')
a<-table.element(a,mylabel,header=TRUE)
a<-table.element(a,midm[4])
a<-table.element(a,'')
a<-table.row.end(a)
a<-table.row.start(a)
mymid <- hyperlink('midmean.htm', 'Midmean', 'click to view the definition of the Midmean')
mylabel <- paste(mymid,hyperlink('method_5.htm','Empirical Distribution Function - Interpolation',''),sep=' - ')
a<-table.element(a,mylabel,header=TRUE)
a<-table.element(a,midm[5])
a<-table.element(a,'')
a<-table.row.end(a)
a<-table.row.start(a)
mymid <- hyperlink('midmean.htm', 'Midmean', 'click to view the definition of the Midmean')
mylabel <- paste(mymid,hyperlink('method_6.htm','Closest Observation',''),sep=' - ')
a<-table.element(a,mylabel,header=TRUE)
a<-table.element(a,midm[6])
a<-table.element(a,'')
a<-table.row.end(a)
a<-table.row.start(a)
mymid <- hyperlink('midmean.htm', 'Midmean', 'click to view the definition of the Midmean')
mylabel <- paste(mymid,hyperlink('method_7.htm','True Basic - Statistics Graphics Toolkit',''),sep=' - ')
a<-table.element(a,mylabel,header=TRUE)
a<-table.element(a,midm[7])
a<-table.element(a,'')
a<-table.row.end(a)
a<-table.row.start(a)
mymid <- hyperlink('midmean.htm', 'Midmean', 'click to view the definition of the Midmean')
mylabel <- paste(mymid,hyperlink('method_8.htm','MS Excel (old versions)',''),sep=' - ')
a<-table.element(a,mylabel,header=TRUE)
a<-table.element(a,midm[8])
a<-table.element(a,'')
a<-table.row.end(a)
a<-table.row.start(a)
a<-table.element(a,'Number of observations',header=TRUE)
a<-table.element(a,length(x))
a<-table.element(a,'')
a<-table.row.end(a)
a<-table.end(a)
table.save(a,file='mytable.tab')