Free Statistics

of Irreproducible Research!

Author's title

Author*Unverified author*
R Software Modulerwasp_exponentialsmoothing.wasp
Title produced by softwareExponential Smoothing
Date of computationWed, 08 Oct 2014 08:41:02 +0100
Cite this page as followsStatistical Computations at FreeStatistics.org, Office for Research Development and Education, URL https://freestatistics.org/blog/index.php?v=date/2014/Oct/08/t1412754142s42n80uex0mt38v.htm/, Retrieved Sun, 12 May 2024 03:07:26 +0000
Statistical Computations at FreeStatistics.org, Office for Research Development and Education, URL https://freestatistics.org/blog/index.php?pk=239430, Retrieved Sun, 12 May 2024 03:07:26 +0000
QR Codes:

Original text written by user:
IsPrivate?No (this computation is public)
User-defined keywords
Estimated Impact127
Family? (F = Feedback message, R = changed R code, M = changed R Module, P = changed Parameters, D = changed Data)
-       [Exponential Smoothing] [] [2014-10-08 07:41:02] [d41d8cd98f00b204e9800998ecf8427e] [Current]
Feedback Forum

Post a new message
Dataseries X:
185460
241861
406684
13956
83700
172957
187720
178261
3672
84698
28533
83909
115446
134787
227477
173859
70344
83937
48049
84601
74918
84455
190051
42789
188832
323411
366855
594265
690315
553034
347869
345946
31743
280548
459108
502223
784612
760892
962397
393563
358047
311529
269359
243392
37715


Summary of computational transaction
Raw Inputview raw input (R code)
Raw Outputview raw output of R engine
Computing time2 seconds
R Server'Sir Ronald Aylmer Fisher' @ fisher.wessa.net

\begin{tabular}{lllllllll}
\hline
Summary of computational transaction \tabularnewline
Raw Input & view raw input (R code)  \tabularnewline
Raw Output & view raw output of R engine  \tabularnewline
Computing time & 2 seconds \tabularnewline
R Server & 'Sir Ronald Aylmer Fisher' @ fisher.wessa.net \tabularnewline
\hline
\end{tabular}
%Source: https://freestatistics.org/blog/index.php?pk=239430&T=0

[TABLE]
[ROW][C]Summary of computational transaction[/C][/ROW]
[ROW][C]Raw Input[/C][C]view raw input (R code) [/C][/ROW]
[ROW][C]Raw Output[/C][C]view raw output of R engine [/C][/ROW]
[ROW][C]Computing time[/C][C]2 seconds[/C][/ROW]
[ROW][C]R Server[/C][C]'Sir Ronald Aylmer Fisher' @ fisher.wessa.net[/C][/ROW]
[/TABLE]
Source: https://freestatistics.org/blog/index.php?pk=239430&T=0

Globally Unique Identifier (entire table): ba.freestatistics.org/blog/index.php?pk=239430&T=0

As an alternative you can also use a QR Code:  

The GUIDs for individual cells are displayed in the table below:

Summary of computational transaction
Raw Inputview raw input (R code)
Raw Outputview raw output of R engine
Computing time2 seconds
R Server'Sir Ronald Aylmer Fisher' @ fisher.wessa.net


Estimated Parameters of Exponential Smoothing
ParameterValue
alpha0.0597886822546443
beta0
gamma0.114924147454416

\begin{tabular}{lllllllll}
\hline
Estimated Parameters of Exponential Smoothing \tabularnewline
Parameter & Value \tabularnewline
alpha & 0.0597886822546443 \tabularnewline
beta & 0 \tabularnewline
gamma & 0.114924147454416 \tabularnewline
\hline
\end{tabular}
%Source: https://freestatistics.org/blog/index.php?pk=239430&T=1

[TABLE]
[ROW][C]Estimated Parameters of Exponential Smoothing[/C][/ROW]
[ROW][C]Parameter[/C][C]Value[/C][/ROW]
[ROW][C]alpha[/C][C]0.0597886822546443[/C][/ROW]
[ROW][C]beta[/C][C]0[/C][/ROW]
[ROW][C]gamma[/C][C]0.114924147454416[/C][/ROW]
[/TABLE]
Source: https://freestatistics.org/blog/index.php?pk=239430&T=1

Globally Unique Identifier (entire table): ba.freestatistics.org/blog/index.php?pk=239430&T=1

As an alternative you can also use a QR Code:  

The GUIDs for individual cells are displayed in the table below:

Estimated Parameters of Exponential Smoothing
ParameterValue
alpha0.0597886822546443
beta0
gamma0.114924147454416


Interpolation Forecasts of Exponential Smoothing
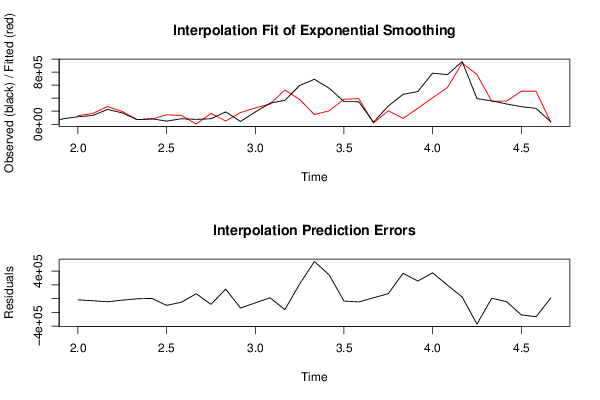
tObservedFittedResiduals
13115446132416.989362032-16970.9893620324
14134787165078.003079915-30291.0030799146
15227477272329.434989769-44852.4349897694
16173859195712.176046723-21853.1760467228
177034472100.7874668993-1756.78746689932
188393780206.80381282943730.19618717063
1948049145073.604932953-97024.604932953
2084601136346.041430134-51745.041430134
21749182945.7054036857471972.2945963143
2284455166526.148193363-82071.1481933631
2319005151142.952154082138908.047845918
2442789179351.589944128-136562.589944128
25188832249987.334643346-61155.3346433464
26323411310575.97174938512835.028250615
27366855525845.987395182-158990.987395182
28594265381052.960777969213212.039222031
29690315149180.287741298541134.712258702
30553034206666.5639843346367.4360157
31347869383162.016037494-35293.0160374941
32345946393004.41493855-47058.4149385498
333174318998.80312274212744.196877258
34280548207533.10231312273014.8976868784
3545910889142.9915046335369965.008495366
36502223245712.233497718256510.766502282
37784612407698.850863404376913.149136596
38760892562559.468279838198332.531720162
39962397938368.94899007524028.0510099251
40393563763407.013250005-369844.013250005
41358047352436.3044032795610.69559672131
42311529354799.852292828-43270.852292828
43269359505589.650219244-236230.650219244
44243392506328.209488809-262936.209488809
453771525938.166794499511776.8332055005

\begin{tabular}{lllllllll}
\hline
Interpolation Forecasts of Exponential Smoothing \tabularnewline
t & Observed & Fitted & Residuals \tabularnewline
13 & 115446 & 132416.989362032 & -16970.9893620324 \tabularnewline
14 & 134787 & 165078.003079915 & -30291.0030799146 \tabularnewline
15 & 227477 & 272329.434989769 & -44852.4349897694 \tabularnewline
16 & 173859 & 195712.176046723 & -21853.1760467228 \tabularnewline
17 & 70344 & 72100.7874668993 & -1756.78746689932 \tabularnewline
18 & 83937 & 80206.8038128294 & 3730.19618717063 \tabularnewline
19 & 48049 & 145073.604932953 & -97024.604932953 \tabularnewline
20 & 84601 & 136346.041430134 & -51745.041430134 \tabularnewline
21 & 74918 & 2945.70540368574 & 71972.2945963143 \tabularnewline
22 & 84455 & 166526.148193363 & -82071.1481933631 \tabularnewline
23 & 190051 & 51142.952154082 & 138908.047845918 \tabularnewline
24 & 42789 & 179351.589944128 & -136562.589944128 \tabularnewline
25 & 188832 & 249987.334643346 & -61155.3346433464 \tabularnewline
26 & 323411 & 310575.971749385 & 12835.028250615 \tabularnewline
27 & 366855 & 525845.987395182 & -158990.987395182 \tabularnewline
28 & 594265 & 381052.960777969 & 213212.039222031 \tabularnewline
29 & 690315 & 149180.287741298 & 541134.712258702 \tabularnewline
30 & 553034 & 206666.5639843 & 346367.4360157 \tabularnewline
31 & 347869 & 383162.016037494 & -35293.0160374941 \tabularnewline
32 & 345946 & 393004.41493855 & -47058.4149385498 \tabularnewline
33 & 31743 & 18998.803122742 & 12744.196877258 \tabularnewline
34 & 280548 & 207533.102313122 & 73014.8976868784 \tabularnewline
35 & 459108 & 89142.9915046335 & 369965.008495366 \tabularnewline
36 & 502223 & 245712.233497718 & 256510.766502282 \tabularnewline
37 & 784612 & 407698.850863404 & 376913.149136596 \tabularnewline
38 & 760892 & 562559.468279838 & 198332.531720162 \tabularnewline
39 & 962397 & 938368.948990075 & 24028.0510099251 \tabularnewline
40 & 393563 & 763407.013250005 & -369844.013250005 \tabularnewline
41 & 358047 & 352436.304403279 & 5610.69559672131 \tabularnewline
42 & 311529 & 354799.852292828 & -43270.852292828 \tabularnewline
43 & 269359 & 505589.650219244 & -236230.650219244 \tabularnewline
44 & 243392 & 506328.209488809 & -262936.209488809 \tabularnewline
45 & 37715 & 25938.1667944995 & 11776.8332055005 \tabularnewline
\hline
\end{tabular}
%Source: https://freestatistics.org/blog/index.php?pk=239430&T=2

[TABLE]
[ROW][C]Interpolation Forecasts of Exponential Smoothing[/C][/ROW]
[ROW][C]t[/C][C]Observed[/C][C]Fitted[/C][C]Residuals[/C][/ROW]
[ROW][C]13[/C][C]115446[/C][C]132416.989362032[/C][C]-16970.9893620324[/C][/ROW]
[ROW][C]14[/C][C]134787[/C][C]165078.003079915[/C][C]-30291.0030799146[/C][/ROW]
[ROW][C]15[/C][C]227477[/C][C]272329.434989769[/C][C]-44852.4349897694[/C][/ROW]
[ROW][C]16[/C][C]173859[/C][C]195712.176046723[/C][C]-21853.1760467228[/C][/ROW]
[ROW][C]17[/C][C]70344[/C][C]72100.7874668993[/C][C]-1756.78746689932[/C][/ROW]
[ROW][C]18[/C][C]83937[/C][C]80206.8038128294[/C][C]3730.19618717063[/C][/ROW]
[ROW][C]19[/C][C]48049[/C][C]145073.604932953[/C][C]-97024.604932953[/C][/ROW]
[ROW][C]20[/C][C]84601[/C][C]136346.041430134[/C][C]-51745.041430134[/C][/ROW]
[ROW][C]21[/C][C]74918[/C][C]2945.70540368574[/C][C]71972.2945963143[/C][/ROW]
[ROW][C]22[/C][C]84455[/C][C]166526.148193363[/C][C]-82071.1481933631[/C][/ROW]
[ROW][C]23[/C][C]190051[/C][C]51142.952154082[/C][C]138908.047845918[/C][/ROW]
[ROW][C]24[/C][C]42789[/C][C]179351.589944128[/C][C]-136562.589944128[/C][/ROW]
[ROW][C]25[/C][C]188832[/C][C]249987.334643346[/C][C]-61155.3346433464[/C][/ROW]
[ROW][C]26[/C][C]323411[/C][C]310575.971749385[/C][C]12835.028250615[/C][/ROW]
[ROW][C]27[/C][C]366855[/C][C]525845.987395182[/C][C]-158990.987395182[/C][/ROW]
[ROW][C]28[/C][C]594265[/C][C]381052.960777969[/C][C]213212.039222031[/C][/ROW]
[ROW][C]29[/C][C]690315[/C][C]149180.287741298[/C][C]541134.712258702[/C][/ROW]
[ROW][C]30[/C][C]553034[/C][C]206666.5639843[/C][C]346367.4360157[/C][/ROW]
[ROW][C]31[/C][C]347869[/C][C]383162.016037494[/C][C]-35293.0160374941[/C][/ROW]
[ROW][C]32[/C][C]345946[/C][C]393004.41493855[/C][C]-47058.4149385498[/C][/ROW]
[ROW][C]33[/C][C]31743[/C][C]18998.803122742[/C][C]12744.196877258[/C][/ROW]
[ROW][C]34[/C][C]280548[/C][C]207533.102313122[/C][C]73014.8976868784[/C][/ROW]
[ROW][C]35[/C][C]459108[/C][C]89142.9915046335[/C][C]369965.008495366[/C][/ROW]
[ROW][C]36[/C][C]502223[/C][C]245712.233497718[/C][C]256510.766502282[/C][/ROW]
[ROW][C]37[/C][C]784612[/C][C]407698.850863404[/C][C]376913.149136596[/C][/ROW]
[ROW][C]38[/C][C]760892[/C][C]562559.468279838[/C][C]198332.531720162[/C][/ROW]
[ROW][C]39[/C][C]962397[/C][C]938368.948990075[/C][C]24028.0510099251[/C][/ROW]
[ROW][C]40[/C][C]393563[/C][C]763407.013250005[/C][C]-369844.013250005[/C][/ROW]
[ROW][C]41[/C][C]358047[/C][C]352436.304403279[/C][C]5610.69559672131[/C][/ROW]
[ROW][C]42[/C][C]311529[/C][C]354799.852292828[/C][C]-43270.852292828[/C][/ROW]
[ROW][C]43[/C][C]269359[/C][C]505589.650219244[/C][C]-236230.650219244[/C][/ROW]
[ROW][C]44[/C][C]243392[/C][C]506328.209488809[/C][C]-262936.209488809[/C][/ROW]
[ROW][C]45[/C][C]37715[/C][C]25938.1667944995[/C][C]11776.8332055005[/C][/ROW]
[/TABLE]
Source: https://freestatistics.org/blog/index.php?pk=239430&T=2

Globally Unique Identifier (entire table): ba.freestatistics.org/blog/index.php?pk=239430&T=2

As an alternative you can also use a QR Code:  

The GUIDs for individual cells are displayed in the table below:

Interpolation Forecasts of Exponential Smoothing
tObservedFittedResiduals
13115446132416.989362032-16970.9893620324
14134787165078.003079915-30291.0030799146
15227477272329.434989769-44852.4349897694
16173859195712.176046723-21853.1760467228
177034472100.7874668993-1756.78746689932
188393780206.80381282943730.19618717063
1948049145073.604932953-97024.604932953
2084601136346.041430134-51745.041430134
21749182945.7054036857471972.2945963143
2284455166526.148193363-82071.1481933631
2319005151142.952154082138908.047845918
2442789179351.589944128-136562.589944128
25188832249987.334643346-61155.3346433464
26323411310575.97174938512835.028250615
27366855525845.987395182-158990.987395182
28594265381052.960777969213212.039222031
29690315149180.287741298541134.712258702
30553034206666.5639843346367.4360157
31347869383162.016037494-35293.0160374941
32345946393004.41493855-47058.4149385498
333174318998.80312274212744.196877258
34280548207533.10231312273014.8976868784
3545910889142.9915046335369965.008495366
36502223245712.233497718256510.766502282
37784612407698.850863404376913.149136596
38760892562559.468279838198332.531720162
39962397938368.94899007524028.0510099251
40393563763407.013250005-369844.013250005
41358047352436.3044032795610.69559672131
42311529354799.852292828-43270.852292828
43269359505589.650219244-236230.650219244
44243392506328.209488809-262936.209488809
453771525938.166794499511776.8332055005


Extrapolation Forecasts of Exponential Smoothing
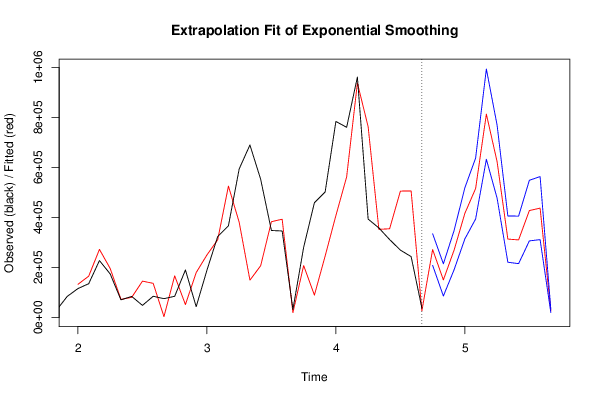
tForecast95% Lower Bound95% Upper Bound
46271783.284200138208543.422991515335023.14540876
47150072.98069278285605.3391717479214540.622213817
48269692.037127502191121.256750217348262.817504786
49416628.479595386314230.212789426519026.746401346
50515823.056526165393898.855246475637747.257805854
51813839.472619207633008.135614135994670.809624278
52623137.823465374476989.66672672769285.980204029
53313438.01881264220794.889241718406081.148383562
54310276.990018986215103.982855396405449.997182575
55427618.567806719306290.42849772548946.707115718
56437520.332571877311342.187671302563698.477472452
5725716.319662736619116.776087886732315.8632375864

\begin{tabular}{lllllllll}
\hline
Extrapolation Forecasts of Exponential Smoothing \tabularnewline
t & Forecast & 95% Lower Bound & 95% Upper Bound \tabularnewline
46 & 271783.284200138 & 208543.422991515 & 335023.14540876 \tabularnewline
47 & 150072.980692782 & 85605.3391717479 & 214540.622213817 \tabularnewline
48 & 269692.037127502 & 191121.256750217 & 348262.817504786 \tabularnewline
49 & 416628.479595386 & 314230.212789426 & 519026.746401346 \tabularnewline
50 & 515823.056526165 & 393898.855246475 & 637747.257805854 \tabularnewline
51 & 813839.472619207 & 633008.135614135 & 994670.809624278 \tabularnewline
52 & 623137.823465374 & 476989.66672672 & 769285.980204029 \tabularnewline
53 & 313438.01881264 & 220794.889241718 & 406081.148383562 \tabularnewline
54 & 310276.990018986 & 215103.982855396 & 405449.997182575 \tabularnewline
55 & 427618.567806719 & 306290.42849772 & 548946.707115718 \tabularnewline
56 & 437520.332571877 & 311342.187671302 & 563698.477472452 \tabularnewline
57 & 25716.3196627366 & 19116.7760878867 & 32315.8632375864 \tabularnewline
\hline
\end{tabular}
%Source: https://freestatistics.org/blog/index.php?pk=239430&T=3

[TABLE]
[ROW][C]Extrapolation Forecasts of Exponential Smoothing[/C][/ROW]
[ROW][C]t[/C][C]Forecast[/C][C]95% Lower Bound[/C][C]95% Upper Bound[/C][/ROW]
[ROW][C]46[/C][C]271783.284200138[/C][C]208543.422991515[/C][C]335023.14540876[/C][/ROW]
[ROW][C]47[/C][C]150072.980692782[/C][C]85605.3391717479[/C][C]214540.622213817[/C][/ROW]
[ROW][C]48[/C][C]269692.037127502[/C][C]191121.256750217[/C][C]348262.817504786[/C][/ROW]
[ROW][C]49[/C][C]416628.479595386[/C][C]314230.212789426[/C][C]519026.746401346[/C][/ROW]
[ROW][C]50[/C][C]515823.056526165[/C][C]393898.855246475[/C][C]637747.257805854[/C][/ROW]
[ROW][C]51[/C][C]813839.472619207[/C][C]633008.135614135[/C][C]994670.809624278[/C][/ROW]
[ROW][C]52[/C][C]623137.823465374[/C][C]476989.66672672[/C][C]769285.980204029[/C][/ROW]
[ROW][C]53[/C][C]313438.01881264[/C][C]220794.889241718[/C][C]406081.148383562[/C][/ROW]
[ROW][C]54[/C][C]310276.990018986[/C][C]215103.982855396[/C][C]405449.997182575[/C][/ROW]
[ROW][C]55[/C][C]427618.567806719[/C][C]306290.42849772[/C][C]548946.707115718[/C][/ROW]
[ROW][C]56[/C][C]437520.332571877[/C][C]311342.187671302[/C][C]563698.477472452[/C][/ROW]
[ROW][C]57[/C][C]25716.3196627366[/C][C]19116.7760878867[/C][C]32315.8632375864[/C][/ROW]
[/TABLE]
Source: https://freestatistics.org/blog/index.php?pk=239430&T=3

Globally Unique Identifier (entire table): ba.freestatistics.org/blog/index.php?pk=239430&T=3

As an alternative you can also use a QR Code:  

The GUIDs for individual cells are displayed in the table below:

Extrapolation Forecasts of Exponential Smoothing
tForecast95% Lower Bound95% Upper Bound
46271783.284200138208543.422991515335023.14540876
47150072.98069278285605.3391717479214540.622213817
48269692.037127502191121.256750217348262.817504786
49416628.479595386314230.212789426519026.746401346
50515823.056526165393898.855246475637747.257805854
51813839.472619207633008.135614135994670.809624278
52623137.823465374476989.66672672769285.980204029
53313438.01881264220794.889241718406081.148383562
54310276.990018986215103.982855396405449.997182575
55427618.567806719306290.42849772548946.707115718
56437520.332571877311342.187671302563698.477472452
5725716.319662736619116.776087886732315.8632375864


Parameters (Session):
par1 = 12 ; par2 = Triple ; par3 = multiplicative ;
Parameters (R input):
par1 = 12 ; par2 = Triple ; par3 = multiplicative ;
R code (references can be found in the software module):
par3 <- 'multiplicative'
par2 <- 'Double'
par1 <- '12'
par1 <- as.numeric(par1)
if (par2 == 'Single') K <- 1
if (par2 == 'Double') K <- 2
if (par2 == 'Triple') K <- par1
nx <- length(x)
nxmK <- nx - K
x <- ts(x, frequency = par1)
if (par2 == 'Single') fit <- HoltWinters(x, gamma=F, beta=F)
if (par2 == 'Double') fit <- HoltWinters(x, gamma=F)
if (par2 == 'Triple') fit <- HoltWinters(x, seasonal=par3)
fit
myresid <- x - fit$fitted[,'xhat']
bitmap(file='test1.png')
op <- par(mfrow=c(2,1))
plot(fit,ylab='Observed (black) / Fitted (red)',main='Interpolation Fit of Exponential Smoothing')
plot(myresid,ylab='Residuals',main='Interpolation Prediction Errors')
par(op)
dev.off()
bitmap(file='test2.png')
p <- predict(fit, par1, prediction.interval=TRUE)
np <- length(p[,1])
plot(fit,p,ylab='Observed (black) / Fitted (red)',main='Extrapolation Fit of Exponential Smoothing')
dev.off()
bitmap(file='test3.png')
op <- par(mfrow = c(2,2))
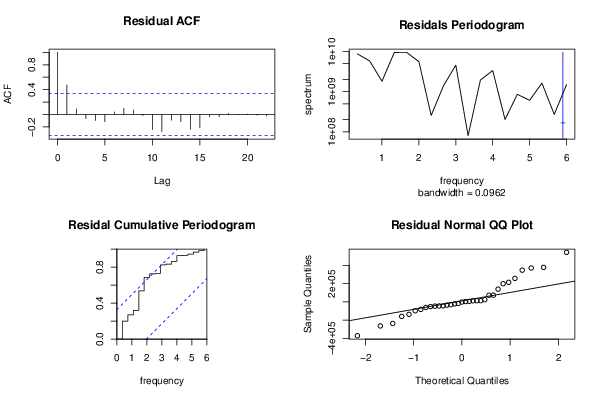
acf(as.numeric(myresid),lag.max = nx/2,main='Residual ACF')
spectrum(myresid,main='Residals Periodogram')
cpgram(myresid,main='Residal Cumulative Periodogram')
qqnorm(myresid,main='Residual Normal QQ Plot')
qqline(myresid)
par(op)
dev.off()
load(file='createtable')
a<-table.start()
a<-table.row.start(a)
a<-table.element(a,'Estimated Parameters of Exponential Smoothing',2,TRUE)
a<-table.row.end(a)
a<-table.row.start(a)
a<-table.element(a,'Parameter',header=TRUE)
a<-table.element(a,'Value',header=TRUE)
a<-table.row.end(a)
a<-table.row.start(a)
a<-table.element(a,'alpha',header=TRUE)
a<-table.element(a,fit$alpha)
a<-table.row.end(a)
a<-table.row.start(a)
a<-table.element(a,'beta',header=TRUE)
a<-table.element(a,fit$beta)
a<-table.row.end(a)
a<-table.row.start(a)
a<-table.element(a,'gamma',header=TRUE)
a<-table.element(a,fit$gamma)
a<-table.row.end(a)
a<-table.end(a)
table.save(a,file='mytable.tab')
a<-table.start()
a<-table.row.start(a)
a<-table.element(a,'Interpolation Forecasts of Exponential Smoothing',4,TRUE)
a<-table.row.end(a)
a<-table.row.start(a)
a<-table.element(a,'t',header=TRUE)
a<-table.element(a,'Observed',header=TRUE)
a<-table.element(a,'Fitted',header=TRUE)
a<-table.element(a,'Residuals',header=TRUE)
a<-table.row.end(a)
for (i in 1:nxmK) {
a<-table.row.start(a)
a<-table.element(a,i+K,header=TRUE)
a<-table.element(a,x[i+K])
a<-table.element(a,fit$fitted[i,'xhat'])
a<-table.element(a,myresid[i])
a<-table.row.end(a)
}
a<-table.end(a)
table.save(a,file='mytable1.tab')
a<-table.start()
a<-table.row.start(a)
a<-table.element(a,'Extrapolation Forecasts of Exponential Smoothing',4,TRUE)
a<-table.row.end(a)
a<-table.row.start(a)
a<-table.element(a,'t',header=TRUE)
a<-table.element(a,'Forecast',header=TRUE)
a<-table.element(a,'95% Lower Bound',header=TRUE)
a<-table.element(a,'95% Upper Bound',header=TRUE)
a<-table.row.end(a)
for (i in 1:np) {
a<-table.row.start(a)
a<-table.element(a,nx+i,header=TRUE)
a<-table.element(a,p[i,'fit'])
a<-table.element(a,p[i,'lwr'])
a<-table.element(a,p[i,'upr'])
a<-table.row.end(a)
}
a<-table.end(a)
table.save(a,file='mytable2.tab')