Free Statistics

of Irreproducible Research!

Author's title

Author*The author of this computation has been verified*
R Software Modulerwasp_density.wasp
Title produced by softwareKernel Density Estimation
Date of computationSun, 05 Oct 2014 21:01:59 +0100
Cite this page as followsStatistical Computations at FreeStatistics.org, Office for Research Development and Education, URL https://freestatistics.org/blog/index.php?v=date/2014/Oct/05/t1412539354wpnz8yedkx0yki3.htm/, Retrieved Sat, 11 May 2024 18:33:00 +0000
Statistical Computations at FreeStatistics.org, Office for Research Development and Education, URL https://freestatistics.org/blog/index.php?pk=238898, Retrieved Sat, 11 May 2024 18:33:00 +0000
QR Codes:

Original text written by user:
IsPrivate?No (this computation is public)
User-defined keywords
Estimated Impact86
Family? (F = Feedback message, R = changed R code, M = changed R Module, P = changed Parameters, D = changed Data)
-     [Univariate Data Series] [] [2014-09-24 18:05:52] [cf31a83245e4359b12142c1d444c8585]
- RMP     [Kernel Density Estimation] [] [2014-10-05 20:01:59] [d41d8cd98f00b204e9800998ecf8427e] [Current]
Feedback Forum

Post a new message
Dataseries X:
0.52
0.53
0.53
0.53
0.53
0.51
0.5
0.49
0.49
0.5
0.5
0.51
0.52
0.52
0.52
0.52
0.51
0.51
0.47
0.44
0.44
0.47
0.49
0.48
0.52
0.51
0.52
0.51
0.51
0.5
0.51
0.47
0.49
0.48
0.51
0.51
0.51
0.52
0.52
0.51
0.52
0.52
0.5
0.45
0.42
0.43
0.47
0.48
0.5
0.52
0.5
0.51
0.5
0.5
0.49
0.47
0.46
0.46
0.49
0.5
0.53
0.5
0.51
0.51
0.5
0.49
0.5
0.51
0.5
0.47
0.49
0.49


Summary of computational transaction
Raw Inputview raw input (R code)
Raw Outputview raw output of R engine
Computing time3 seconds
R Server'Sir Maurice George Kendall' @ kendall.wessa.net

\begin{tabular}{lllllllll}
\hline
Summary of computational transaction \tabularnewline
Raw Input & view raw input (R code)  \tabularnewline
Raw Output & view raw output of R engine  \tabularnewline
Computing time & 3 seconds \tabularnewline
R Server & 'Sir Maurice George Kendall' @ kendall.wessa.net \tabularnewline
\hline
\end{tabular}
%Source: https://freestatistics.org/blog/index.php?pk=238898&T=0

[TABLE]
[ROW][C]Summary of computational transaction[/C][/ROW]
[ROW][C]Raw Input[/C][C]view raw input (R code) [/C][/ROW]
[ROW][C]Raw Output[/C][C]view raw output of R engine [/C][/ROW]
[ROW][C]Computing time[/C][C]3 seconds[/C][/ROW]
[ROW][C]R Server[/C][C]'Sir Maurice George Kendall' @ kendall.wessa.net[/C][/ROW]
[/TABLE]
Source: https://freestatistics.org/blog/index.php?pk=238898&T=0

Globally Unique Identifier (entire table): ba.freestatistics.org/blog/index.php?pk=238898&T=0

As an alternative you can also use a QR Code:  

The GUIDs for individual cells are displayed in the table below:

Summary of computational transaction
Raw Inputview raw input (R code)
Raw Outputview raw output of R engine
Computing time3 seconds
R Server'Sir Maurice George Kendall' @ kendall.wessa.net


Properties of Density Trace
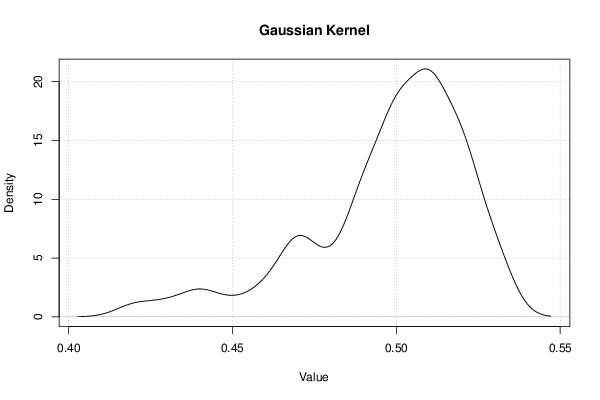
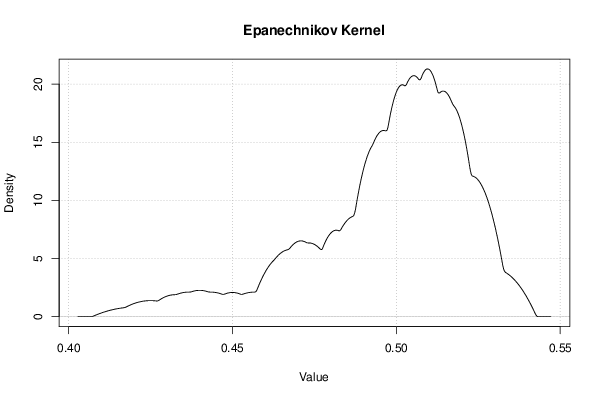
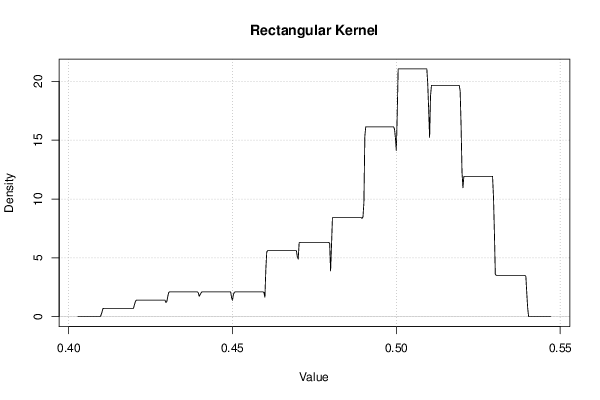
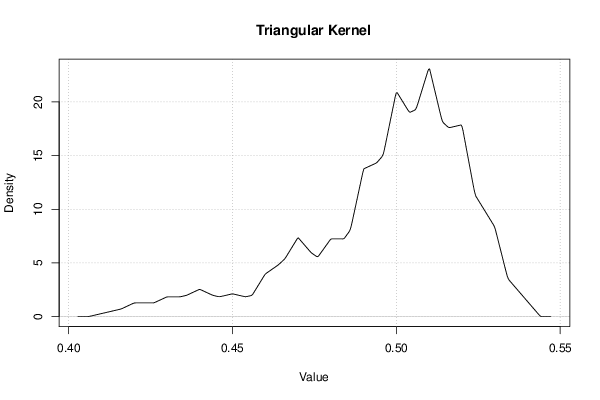
Bandwidth0.00571085597295131
#Observations72

\begin{tabular}{lllllllll}
\hline
Properties of Density Trace \tabularnewline
Bandwidth & 0.00571085597295131 \tabularnewline
#Observations & 72 \tabularnewline
\hline
\end{tabular}
%Source: https://freestatistics.org/blog/index.php?pk=238898&T=1

[TABLE]
[ROW][C]Properties of Density Trace[/C][/ROW]
[ROW][C]Bandwidth[/C][C]0.00571085597295131[/C][/ROW]
[ROW][C]#Observations[/C][C]72[/C][/ROW]
[/TABLE]
Source: https://freestatistics.org/blog/index.php?pk=238898&T=1

Globally Unique Identifier (entire table): ba.freestatistics.org/blog/index.php?pk=238898&T=1

As an alternative you can also use a QR Code:  

The GUIDs for individual cells are displayed in the table below:

Properties of Density Trace
Bandwidth0.00571085597295131
#Observations72


Maximum Density Values
Kernelx-valuemax. density
Gaussian0.5090194694098721.0873214884916
Epanechnikov0.509584107906321.3130293361502
Rectangular0.5005498919634321.0618699982749
Triangular0.51014874640272923.0747066451144
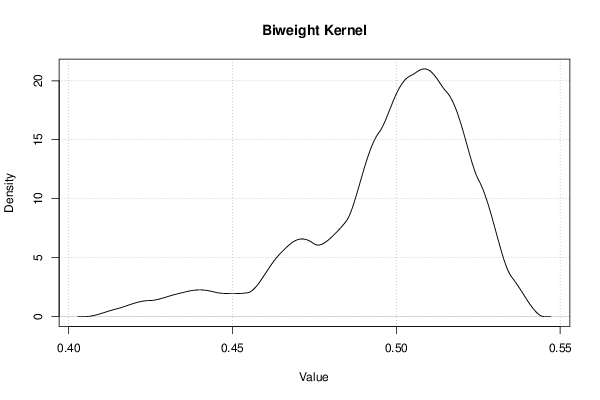
Biweight0.50845483091344121.0015696150116
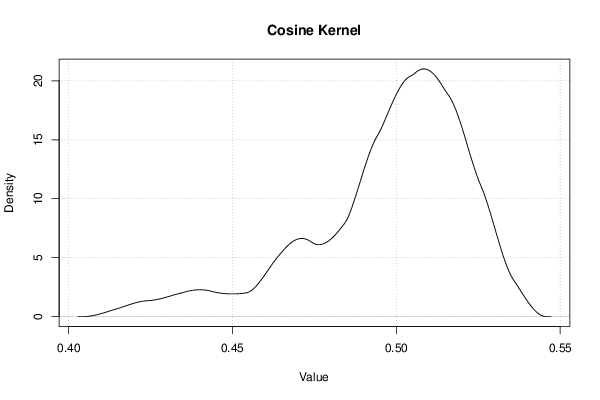
Cosine0.50845483091344121.0053882071718
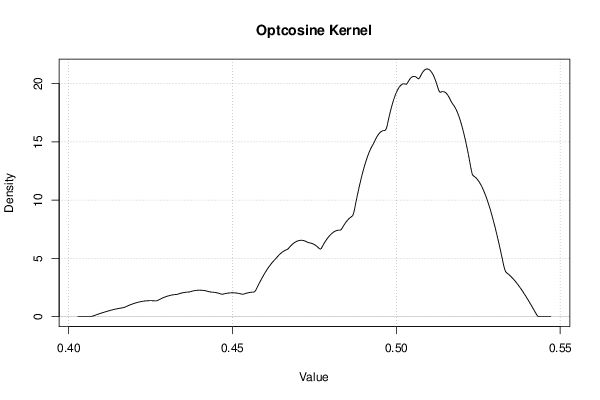
Optcosine0.50930178865808521.2619632850679

\begin{tabular}{lllllllll}
\hline
Maximum Density Values \tabularnewline
Kernel & x-value & max. density \tabularnewline
Gaussian & 0.50901946940987 & 21.0873214884916 \tabularnewline
Epanechnikov & 0.5095841079063 & 21.3130293361502 \tabularnewline
Rectangular & 0.50054989196343 & 21.0618699982749 \tabularnewline
Triangular & 0.510148746402729 & 23.0747066451144 \tabularnewline
Biweight & 0.508454830913441 & 21.0015696150116 \tabularnewline
Cosine & 0.508454830913441 & 21.0053882071718 \tabularnewline
Optcosine & 0.509301788658085 & 21.2619632850679 \tabularnewline
 \hline
\end{tabular}
%Source: https://freestatistics.org/blog/index.php?pk=238898&T=2

[TABLE]
[ROW][C]Maximum Density Values[/C][/ROW]
[ROW][C]Kernel[/C][C]x-value[/C][C]max. density[/C][/ROW]
[ROW][C]Gaussian[/C][C]0.50901946940987[/C][C]21.0873214884916[/C][/ROW]
[ROW][C]Epanechnikov[/C][C]0.5095841079063[/C][C]21.3130293361502[/C][/ROW]
[ROW][C]Rectangular[/C][C]0.50054989196343[/C][C]21.0618699982749[/C][/ROW]
[ROW][C]Triangular[/C][C]0.510148746402729[/C][C]23.0747066451144[/C][/ROW]
[ROW][C]Biweight[/C][C]0.508454830913441[/C][C]21.0015696150116[/C][/ROW]
[ROW][C]Cosine[/C][C]0.508454830913441[/C][C]21.0053882071718[/C][/ROW]
[ROW][C]Optcosine[/C][C]0.509301788658085[/C][C]21.2619632850679[/C][/ROW]
 [/TABLE]
Source: https://freestatistics.org/blog/index.php?pk=238898&T=2

Globally Unique Identifier (entire table): ba.freestatistics.org/blog/index.php?pk=238898&T=2

As an alternative you can also use a QR Code:  

The GUIDs for individual cells are displayed in the table below:

Maximum Density Values
Kernelx-valuemax. density
Gaussian0.5090194694098721.0873214884916
Epanechnikov0.509584107906321.3130293361502
Rectangular0.5005498919634321.0618699982749
Triangular0.51014874640272923.0747066451144
Biweight0.50845483091344121.0015696150116
Cosine0.50845483091344121.0053882071718
Optcosine0.50930178865808521.2619632850679


Maximum Density Values
Kernelx-valuemax. density
Gaussian0.5090194694098721.0873214884916
Epanechnikov0.509584107906321.3130293361502
Rectangular0.50083221121164421.0618699982749
Triangular0.51014874640272923.0747066451144
Biweight0.50845483091344121.0015696150116
Cosine0.50845483091344121.0053882071718
Optcosine0.50930178865808521.2619632850679

\begin{tabular}{lllllllll}
\hline
Maximum Density Values \tabularnewline
Kernel & x-value & max. density \tabularnewline
Gaussian & 0.50901946940987 & 21.0873214884916 \tabularnewline
Epanechnikov & 0.5095841079063 & 21.3130293361502 \tabularnewline
Rectangular & 0.500832211211644 & 21.0618699982749 \tabularnewline
Triangular & 0.510148746402729 & 23.0747066451144 \tabularnewline
Biweight & 0.508454830913441 & 21.0015696150116 \tabularnewline
Cosine & 0.508454830913441 & 21.0053882071718 \tabularnewline
Optcosine & 0.509301788658085 & 21.2619632850679 \tabularnewline
 \hline
\end{tabular}
%Source: https://freestatistics.org/blog/index.php?pk=238898&T=3

[TABLE]
[ROW][C]Maximum Density Values[/C][/ROW]
[ROW][C]Kernel[/C][C]x-value[/C][C]max. density[/C][/ROW]
[ROW][C]Gaussian[/C][C]0.50901946940987[/C][C]21.0873214884916[/C][/ROW]
[ROW][C]Epanechnikov[/C][C]0.5095841079063[/C][C]21.3130293361502[/C][/ROW]
[ROW][C]Rectangular[/C][C]0.500832211211644[/C][C]21.0618699982749[/C][/ROW]
[ROW][C]Triangular[/C][C]0.510148746402729[/C][C]23.0747066451144[/C][/ROW]
[ROW][C]Biweight[/C][C]0.508454830913441[/C][C]21.0015696150116[/C][/ROW]
[ROW][C]Cosine[/C][C]0.508454830913441[/C][C]21.0053882071718[/C][/ROW]
[ROW][C]Optcosine[/C][C]0.509301788658085[/C][C]21.2619632850679[/C][/ROW]
 [/TABLE]
Source: https://freestatistics.org/blog/index.php?pk=238898&T=3

Globally Unique Identifier (entire table): ba.freestatistics.org/blog/index.php?pk=238898&T=3

As an alternative you can also use a QR Code:  

The GUIDs for individual cells are displayed in the table below:

Maximum Density Values
Kernelx-valuemax. density
Gaussian0.5090194694098721.0873214884916
Epanechnikov0.509584107906321.3130293361502
Rectangular0.50083221121164421.0618699982749
Triangular0.51014874640272923.0747066451144
Biweight0.50845483091344121.0015696150116
Cosine0.50845483091344121.0053882071718
Optcosine0.50930178865808521.2619632850679


Maximum Density Values
Kernelx-valuemax. density
Gaussian0.5090194694098721.0873214884916
Epanechnikov0.509584107906321.3130293361502
Rectangular0.50111453045985921.0618699982749
Triangular0.51014874640272923.0747066451144
Biweight0.50845483091344121.0015696150116
Cosine0.50845483091344121.0053882071718
Optcosine0.50930178865808521.2619632850679

\begin{tabular}{lllllllll}
\hline
Maximum Density Values \tabularnewline
Kernel & x-value & max. density \tabularnewline
Gaussian & 0.50901946940987 & 21.0873214884916 \tabularnewline
Epanechnikov & 0.5095841079063 & 21.3130293361502 \tabularnewline
Rectangular & 0.501114530459859 & 21.0618699982749 \tabularnewline
Triangular & 0.510148746402729 & 23.0747066451144 \tabularnewline
Biweight & 0.508454830913441 & 21.0015696150116 \tabularnewline
Cosine & 0.508454830913441 & 21.0053882071718 \tabularnewline
Optcosine & 0.509301788658085 & 21.2619632850679 \tabularnewline
 \hline
\end{tabular}
%Source: https://freestatistics.org/blog/index.php?pk=238898&T=4

[TABLE]
[ROW][C]Maximum Density Values[/C][/ROW]
[ROW][C]Kernel[/C][C]x-value[/C][C]max. density[/C][/ROW]
[ROW][C]Gaussian[/C][C]0.50901946940987[/C][C]21.0873214884916[/C][/ROW]
[ROW][C]Epanechnikov[/C][C]0.5095841079063[/C][C]21.3130293361502[/C][/ROW]
[ROW][C]Rectangular[/C][C]0.501114530459859[/C][C]21.0618699982749[/C][/ROW]
[ROW][C]Triangular[/C][C]0.510148746402729[/C][C]23.0747066451144[/C][/ROW]
[ROW][C]Biweight[/C][C]0.508454830913441[/C][C]21.0015696150116[/C][/ROW]
[ROW][C]Cosine[/C][C]0.508454830913441[/C][C]21.0053882071718[/C][/ROW]
[ROW][C]Optcosine[/C][C]0.509301788658085[/C][C]21.2619632850679[/C][/ROW]
 [/TABLE]
Source: https://freestatistics.org/blog/index.php?pk=238898&T=4

Globally Unique Identifier (entire table): ba.freestatistics.org/blog/index.php?pk=238898&T=4

As an alternative you can also use a QR Code:  

The GUIDs for individual cells are displayed in the table below:

Maximum Density Values
Kernelx-valuemax. density
Gaussian0.5090194694098721.0873214884916
Epanechnikov0.509584107906321.3130293361502
Rectangular0.50111453045985921.0618699982749
Triangular0.51014874640272923.0747066451144
Biweight0.50845483091344121.0015696150116
Cosine0.50845483091344121.0053882071718
Optcosine0.50930178865808521.2619632850679


Maximum Density Values
Kernelx-valuemax. density
Gaussian0.5090194694098721.0873214884916
Epanechnikov0.509584107906321.3130293361502
Rectangular0.50139684970807421.0618699982749
Triangular0.51014874640272923.0747066451144
Biweight0.50845483091344121.0015696150116
Cosine0.50845483091344121.0053882071718
Optcosine0.50930178865808521.2619632850679

\begin{tabular}{lllllllll}
\hline
Maximum Density Values \tabularnewline
Kernel & x-value & max. density \tabularnewline
Gaussian & 0.50901946940987 & 21.0873214884916 \tabularnewline
Epanechnikov & 0.5095841079063 & 21.3130293361502 \tabularnewline
Rectangular & 0.501396849708074 & 21.0618699982749 \tabularnewline
Triangular & 0.510148746402729 & 23.0747066451144 \tabularnewline
Biweight & 0.508454830913441 & 21.0015696150116 \tabularnewline
Cosine & 0.508454830913441 & 21.0053882071718 \tabularnewline
Optcosine & 0.509301788658085 & 21.2619632850679 \tabularnewline
 \hline
\end{tabular}
%Source: https://freestatistics.org/blog/index.php?pk=238898&T=5

[TABLE]
[ROW][C]Maximum Density Values[/C][/ROW]
[ROW][C]Kernel[/C][C]x-value[/C][C]max. density[/C][/ROW]
[ROW][C]Gaussian[/C][C]0.50901946940987[/C][C]21.0873214884916[/C][/ROW]
[ROW][C]Epanechnikov[/C][C]0.5095841079063[/C][C]21.3130293361502[/C][/ROW]
[ROW][C]Rectangular[/C][C]0.501396849708074[/C][C]21.0618699982749[/C][/ROW]
[ROW][C]Triangular[/C][C]0.510148746402729[/C][C]23.0747066451144[/C][/ROW]
[ROW][C]Biweight[/C][C]0.508454830913441[/C][C]21.0015696150116[/C][/ROW]
[ROW][C]Cosine[/C][C]0.508454830913441[/C][C]21.0053882071718[/C][/ROW]
[ROW][C]Optcosine[/C][C]0.509301788658085[/C][C]21.2619632850679[/C][/ROW]
 [/TABLE]
Source: https://freestatistics.org/blog/index.php?pk=238898&T=5

Globally Unique Identifier (entire table): ba.freestatistics.org/blog/index.php?pk=238898&T=5

As an alternative you can also use a QR Code:  

The GUIDs for individual cells are displayed in the table below:

Maximum Density Values
Kernelx-valuemax. density
Gaussian0.5090194694098721.0873214884916
Epanechnikov0.509584107906321.3130293361502
Rectangular0.50139684970807421.0618699982749
Triangular0.51014874640272923.0747066451144
Biweight0.50845483091344121.0015696150116
Cosine0.50845483091344121.0053882071718
Optcosine0.50930178865808521.2619632850679


Maximum Density Values
Kernelx-valuemax. density
Gaussian0.5090194694098721.0873214884916
Epanechnikov0.509584107906321.3130293361502
Rectangular0.50167916895628821.0618699982749
Triangular0.51014874640272923.0747066451144
Biweight0.50845483091344121.0015696150116
Cosine0.50845483091344121.0053882071718
Optcosine0.50930178865808521.2619632850679

\begin{tabular}{lllllllll}
\hline
Maximum Density Values \tabularnewline
Kernel & x-value & max. density \tabularnewline
Gaussian & 0.50901946940987 & 21.0873214884916 \tabularnewline
Epanechnikov & 0.5095841079063 & 21.3130293361502 \tabularnewline
Rectangular & 0.501679168956288 & 21.0618699982749 \tabularnewline
Triangular & 0.510148746402729 & 23.0747066451144 \tabularnewline
Biweight & 0.508454830913441 & 21.0015696150116 \tabularnewline
Cosine & 0.508454830913441 & 21.0053882071718 \tabularnewline
Optcosine & 0.509301788658085 & 21.2619632850679 \tabularnewline
 \hline
\end{tabular}
%Source: https://freestatistics.org/blog/index.php?pk=238898&T=6

[TABLE]
[ROW][C]Maximum Density Values[/C][/ROW]
[ROW][C]Kernel[/C][C]x-value[/C][C]max. density[/C][/ROW]
[ROW][C]Gaussian[/C][C]0.50901946940987[/C][C]21.0873214884916[/C][/ROW]
[ROW][C]Epanechnikov[/C][C]0.5095841079063[/C][C]21.3130293361502[/C][/ROW]
[ROW][C]Rectangular[/C][C]0.501679168956288[/C][C]21.0618699982749[/C][/ROW]
[ROW][C]Triangular[/C][C]0.510148746402729[/C][C]23.0747066451144[/C][/ROW]
[ROW][C]Biweight[/C][C]0.508454830913441[/C][C]21.0015696150116[/C][/ROW]
[ROW][C]Cosine[/C][C]0.508454830913441[/C][C]21.0053882071718[/C][/ROW]
[ROW][C]Optcosine[/C][C]0.509301788658085[/C][C]21.2619632850679[/C][/ROW]
 [/TABLE]
Source: https://freestatistics.org/blog/index.php?pk=238898&T=6

Globally Unique Identifier (entire table): ba.freestatistics.org/blog/index.php?pk=238898&T=6

As an alternative you can also use a QR Code:  

The GUIDs for individual cells are displayed in the table below:

Maximum Density Values
Kernelx-valuemax. density
Gaussian0.5090194694098721.0873214884916
Epanechnikov0.509584107906321.3130293361502
Rectangular0.50167916895628821.0618699982749
Triangular0.51014874640272923.0747066451144
Biweight0.50845483091344121.0015696150116
Cosine0.50845483091344121.0053882071718
Optcosine0.50930178865808521.2619632850679


Maximum Density Values
Kernelx-valuemax. density
Gaussian0.5090194694098721.0873214884916
Epanechnikov0.509584107906321.3130293361502
Rectangular0.50196148820450321.0618699982749
Triangular0.51014874640272923.0747066451144
Biweight0.50845483091344121.0015696150116
Cosine0.50845483091344121.0053882071718
Optcosine0.50930178865808521.2619632850679

\begin{tabular}{lllllllll}
\hline
Maximum Density Values \tabularnewline
Kernel & x-value & max. density \tabularnewline
Gaussian & 0.50901946940987 & 21.0873214884916 \tabularnewline
Epanechnikov & 0.5095841079063 & 21.3130293361502 \tabularnewline
Rectangular & 0.501961488204503 & 21.0618699982749 \tabularnewline
Triangular & 0.510148746402729 & 23.0747066451144 \tabularnewline
Biweight & 0.508454830913441 & 21.0015696150116 \tabularnewline
Cosine & 0.508454830913441 & 21.0053882071718 \tabularnewline
Optcosine & 0.509301788658085 & 21.2619632850679 \tabularnewline
 \hline
\end{tabular}
%Source: https://freestatistics.org/blog/index.php?pk=238898&T=7

[TABLE]
[ROW][C]Maximum Density Values[/C][/ROW]
[ROW][C]Kernel[/C][C]x-value[/C][C]max. density[/C][/ROW]
[ROW][C]Gaussian[/C][C]0.50901946940987[/C][C]21.0873214884916[/C][/ROW]
[ROW][C]Epanechnikov[/C][C]0.5095841079063[/C][C]21.3130293361502[/C][/ROW]
[ROW][C]Rectangular[/C][C]0.501961488204503[/C][C]21.0618699982749[/C][/ROW]
[ROW][C]Triangular[/C][C]0.510148746402729[/C][C]23.0747066451144[/C][/ROW]
[ROW][C]Biweight[/C][C]0.508454830913441[/C][C]21.0015696150116[/C][/ROW]
[ROW][C]Cosine[/C][C]0.508454830913441[/C][C]21.0053882071718[/C][/ROW]
[ROW][C]Optcosine[/C][C]0.509301788658085[/C][C]21.2619632850679[/C][/ROW]
 [/TABLE]
Source: https://freestatistics.org/blog/index.php?pk=238898&T=7

Globally Unique Identifier (entire table): ba.freestatistics.org/blog/index.php?pk=238898&T=7

As an alternative you can also use a QR Code:  

The GUIDs for individual cells are displayed in the table below:

Maximum Density Values
Kernelx-valuemax. density
Gaussian0.5090194694098721.0873214884916
Epanechnikov0.509584107906321.3130293361502
Rectangular0.50196148820450321.0618699982749
Triangular0.51014874640272923.0747066451144
Biweight0.50845483091344121.0015696150116
Cosine0.50845483091344121.0053882071718
Optcosine0.50930178865808521.2619632850679


Maximum Density Values
Kernelx-valuemax. density
Gaussian0.5090194694098721.0873214884916
Epanechnikov0.509584107906321.3130293361502
Rectangular0.50563163843129421.0618699982749
Triangular0.51014874640272923.0747066451144
Biweight0.50845483091344121.0015696150116
Cosine0.50845483091344121.0053882071718
Optcosine0.50930178865808521.2619632850679

\begin{tabular}{lllllllll}
\hline
Maximum Density Values \tabularnewline
Kernel & x-value & max. density \tabularnewline
Gaussian & 0.50901946940987 & 21.0873214884916 \tabularnewline
Epanechnikov & 0.5095841079063 & 21.3130293361502 \tabularnewline
Rectangular & 0.505631638431294 & 21.0618699982749 \tabularnewline
Triangular & 0.510148746402729 & 23.0747066451144 \tabularnewline
Biweight & 0.508454830913441 & 21.0015696150116 \tabularnewline
Cosine & 0.508454830913441 & 21.0053882071718 \tabularnewline
Optcosine & 0.509301788658085 & 21.2619632850679 \tabularnewline
 \hline
\end{tabular}
%Source: https://freestatistics.org/blog/index.php?pk=238898&T=8

[TABLE]
[ROW][C]Maximum Density Values[/C][/ROW]
[ROW][C]Kernel[/C][C]x-value[/C][C]max. density[/C][/ROW]
[ROW][C]Gaussian[/C][C]0.50901946940987[/C][C]21.0873214884916[/C][/ROW]
[ROW][C]Epanechnikov[/C][C]0.5095841079063[/C][C]21.3130293361502[/C][/ROW]
[ROW][C]Rectangular[/C][C]0.505631638431294[/C][C]21.0618699982749[/C][/ROW]
[ROW][C]Triangular[/C][C]0.510148746402729[/C][C]23.0747066451144[/C][/ROW]
[ROW][C]Biweight[/C][C]0.508454830913441[/C][C]21.0015696150116[/C][/ROW]
[ROW][C]Cosine[/C][C]0.508454830913441[/C][C]21.0053882071718[/C][/ROW]
[ROW][C]Optcosine[/C][C]0.509301788658085[/C][C]21.2619632850679[/C][/ROW]
 [/TABLE]
Source: https://freestatistics.org/blog/index.php?pk=238898&T=8

Globally Unique Identifier (entire table): ba.freestatistics.org/blog/index.php?pk=238898&T=8

As an alternative you can also use a QR Code:  

The GUIDs for individual cells are displayed in the table below:

Maximum Density Values
Kernelx-valuemax. density
Gaussian0.5090194694098721.0873214884916
Epanechnikov0.509584107906321.3130293361502
Rectangular0.50563163843129421.0618699982749
Triangular0.51014874640272923.0747066451144
Biweight0.50845483091344121.0015696150116
Cosine0.50845483091344121.0053882071718
Optcosine0.50930178865808521.2619632850679


Maximum Density Values
Kernelx-valuemax. density
Gaussian0.5090194694098721.0873214884916
Epanechnikov0.509584107906321.3130293361502
Rectangular0.50591395767950921.0618699982749
Triangular0.51014874640272923.0747066451144
Biweight0.50845483091344121.0015696150116
Cosine0.50845483091344121.0053882071718
Optcosine0.50930178865808521.2619632850679

\begin{tabular}{lllllllll}
\hline
Maximum Density Values \tabularnewline
Kernel & x-value & max. density \tabularnewline
Gaussian & 0.50901946940987 & 21.0873214884916 \tabularnewline
Epanechnikov & 0.5095841079063 & 21.3130293361502 \tabularnewline
Rectangular & 0.505913957679509 & 21.0618699982749 \tabularnewline
Triangular & 0.510148746402729 & 23.0747066451144 \tabularnewline
Biweight & 0.508454830913441 & 21.0015696150116 \tabularnewline
Cosine & 0.508454830913441 & 21.0053882071718 \tabularnewline
Optcosine & 0.509301788658085 & 21.2619632850679 \tabularnewline
 \hline
\end{tabular}
%Source: https://freestatistics.org/blog/index.php?pk=238898&T=9

[TABLE]
[ROW][C]Maximum Density Values[/C][/ROW]
[ROW][C]Kernel[/C][C]x-value[/C][C]max. density[/C][/ROW]
[ROW][C]Gaussian[/C][C]0.50901946940987[/C][C]21.0873214884916[/C][/ROW]
[ROW][C]Epanechnikov[/C][C]0.5095841079063[/C][C]21.3130293361502[/C][/ROW]
[ROW][C]Rectangular[/C][C]0.505913957679509[/C][C]21.0618699982749[/C][/ROW]
[ROW][C]Triangular[/C][C]0.510148746402729[/C][C]23.0747066451144[/C][/ROW]
[ROW][C]Biweight[/C][C]0.508454830913441[/C][C]21.0015696150116[/C][/ROW]
[ROW][C]Cosine[/C][C]0.508454830913441[/C][C]21.0053882071718[/C][/ROW]
[ROW][C]Optcosine[/C][C]0.509301788658085[/C][C]21.2619632850679[/C][/ROW]
 [/TABLE]
Source: https://freestatistics.org/blog/index.php?pk=238898&T=9

Globally Unique Identifier (entire table): ba.freestatistics.org/blog/index.php?pk=238898&T=9

As an alternative you can also use a QR Code:  

The GUIDs for individual cells are displayed in the table below:

Maximum Density Values
Kernelx-valuemax. density
Gaussian0.5090194694098721.0873214884916
Epanechnikov0.509584107906321.3130293361502
Rectangular0.50591395767950921.0618699982749
Triangular0.51014874640272923.0747066451144
Biweight0.50845483091344121.0015696150116
Cosine0.50845483091344121.0053882071718
Optcosine0.50930178865808521.2619632850679


Maximum Density Values
Kernelx-valuemax. density
Gaussian0.5090194694098721.0873214884916
Epanechnikov0.509584107906321.3130293361502
Rectangular0.50619627692772421.0618699982749
Triangular0.51014874640272923.0747066451144
Biweight0.50845483091344121.0015696150116
Cosine0.50845483091344121.0053882071718
Optcosine0.50930178865808521.2619632850679

\begin{tabular}{lllllllll}
\hline
Maximum Density Values \tabularnewline
Kernel & x-value & max. density \tabularnewline
Gaussian & 0.50901946940987 & 21.0873214884916 \tabularnewline
Epanechnikov & 0.5095841079063 & 21.3130293361502 \tabularnewline
Rectangular & 0.506196276927724 & 21.0618699982749 \tabularnewline
Triangular & 0.510148746402729 & 23.0747066451144 \tabularnewline
Biweight & 0.508454830913441 & 21.0015696150116 \tabularnewline
Cosine & 0.508454830913441 & 21.0053882071718 \tabularnewline
Optcosine & 0.509301788658085 & 21.2619632850679 \tabularnewline
 \hline
\end{tabular}
%Source: https://freestatistics.org/blog/index.php?pk=238898&T=10

[TABLE]
[ROW][C]Maximum Density Values[/C][/ROW]
[ROW][C]Kernel[/C][C]x-value[/C][C]max. density[/C][/ROW]
[ROW][C]Gaussian[/C][C]0.50901946940987[/C][C]21.0873214884916[/C][/ROW]
[ROW][C]Epanechnikov[/C][C]0.5095841079063[/C][C]21.3130293361502[/C][/ROW]
[ROW][C]Rectangular[/C][C]0.506196276927724[/C][C]21.0618699982749[/C][/ROW]
[ROW][C]Triangular[/C][C]0.510148746402729[/C][C]23.0747066451144[/C][/ROW]
[ROW][C]Biweight[/C][C]0.508454830913441[/C][C]21.0015696150116[/C][/ROW]
[ROW][C]Cosine[/C][C]0.508454830913441[/C][C]21.0053882071718[/C][/ROW]
[ROW][C]Optcosine[/C][C]0.509301788658085[/C][C]21.2619632850679[/C][/ROW]
 [/TABLE]
Source: https://freestatistics.org/blog/index.php?pk=238898&T=10

Globally Unique Identifier (entire table): ba.freestatistics.org/blog/index.php?pk=238898&T=10

As an alternative you can also use a QR Code:  

The GUIDs for individual cells are displayed in the table below:

Maximum Density Values
Kernelx-valuemax. density
Gaussian0.5090194694098721.0873214884916
Epanechnikov0.509584107906321.3130293361502
Rectangular0.50619627692772421.0618699982749
Triangular0.51014874640272923.0747066451144
Biweight0.50845483091344121.0015696150116
Cosine0.50845483091344121.0053882071718
Optcosine0.50930178865808521.2619632850679


Maximum Density Values
Kernelx-valuemax. density
Gaussian0.5090194694098721.0873214884916
Epanechnikov0.509584107906321.3130293361502
Rectangular0.50647859617593821.0618699982749
Triangular0.51014874640272923.0747066451144
Biweight0.50845483091344121.0015696150116
Cosine0.50845483091344121.0053882071718
Optcosine0.50930178865808521.2619632850679

\begin{tabular}{lllllllll}
\hline
Maximum Density Values \tabularnewline
Kernel & x-value & max. density \tabularnewline
Gaussian & 0.50901946940987 & 21.0873214884916 \tabularnewline
Epanechnikov & 0.5095841079063 & 21.3130293361502 \tabularnewline
Rectangular & 0.506478596175938 & 21.0618699982749 \tabularnewline
Triangular & 0.510148746402729 & 23.0747066451144 \tabularnewline
Biweight & 0.508454830913441 & 21.0015696150116 \tabularnewline
Cosine & 0.508454830913441 & 21.0053882071718 \tabularnewline
Optcosine & 0.509301788658085 & 21.2619632850679 \tabularnewline
 \hline
\end{tabular}
%Source: https://freestatistics.org/blog/index.php?pk=238898&T=11

[TABLE]
[ROW][C]Maximum Density Values[/C][/ROW]
[ROW][C]Kernel[/C][C]x-value[/C][C]max. density[/C][/ROW]
[ROW][C]Gaussian[/C][C]0.50901946940987[/C][C]21.0873214884916[/C][/ROW]
[ROW][C]Epanechnikov[/C][C]0.5095841079063[/C][C]21.3130293361502[/C][/ROW]
[ROW][C]Rectangular[/C][C]0.506478596175938[/C][C]21.0618699982749[/C][/ROW]
[ROW][C]Triangular[/C][C]0.510148746402729[/C][C]23.0747066451144[/C][/ROW]
[ROW][C]Biweight[/C][C]0.508454830913441[/C][C]21.0015696150116[/C][/ROW]
[ROW][C]Cosine[/C][C]0.508454830913441[/C][C]21.0053882071718[/C][/ROW]
[ROW][C]Optcosine[/C][C]0.509301788658085[/C][C]21.2619632850679[/C][/ROW]
 [/TABLE]
Source: https://freestatistics.org/blog/index.php?pk=238898&T=11

Globally Unique Identifier (entire table): ba.freestatistics.org/blog/index.php?pk=238898&T=11

As an alternative you can also use a QR Code:  

The GUIDs for individual cells are displayed in the table below:

Maximum Density Values
Kernelx-valuemax. density
Gaussian0.5090194694098721.0873214884916
Epanechnikov0.509584107906321.3130293361502
Rectangular0.50647859617593821.0618699982749
Triangular0.51014874640272923.0747066451144
Biweight0.50845483091344121.0015696150116
Cosine0.50845483091344121.0053882071718
Optcosine0.50930178865808521.2619632850679


Maximum Density Values
Kernelx-valuemax. density
Gaussian0.5090194694098721.0873214884916
Epanechnikov0.509584107906321.3130293361502
Rectangular0.50676091542415321.0618699982749
Triangular0.51014874640272923.0747066451144
Biweight0.50845483091344121.0015696150116
Cosine0.50845483091344121.0053882071718
Optcosine0.50930178865808521.2619632850679

\begin{tabular}{lllllllll}
\hline
Maximum Density Values \tabularnewline
Kernel & x-value & max. density \tabularnewline
Gaussian & 0.50901946940987 & 21.0873214884916 \tabularnewline
Epanechnikov & 0.5095841079063 & 21.3130293361502 \tabularnewline
Rectangular & 0.506760915424153 & 21.0618699982749 \tabularnewline
Triangular & 0.510148746402729 & 23.0747066451144 \tabularnewline
Biweight & 0.508454830913441 & 21.0015696150116 \tabularnewline
Cosine & 0.508454830913441 & 21.0053882071718 \tabularnewline
Optcosine & 0.509301788658085 & 21.2619632850679 \tabularnewline
 \hline
\end{tabular}
%Source: https://freestatistics.org/blog/index.php?pk=238898&T=12

[TABLE]
[ROW][C]Maximum Density Values[/C][/ROW]
[ROW][C]Kernel[/C][C]x-value[/C][C]max. density[/C][/ROW]
[ROW][C]Gaussian[/C][C]0.50901946940987[/C][C]21.0873214884916[/C][/ROW]
[ROW][C]Epanechnikov[/C][C]0.5095841079063[/C][C]21.3130293361502[/C][/ROW]
[ROW][C]Rectangular[/C][C]0.506760915424153[/C][C]21.0618699982749[/C][/ROW]
[ROW][C]Triangular[/C][C]0.510148746402729[/C][C]23.0747066451144[/C][/ROW]
[ROW][C]Biweight[/C][C]0.508454830913441[/C][C]21.0015696150116[/C][/ROW]
[ROW][C]Cosine[/C][C]0.508454830913441[/C][C]21.0053882071718[/C][/ROW]
[ROW][C]Optcosine[/C][C]0.509301788658085[/C][C]21.2619632850679[/C][/ROW]
 [/TABLE]
Source: https://freestatistics.org/blog/index.php?pk=238898&T=12

Globally Unique Identifier (entire table): ba.freestatistics.org/blog/index.php?pk=238898&T=12

As an alternative you can also use a QR Code:  

The GUIDs for individual cells are displayed in the table below:

Maximum Density Values
Kernelx-valuemax. density
Gaussian0.5090194694098721.0873214884916
Epanechnikov0.509584107906321.3130293361502
Rectangular0.50676091542415321.0618699982749
Triangular0.51014874640272923.0747066451144
Biweight0.50845483091344121.0015696150116
Cosine0.50845483091344121.0053882071718
Optcosine0.50930178865808521.2619632850679


Maximum Density Values
Kernelx-valuemax. density
Gaussian0.5090194694098721.0873214884916
Epanechnikov0.509584107906321.3130293361502
Rectangular0.50704323467236821.0618699982749
Triangular0.51014874640272923.0747066451144
Biweight0.50845483091344121.0015696150116
Cosine0.50845483091344121.0053882071718
Optcosine0.50930178865808521.2619632850679

\begin{tabular}{lllllllll}
\hline
Maximum Density Values \tabularnewline
Kernel & x-value & max. density \tabularnewline
Gaussian & 0.50901946940987 & 21.0873214884916 \tabularnewline
Epanechnikov & 0.5095841079063 & 21.3130293361502 \tabularnewline
Rectangular & 0.507043234672368 & 21.0618699982749 \tabularnewline
Triangular & 0.510148746402729 & 23.0747066451144 \tabularnewline
Biweight & 0.508454830913441 & 21.0015696150116 \tabularnewline
Cosine & 0.508454830913441 & 21.0053882071718 \tabularnewline
Optcosine & 0.509301788658085 & 21.2619632850679 \tabularnewline
 \hline
\end{tabular}
%Source: https://freestatistics.org/blog/index.php?pk=238898&T=13

[TABLE]
[ROW][C]Maximum Density Values[/C][/ROW]
[ROW][C]Kernel[/C][C]x-value[/C][C]max. density[/C][/ROW]
[ROW][C]Gaussian[/C][C]0.50901946940987[/C][C]21.0873214884916[/C][/ROW]
[ROW][C]Epanechnikov[/C][C]0.5095841079063[/C][C]21.3130293361502[/C][/ROW]
[ROW][C]Rectangular[/C][C]0.507043234672368[/C][C]21.0618699982749[/C][/ROW]
[ROW][C]Triangular[/C][C]0.510148746402729[/C][C]23.0747066451144[/C][/ROW]
[ROW][C]Biweight[/C][C]0.508454830913441[/C][C]21.0015696150116[/C][/ROW]
[ROW][C]Cosine[/C][C]0.508454830913441[/C][C]21.0053882071718[/C][/ROW]
[ROW][C]Optcosine[/C][C]0.509301788658085[/C][C]21.2619632850679[/C][/ROW]
 [/TABLE]
Source: https://freestatistics.org/blog/index.php?pk=238898&T=13

Globally Unique Identifier (entire table): ba.freestatistics.org/blog/index.php?pk=238898&T=13

As an alternative you can also use a QR Code:  

The GUIDs for individual cells are displayed in the table below:

Maximum Density Values
Kernelx-valuemax. density
Gaussian0.5090194694098721.0873214884916
Epanechnikov0.509584107906321.3130293361502
Rectangular0.50704323467236821.0618699982749
Triangular0.51014874640272923.0747066451144
Biweight0.50845483091344121.0015696150116
Cosine0.50845483091344121.0053882071718
Optcosine0.50930178865808521.2619632850679


Maximum Density Values
Kernelx-valuemax. density
Gaussian0.5090194694098721.0873214884916
Epanechnikov0.509584107906321.3130293361502
Rectangular0.50732555392058221.0618699982749
Triangular0.51014874640272923.0747066451144
Biweight0.50845483091344121.0015696150116
Cosine0.50845483091344121.0053882071718
Optcosine0.50930178865808521.2619632850679

\begin{tabular}{lllllllll}
\hline
Maximum Density Values \tabularnewline
Kernel & x-value & max. density \tabularnewline
Gaussian & 0.50901946940987 & 21.0873214884916 \tabularnewline
Epanechnikov & 0.5095841079063 & 21.3130293361502 \tabularnewline
Rectangular & 0.507325553920582 & 21.0618699982749 \tabularnewline
Triangular & 0.510148746402729 & 23.0747066451144 \tabularnewline
Biweight & 0.508454830913441 & 21.0015696150116 \tabularnewline
Cosine & 0.508454830913441 & 21.0053882071718 \tabularnewline
Optcosine & 0.509301788658085 & 21.2619632850679 \tabularnewline
 \hline
\end{tabular}
%Source: https://freestatistics.org/blog/index.php?pk=238898&T=14

[TABLE]
[ROW][C]Maximum Density Values[/C][/ROW]
[ROW][C]Kernel[/C][C]x-value[/C][C]max. density[/C][/ROW]
[ROW][C]Gaussian[/C][C]0.50901946940987[/C][C]21.0873214884916[/C][/ROW]
[ROW][C]Epanechnikov[/C][C]0.5095841079063[/C][C]21.3130293361502[/C][/ROW]
[ROW][C]Rectangular[/C][C]0.507325553920582[/C][C]21.0618699982749[/C][/ROW]
[ROW][C]Triangular[/C][C]0.510148746402729[/C][C]23.0747066451144[/C][/ROW]
[ROW][C]Biweight[/C][C]0.508454830913441[/C][C]21.0015696150116[/C][/ROW]
[ROW][C]Cosine[/C][C]0.508454830913441[/C][C]21.0053882071718[/C][/ROW]
[ROW][C]Optcosine[/C][C]0.509301788658085[/C][C]21.2619632850679[/C][/ROW]
 [/TABLE]
Source: https://freestatistics.org/blog/index.php?pk=238898&T=14

Globally Unique Identifier (entire table): ba.freestatistics.org/blog/index.php?pk=238898&T=14

As an alternative you can also use a QR Code:  

The GUIDs for individual cells are displayed in the table below:

Maximum Density Values
Kernelx-valuemax. density
Gaussian0.5090194694098721.0873214884916
Epanechnikov0.509584107906321.3130293361502
Rectangular0.50732555392058221.0618699982749
Triangular0.51014874640272923.0747066451144
Biweight0.50845483091344121.0015696150116
Cosine0.50845483091344121.0053882071718
Optcosine0.50930178865808521.2619632850679


Maximum Density Values
Kernelx-valuemax. density
Gaussian0.5090194694098721.0873214884916
Epanechnikov0.509584107906321.3130293361502
Rectangular0.50789019241701221.0618699982749
Triangular0.51014874640272923.0747066451144
Biweight0.50845483091344121.0015696150116
Cosine0.50845483091344121.0053882071718
Optcosine0.50930178865808521.2619632850679

\begin{tabular}{lllllllll}
\hline
Maximum Density Values \tabularnewline
Kernel & x-value & max. density \tabularnewline
Gaussian & 0.50901946940987 & 21.0873214884916 \tabularnewline
Epanechnikov & 0.5095841079063 & 21.3130293361502 \tabularnewline
Rectangular & 0.507890192417012 & 21.0618699982749 \tabularnewline
Triangular & 0.510148746402729 & 23.0747066451144 \tabularnewline
Biweight & 0.508454830913441 & 21.0015696150116 \tabularnewline
Cosine & 0.508454830913441 & 21.0053882071718 \tabularnewline
Optcosine & 0.509301788658085 & 21.2619632850679 \tabularnewline
 \hline
\end{tabular}
%Source: https://freestatistics.org/blog/index.php?pk=238898&T=15

[TABLE]
[ROW][C]Maximum Density Values[/C][/ROW]
[ROW][C]Kernel[/C][C]x-value[/C][C]max. density[/C][/ROW]
[ROW][C]Gaussian[/C][C]0.50901946940987[/C][C]21.0873214884916[/C][/ROW]
[ROW][C]Epanechnikov[/C][C]0.5095841079063[/C][C]21.3130293361502[/C][/ROW]
[ROW][C]Rectangular[/C][C]0.507890192417012[/C][C]21.0618699982749[/C][/ROW]
[ROW][C]Triangular[/C][C]0.510148746402729[/C][C]23.0747066451144[/C][/ROW]
[ROW][C]Biweight[/C][C]0.508454830913441[/C][C]21.0015696150116[/C][/ROW]
[ROW][C]Cosine[/C][C]0.508454830913441[/C][C]21.0053882071718[/C][/ROW]
[ROW][C]Optcosine[/C][C]0.509301788658085[/C][C]21.2619632850679[/C][/ROW]
 [/TABLE]
Source: https://freestatistics.org/blog/index.php?pk=238898&T=15

Globally Unique Identifier (entire table): ba.freestatistics.org/blog/index.php?pk=238898&T=15

As an alternative you can also use a QR Code:  

The GUIDs for individual cells are displayed in the table below:

Maximum Density Values
Kernelx-valuemax. density
Gaussian0.5090194694098721.0873214884916
Epanechnikov0.509584107906321.3130293361502
Rectangular0.50789019241701221.0618699982749
Triangular0.51014874640272923.0747066451144
Biweight0.50845483091344121.0015696150116
Cosine0.50845483091344121.0053882071718
Optcosine0.50930178865808521.2619632850679


Maximum Density Values
Kernelx-valuemax. density
Gaussian0.5090194694098721.0873214884916
Epanechnikov0.509584107906321.3130293361502
Rectangular0.50817251166522621.0618699982749
Triangular0.51014874640272923.0747066451144
Biweight0.50845483091344121.0015696150116
Cosine0.50845483091344121.0053882071718
Optcosine0.50930178865808521.2619632850679

\begin{tabular}{lllllllll}
\hline
Maximum Density Values \tabularnewline
Kernel & x-value & max. density \tabularnewline
Gaussian & 0.50901946940987 & 21.0873214884916 \tabularnewline
Epanechnikov & 0.5095841079063 & 21.3130293361502 \tabularnewline
Rectangular & 0.508172511665226 & 21.0618699982749 \tabularnewline
Triangular & 0.510148746402729 & 23.0747066451144 \tabularnewline
Biweight & 0.508454830913441 & 21.0015696150116 \tabularnewline
Cosine & 0.508454830913441 & 21.0053882071718 \tabularnewline
Optcosine & 0.509301788658085 & 21.2619632850679 \tabularnewline
 \hline
\end{tabular}
%Source: https://freestatistics.org/blog/index.php?pk=238898&T=16

[TABLE]
[ROW][C]Maximum Density Values[/C][/ROW]
[ROW][C]Kernel[/C][C]x-value[/C][C]max. density[/C][/ROW]
[ROW][C]Gaussian[/C][C]0.50901946940987[/C][C]21.0873214884916[/C][/ROW]
[ROW][C]Epanechnikov[/C][C]0.5095841079063[/C][C]21.3130293361502[/C][/ROW]
[ROW][C]Rectangular[/C][C]0.508172511665226[/C][C]21.0618699982749[/C][/ROW]
[ROW][C]Triangular[/C][C]0.510148746402729[/C][C]23.0747066451144[/C][/ROW]
[ROW][C]Biweight[/C][C]0.508454830913441[/C][C]21.0015696150116[/C][/ROW]
[ROW][C]Cosine[/C][C]0.508454830913441[/C][C]21.0053882071718[/C][/ROW]
[ROW][C]Optcosine[/C][C]0.509301788658085[/C][C]21.2619632850679[/C][/ROW]
 [/TABLE]
Source: https://freestatistics.org/blog/index.php?pk=238898&T=16

Globally Unique Identifier (entire table): ba.freestatistics.org/blog/index.php?pk=238898&T=16

As an alternative you can also use a QR Code:  

The GUIDs for individual cells are displayed in the table below:

Maximum Density Values
Kernelx-valuemax. density
Gaussian0.5090194694098721.0873214884916
Epanechnikov0.509584107906321.3130293361502
Rectangular0.50817251166522621.0618699982749
Triangular0.51014874640272923.0747066451144
Biweight0.50845483091344121.0015696150116
Cosine0.50845483091344121.0053882071718
Optcosine0.50930178865808521.2619632850679


Maximum Density Values
Kernelx-valuemax. density
Gaussian0.5090194694098721.0873214884916
Epanechnikov0.509584107906321.3130293361502
Rectangular0.50845483091344121.0618699982749
Triangular0.51014874640272923.0747066451144
Biweight0.50845483091344121.0015696150116
Cosine0.50845483091344121.0053882071718
Optcosine0.50930178865808521.2619632850679

\begin{tabular}{lllllllll}
\hline
Maximum Density Values \tabularnewline
Kernel & x-value & max. density \tabularnewline
Gaussian & 0.50901946940987 & 21.0873214884916 \tabularnewline
Epanechnikov & 0.5095841079063 & 21.3130293361502 \tabularnewline
Rectangular & 0.508454830913441 & 21.0618699982749 \tabularnewline
Triangular & 0.510148746402729 & 23.0747066451144 \tabularnewline
Biweight & 0.508454830913441 & 21.0015696150116 \tabularnewline
Cosine & 0.508454830913441 & 21.0053882071718 \tabularnewline
Optcosine & 0.509301788658085 & 21.2619632850679 \tabularnewline
\hline
\end{tabular}
%Source: https://freestatistics.org/blog/index.php?pk=238898&T=17

[TABLE]
[ROW][C]Maximum Density Values[/C][/ROW]
[ROW][C]Kernel[/C][C]x-value[/C][C]max. density[/C][/ROW]
[ROW][C]Gaussian[/C][C]0.50901946940987[/C][C]21.0873214884916[/C][/ROW]
[ROW][C]Epanechnikov[/C][C]0.5095841079063[/C][C]21.3130293361502[/C][/ROW]
[ROW][C]Rectangular[/C][C]0.508454830913441[/C][C]21.0618699982749[/C][/ROW]
[ROW][C]Triangular[/C][C]0.510148746402729[/C][C]23.0747066451144[/C][/ROW]
[ROW][C]Biweight[/C][C]0.508454830913441[/C][C]21.0015696150116[/C][/ROW]
[ROW][C]Cosine[/C][C]0.508454830913441[/C][C]21.0053882071718[/C][/ROW]
[ROW][C]Optcosine[/C][C]0.509301788658085[/C][C]21.2619632850679[/C][/ROW]
[/TABLE]
Source: https://freestatistics.org/blog/index.php?pk=238898&T=17

Globally Unique Identifier (entire table): ba.freestatistics.org/blog/index.php?pk=238898&T=17

As an alternative you can also use a QR Code:  

The GUIDs for individual cells are displayed in the table below:

Maximum Density Values
Kernelx-valuemax. density
Gaussian0.5090194694098721.0873214884916
Epanechnikov0.509584107906321.3130293361502
Rectangular0.50845483091344121.0618699982749
Triangular0.51014874640272923.0747066451144
Biweight0.50845483091344121.0015696150116
Cosine0.50845483091344121.0053882071718
Optcosine0.50930178865808521.2619632850679


Parameters (Session):
par1 = 0 ; par2 = no ; par3 = 512 ;
Parameters (R input):
par1 = 0 ; par2 = no ; par3 = 512 ;
R code (references can be found in the software module):
par3 <- '512'
par2 <- 'no'
par1 <- '0'
if (par1 == '0') bw <- 'nrd0'
if (par1 != '0') bw <- as.numeric(par1)
par3 <- as.numeric(par3)
mydensity <- array(NA, dim=c(par3,8))
bitmap(file='density1.png')
mydensity1<-density(x,bw=bw,kernel='gaussian',na.rm=TRUE)
mydensity[,8] = signif(mydensity1$x,3)
mydensity[,1] = signif(mydensity1$y,3)
plot(mydensity1,main='Gaussian Kernel',xlab=xlab,ylab=ylab)
grid()
dev.off()
mydensity1
bitmap(file='density2.png')
mydensity2<-density(x,bw=bw,kernel='epanechnikov',na.rm=TRUE)
mydensity[,2] = signif(mydensity2$y,3)
plot(mydensity2,main='Epanechnikov Kernel',xlab=xlab,ylab=ylab)
grid()
dev.off()
bitmap(file='density3.png')
mydensity3<-density(x,bw=bw,kernel='rectangular',na.rm=TRUE)
mydensity[,3] = signif(mydensity3$y,3)
plot(mydensity3,main='Rectangular Kernel',xlab=xlab,ylab=ylab)
grid()
dev.off()
bitmap(file='density4.png')
mydensity4<-density(x,bw=bw,kernel='triangular',na.rm=TRUE)
mydensity[,4] = signif(mydensity4$y,3)
plot(mydensity4,main='Triangular Kernel',xlab=xlab,ylab=ylab)
grid()
dev.off()
bitmap(file='density5.png')
mydensity5<-density(x,bw=bw,kernel='biweight',na.rm=TRUE)
mydensity[,5] = signif(mydensity5$y,3)
plot(mydensity5,main='Biweight Kernel',xlab=xlab,ylab=ylab)
grid()
dev.off()
bitmap(file='density6.png')
mydensity6<-density(x,bw=bw,kernel='cosine',na.rm=TRUE)
mydensity[,6] = signif(mydensity6$y,3)
plot(mydensity6,main='Cosine Kernel',xlab=xlab,ylab=ylab)
grid()
dev.off()
bitmap(file='density7.png')
mydensity7<-density(x,bw=bw,kernel='optcosine',na.rm=TRUE)
mydensity[,7] = signif(mydensity7$y,3)
plot(mydensity7,main='Optcosine Kernel',xlab=xlab,ylab=ylab)
grid()
dev.off()
load(file='createtable')
a<-table.start()
a<-table.row.start(a)
a<-table.element(a,'Properties of Density Trace',2,TRUE)
a<-table.row.end(a)
a<-table.row.start(a)
a<-table.element(a,'Bandwidth',header=TRUE)
a<-table.element(a,mydensity1$bw)
a<-table.row.end(a)
a<-table.row.start(a)
a<-table.element(a,'#Observations',header=TRUE)
a<-table.element(a,mydensity1$n)
a<-table.row.end(a)
a<-table.end(a)
table.save(a,file='mytable.tab')
a<-table.start()
a<-table.row.start(a)
a<-table.element(a,'Maximum Density Values',3,TRUE)
a<-table.row.end(a)
a<-table.row.start(a)
a<-table.element(a,'Kernel',1,TRUE)
a<-table.element(a,'x-value',1,TRUE)
a<-table.element(a,'max. density',1,TRUE)
a<-table.row.end(a)
a<-table.row.start(a)
a<-table.element(a,'Gaussian',1,TRUE)
a<-table.element(a,mydensity1$x[mydensity1$y==max(mydensity1$y)],1)
a<-table.element(a,mydensity1$y[mydensity1$y==max(mydensity1$y)],1)
a<-table.row.end(a)
a<-table.row.start(a)
a<-table.element(a,'Epanechnikov',1,TRUE)
a<-table.element(a,mydensity2$x[mydensity2$y==max(mydensity2$y)],1)
a<-table.element(a,mydensity2$y[mydensity2$y==max(mydensity2$y)],1)
a<-table.row.end(a)
a<-table.row.start(a)
a<-table.element(a,'Rectangular',1,TRUE)
a<-table.element(a,mydensity3$x[mydensity3$y==max(mydensity3$y)],1)
a<-table.element(a,mydensity3$y[mydensity3$y==max(mydensity3$y)],1)
a<-table.row.end(a)
a<-table.row.start(a)
a<-table.element(a,'Triangular',1,TRUE)
a<-table.element(a,mydensity4$x[mydensity4$y==max(mydensity4$y)],1)
a<-table.element(a,mydensity4$y[mydensity4$y==max(mydensity4$y)],1)
a<-table.row.end(a)
a<-table.row.start(a)
a<-table.element(a,'Biweight',1,TRUE)
a<-table.element(a,mydensity5$x[mydensity5$y==max(mydensity5$y)],1)
a<-table.element(a,mydensity5$y[mydensity5$y==max(mydensity5$y)],1)
a<-table.row.end(a)
a<-table.row.start(a)
a<-table.element(a,'Cosine',1,TRUE)
a<-table.element(a,mydensity6$x[mydensity6$y==max(mydensity6$y)],1)
a<-table.element(a,mydensity6$y[mydensity6$y==max(mydensity6$y)],1)
a<-table.row.end(a)
a<-table.row.start(a)
a<-table.element(a,'Optcosine',1,TRUE)
a<-table.element(a,mydensity7$x[mydensity7$y==max(mydensity7$y)],1)
a<-table.element(a,mydensity7$y[mydensity7$y==max(mydensity7$y)],1)
a<-table.row.end(a)
a<-table.end(a)
table.save(a,file='mytable2.tab')
if (par2=='yes') {
a<-table.start()
a<-table.row.start(a)
a<-table.element(a,'Kernel Density Values',8,TRUE)
a<-table.row.end(a)
a<-table.row.start(a)
a<-table.element(a,'x-value',1,TRUE)
a<-table.element(a,'Gaussian',1,TRUE)
a<-table.element(a,'Epanechnikov',1,TRUE)
a<-table.element(a,'Rectangular',1,TRUE)
a<-table.element(a,'Triangular',1,TRUE)
a<-table.element(a,'Biweight',1,TRUE)
a<-table.element(a,'Cosine',1,TRUE)
a<-table.element(a,'Optcosine',1,TRUE)
a<-table.row.end(a)
for(i in 1:par3) {
a<-table.row.start(a)
a<-table.element(a,mydensity[i,8],1,TRUE)
for(j in 1:7) {
a<-table.element(a,mydensity[i,j],1)
}
a<-table.row.end(a)
}
a<-table.end(a)
table.save(a,file='mytable1.tab')
}