Free Statistics

of Irreproducible Research!

Author's title

Author*Unverified author*
R Software Modulerwasp_density.wasp
Title produced by softwareKernel Density Estimation
Date of computationThu, 02 Oct 2014 16:41:03 +0100
Cite this page as followsStatistical Computations at FreeStatistics.org, Office for Research Development and Education, URL https://freestatistics.org/blog/index.php?v=date/2014/Oct/02/t14122645153su3qd1kf49f3vn.htm/, Retrieved Sat, 11 May 2024 20:55:41 +0000
Statistical Computations at FreeStatistics.org, Office for Research Development and Education, URL https://freestatistics.org/blog/index.php?pk=238093, Retrieved Sat, 11 May 2024 20:55:41 +0000
QR Codes:

Original text written by user:
IsPrivate?No (this computation is public)
User-defined keywords
Estimated Impact91
Family? (F = Feedback message, R = changed R code, M = changed R Module, P = changed Parameters, D = changed Data)
-     [Univariate Data Series] [Prijsindexcijfers...] [2014-10-02 10:07:50] [e447d1deb50f041b765de28867e39482]
- RMPD  [Histogram] [Histogram 24 graan] [2014-10-02 15:25:31] [e447d1deb50f041b765de28867e39482]
- R P     [Histogram] [Histogram 12 graan] [2014-10-02 15:28:32] [e447d1deb50f041b765de28867e39482]
-   P       [Histogram] [Histogram 4 Graan] [2014-10-02 15:31:38] [e447d1deb50f041b765de28867e39482]
- RMP           [Kernel Density Estimation] [Dichtheidsgrafiek...] [2014-10-02 15:41:03] [12dd06d3a2c25ae97856df636a27679f] [Current]
Feedback Forum

Post a new message
Dataseries X:
123.2
136.9
146.8
149.6
146.5
157
147.9
133.6
128.7
100.8
91.8
89.3
96.7
91.6
93.3
93.3
101
100.4
86.9
83.9
80.3
87.7
92.7
95.5
92
87.4
86.8
83.7
85
81.7
90.9
101.5
113.8
120.1
122.1
132.5
140
149.4
144.3
154.4
151.4
145.5
136.8
146.6
145.1
133.6
131.4
127.5
130.1
131.1
132.3
128.6
125.1
128.7
156.1
163.2
159.8
157.4
156.2
152.5
149.4
145.9
144.8
135.9
137.6
136
117.7
111.5
107.8
107.3
102.6
101


Summary of computational transaction
Raw Inputview raw input (R code)
Raw Outputview raw output of R engine
Computing time3 seconds
R Server'Sir Maurice George Kendall' @ kendall.wessa.net

\begin{tabular}{lllllllll}
\hline
Summary of computational transaction \tabularnewline
Raw Input & view raw input (R code)  \tabularnewline
Raw Output & view raw output of R engine  \tabularnewline
Computing time & 3 seconds \tabularnewline
R Server & 'Sir Maurice George Kendall' @ kendall.wessa.net \tabularnewline
\hline
\end{tabular}
%Source: https://freestatistics.org/blog/index.php?pk=238093&T=0

[TABLE]
[ROW][C]Summary of computational transaction[/C][/ROW]
[ROW][C]Raw Input[/C][C]view raw input (R code) [/C][/ROW]
[ROW][C]Raw Output[/C][C]view raw output of R engine [/C][/ROW]
[ROW][C]Computing time[/C][C]3 seconds[/C][/ROW]
[ROW][C]R Server[/C][C]'Sir Maurice George Kendall' @ kendall.wessa.net[/C][/ROW]
[/TABLE]
Source: https://freestatistics.org/blog/index.php?pk=238093&T=0

Globally Unique Identifier (entire table): ba.freestatistics.org/blog/index.php?pk=238093&T=0

As an alternative you can also use a QR Code:  

The GUIDs for individual cells are displayed in the table below:

Summary of computational transaction
Raw Inputview raw input (R code)
Raw Outputview raw output of R engine
Computing time3 seconds
R Server'Sir Maurice George Kendall' @ kendall.wessa.net


Properties of Density Trace
Bandwidth9.61480802889836
#Observations72

\begin{tabular}{lllllllll}
\hline
Properties of Density Trace \tabularnewline
Bandwidth & 9.61480802889836 \tabularnewline
#Observations & 72 \tabularnewline
\hline
\end{tabular}
%Source: https://freestatistics.org/blog/index.php?pk=238093&T=1

[TABLE]
[ROW][C]Properties of Density Trace[/C][/ROW]
[ROW][C]Bandwidth[/C][C]9.61480802889836[/C][/ROW]
[ROW][C]#Observations[/C][C]72[/C][/ROW]
[/TABLE]
Source: https://freestatistics.org/blog/index.php?pk=238093&T=1

Globally Unique Identifier (entire table): ba.freestatistics.org/blog/index.php?pk=238093&T=1

As an alternative you can also use a QR Code:  

The GUIDs for individual cells are displayed in the table below:

Properties of Density Trace
Bandwidth9.61480802889836
#Observations72


Maximum Density Values
Kernelx-valuemax. density
Gaussian140.3209339563680.0144777559186005
Epanechnikov140.3209339563680.0147817672059374
Rectangular143.3473083788870.0154290073936896
Triangular139.7706840613640.0143391282562869
Biweight140.5960589038690.0146709235947713
Cosine140.5960589038690.0146306354614833
Optcosine140.3209339563680.0147308671824574

\begin{tabular}{lllllllll}
\hline
Maximum Density Values \tabularnewline
Kernel & x-value & max. density \tabularnewline
Gaussian & 140.320933956368 & 0.0144777559186005 \tabularnewline
Epanechnikov & 140.320933956368 & 0.0147817672059374 \tabularnewline
Rectangular & 143.347308378887 & 0.0154290073936896 \tabularnewline
Triangular & 139.770684061364 & 0.0143391282562869 \tabularnewline
Biweight & 140.596058903869 & 0.0146709235947713 \tabularnewline
Cosine & 140.596058903869 & 0.0146306354614833 \tabularnewline
Optcosine & 140.320933956368 & 0.0147308671824574 \tabularnewline
\hline
\end{tabular}
%Source: https://freestatistics.org/blog/index.php?pk=238093&T=2

[TABLE]
[ROW][C]Maximum Density Values[/C][/ROW]
[ROW][C]Kernel[/C][C]x-value[/C][C]max. density[/C][/ROW]
[ROW][C]Gaussian[/C][C]140.320933956368[/C][C]0.0144777559186005[/C][/ROW]
[ROW][C]Epanechnikov[/C][C]140.320933956368[/C][C]0.0147817672059374[/C][/ROW]
[ROW][C]Rectangular[/C][C]143.347308378887[/C][C]0.0154290073936896[/C][/ROW]
[ROW][C]Triangular[/C][C]139.770684061364[/C][C]0.0143391282562869[/C][/ROW]
[ROW][C]Biweight[/C][C]140.596058903869[/C][C]0.0146709235947713[/C][/ROW]
[ROW][C]Cosine[/C][C]140.596058903869[/C][C]0.0146306354614833[/C][/ROW]
[ROW][C]Optcosine[/C][C]140.320933956368[/C][C]0.0147308671824574[/C][/ROW]
[/TABLE]
Source: https://freestatistics.org/blog/index.php?pk=238093&T=2

Globally Unique Identifier (entire table): ba.freestatistics.org/blog/index.php?pk=238093&T=2

As an alternative you can also use a QR Code:  

The GUIDs for individual cells are displayed in the table below:

Maximum Density Values
Kernelx-valuemax. density
Gaussian140.3209339563680.0144777559186005
Epanechnikov140.3209339563680.0147817672059374
Rectangular143.3473083788870.0154290073936896
Triangular139.7706840613640.0143391282562869
Biweight140.5960589038690.0146709235947713
Cosine140.5960589038690.0146306354614833
Optcosine140.3209339563680.0147308671824574


Parameters (Session):
par1 = 0 ; par2 = no ; par3 = 512 ;
Parameters (R input):
par1 = 0 ; par2 = no ; par3 = 512 ;
R code (references can be found in the software module):
if (par1 == '0') bw <- 'nrd0'
if (par1 != '0') bw <- as.numeric(par1)
par3 <- as.numeric(par3)
mydensity <- array(NA, dim=c(par3,8))
bitmap(file='density1.png')
mydensity1<-density(x,bw=bw,kernel='gaussian',na.rm=TRUE)
mydensity[,8] = signif(mydensity1$x,3)
mydensity[,1] = signif(mydensity1$y,3)
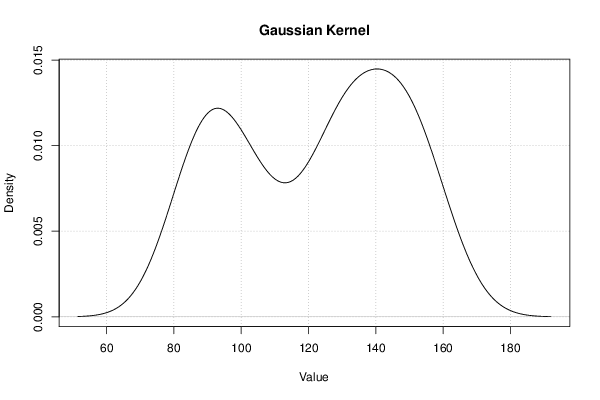
plot(mydensity1,main='Gaussian Kernel',xlab=xlab,ylab=ylab)
grid()
dev.off()
mydensity1
bitmap(file='density2.png')
mydensity2<-density(x,bw=bw,kernel='epanechnikov',na.rm=TRUE)
mydensity[,2] = signif(mydensity2$y,3)
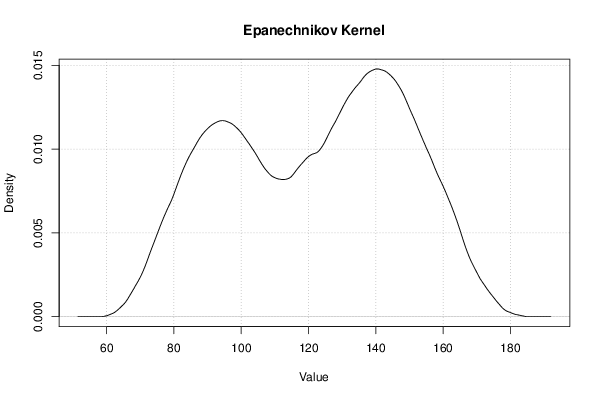
plot(mydensity2,main='Epanechnikov Kernel',xlab=xlab,ylab=ylab)
grid()
dev.off()
bitmap(file='density3.png')
mydensity3<-density(x,bw=bw,kernel='rectangular',na.rm=TRUE)
mydensity[,3] = signif(mydensity3$y,3)
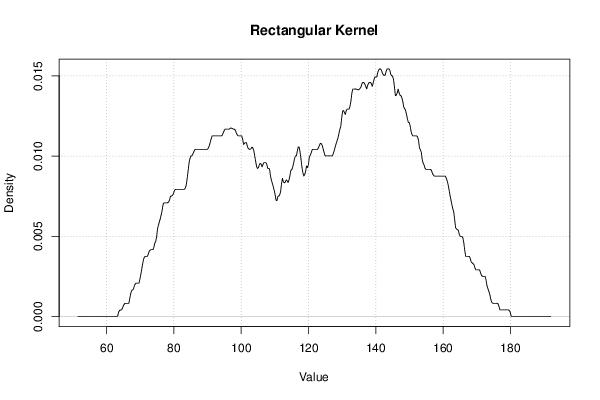
plot(mydensity3,main='Rectangular Kernel',xlab=xlab,ylab=ylab)
grid()
dev.off()
bitmap(file='density4.png')
mydensity4<-density(x,bw=bw,kernel='triangular',na.rm=TRUE)
mydensity[,4] = signif(mydensity4$y,3)
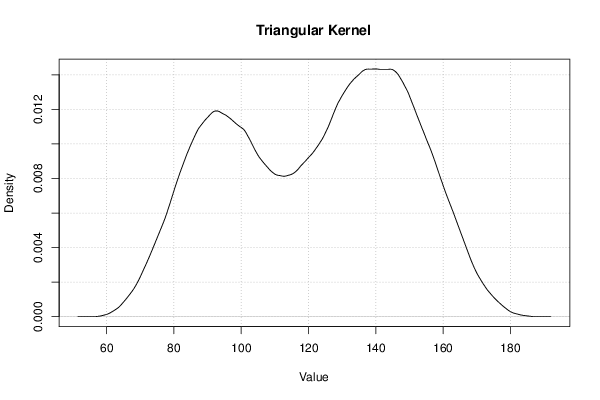
plot(mydensity4,main='Triangular Kernel',xlab=xlab,ylab=ylab)
grid()
dev.off()
bitmap(file='density5.png')
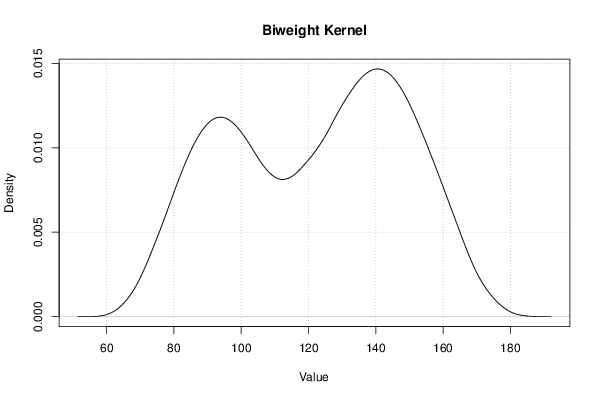
mydensity5<-density(x,bw=bw,kernel='biweight',na.rm=TRUE)
mydensity[,5] = signif(mydensity5$y,3)
plot(mydensity5,main='Biweight Kernel',xlab=xlab,ylab=ylab)
grid()
dev.off()
bitmap(file='density6.png')
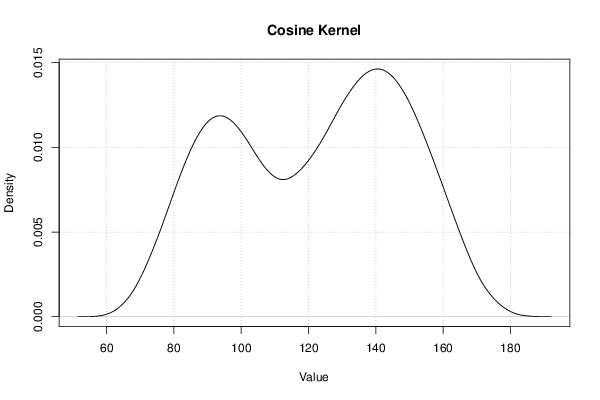
mydensity6<-density(x,bw=bw,kernel='cosine',na.rm=TRUE)
mydensity[,6] = signif(mydensity6$y,3)
plot(mydensity6,main='Cosine Kernel',xlab=xlab,ylab=ylab)
grid()
dev.off()
bitmap(file='density7.png')
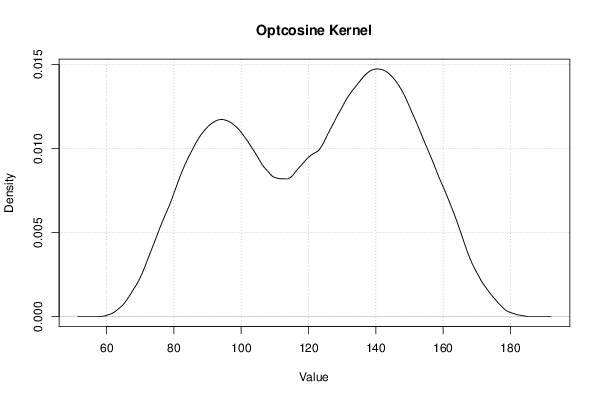
mydensity7<-density(x,bw=bw,kernel='optcosine',na.rm=TRUE)
mydensity[,7] = signif(mydensity7$y,3)
plot(mydensity7,main='Optcosine Kernel',xlab=xlab,ylab=ylab)
grid()
dev.off()
load(file='createtable')
a<-table.start()
a<-table.row.start(a)
a<-table.element(a,'Properties of Density Trace',2,TRUE)
a<-table.row.end(a)
a<-table.row.start(a)
a<-table.element(a,'Bandwidth',header=TRUE)
a<-table.element(a,mydensity1$bw)
a<-table.row.end(a)
a<-table.row.start(a)
a<-table.element(a,'#Observations',header=TRUE)
a<-table.element(a,mydensity1$n)
a<-table.row.end(a)
a<-table.end(a)
table.save(a,file='mytable.tab')
a<-table.start()
a<-table.row.start(a)
a<-table.element(a,'Maximum Density Values',3,TRUE)
a<-table.row.end(a)
a<-table.row.start(a)
a<-table.element(a,'Kernel',1,TRUE)
a<-table.element(a,'x-value',1,TRUE)
a<-table.element(a,'max. density',1,TRUE)
a<-table.row.end(a)
a<-table.row.start(a)
a<-table.element(a,'Gaussian',1,TRUE)
a<-table.element(a,mydensity1$x[mydensity1$y==max(mydensity1$y)],1)
a<-table.element(a,mydensity1$y[mydensity1$y==max(mydensity1$y)],1)
a<-table.row.end(a)
a<-table.row.start(a)
a<-table.element(a,'Epanechnikov',1,TRUE)
a<-table.element(a,mydensity2$x[mydensity2$y==max(mydensity2$y)],1)
a<-table.element(a,mydensity2$y[mydensity2$y==max(mydensity2$y)],1)
a<-table.row.end(a)
a<-table.row.start(a)
a<-table.element(a,'Rectangular',1,TRUE)
a<-table.element(a,mydensity3$x[mydensity3$y==max(mydensity3$y)],1)
a<-table.element(a,mydensity3$y[mydensity3$y==max(mydensity3$y)],1)
a<-table.row.end(a)
a<-table.row.start(a)
a<-table.element(a,'Triangular',1,TRUE)
a<-table.element(a,mydensity4$x[mydensity4$y==max(mydensity4$y)],1)
a<-table.element(a,mydensity4$y[mydensity4$y==max(mydensity4$y)],1)
a<-table.row.end(a)
a<-table.row.start(a)
a<-table.element(a,'Biweight',1,TRUE)
a<-table.element(a,mydensity5$x[mydensity5$y==max(mydensity5$y)],1)
a<-table.element(a,mydensity5$y[mydensity5$y==max(mydensity5$y)],1)
a<-table.row.end(a)
a<-table.row.start(a)
a<-table.element(a,'Cosine',1,TRUE)
a<-table.element(a,mydensity6$x[mydensity6$y==max(mydensity6$y)],1)
a<-table.element(a,mydensity6$y[mydensity6$y==max(mydensity6$y)],1)
a<-table.row.end(a)
a<-table.row.start(a)
a<-table.element(a,'Optcosine',1,TRUE)
a<-table.element(a,mydensity7$x[mydensity7$y==max(mydensity7$y)],1)
a<-table.element(a,mydensity7$y[mydensity7$y==max(mydensity7$y)],1)
a<-table.row.end(a)
a<-table.end(a)
table.save(a,file='mytable2.tab')
if (par2=='yes') {
a<-table.start()
a<-table.row.start(a)
a<-table.element(a,'Kernel Density Values',8,TRUE)
a<-table.row.end(a)
a<-table.row.start(a)
a<-table.element(a,'x-value',1,TRUE)
a<-table.element(a,'Gaussian',1,TRUE)
a<-table.element(a,'Epanechnikov',1,TRUE)
a<-table.element(a,'Rectangular',1,TRUE)
a<-table.element(a,'Triangular',1,TRUE)
a<-table.element(a,'Biweight',1,TRUE)
a<-table.element(a,'Cosine',1,TRUE)
a<-table.element(a,'Optcosine',1,TRUE)
a<-table.row.end(a)
for(i in 1:par3) {
a<-table.row.start(a)
a<-table.element(a,mydensity[i,8],1,TRUE)
for(j in 1:7) {
a<-table.element(a,mydensity[i,j],1)
}
a<-table.row.end(a)
}
a<-table.end(a)
table.save(a,file='mytable1.tab')
}