Free Statistics

of Irreproducible Research!

Author's title

Author*Unverified author*
R Software Modulerwasp_density.wasp
Title produced by softwareKernel Density Estimation
Date of computationWed, 01 Oct 2014 15:28:18 +0100
Cite this page as followsStatistical Computations at FreeStatistics.org, Office for Research Development and Education, URL https://freestatistics.org/blog/index.php?v=date/2014/Oct/01/t14121737321076t1cpq51yi69.htm/, Retrieved Mon, 13 May 2024 09:40:41 +0000
Statistical Computations at FreeStatistics.org, Office for Research Development and Education, URL https://freestatistics.org/blog/index.php?pk=237557, Retrieved Mon, 13 May 2024 09:40:41 +0000
QR Codes:

Original text written by user:
IsPrivate?No (this computation is public)
User-defined keywords
Estimated Impact100
Family? (F = Feedback message, R = changed R code, M = changed R Module, P = changed Parameters, D = changed Data)
-     [Histogram] [Werkloze beroepsb...] [2014-09-18 13:15:26] [be6f075fcfffb6e204f178c2e69229d5]
- R     [Histogram] [Werkloze beroepsb...] [2014-09-26 14:06:07] [be6f075fcfffb6e204f178c2e69229d5]
-   P     [Histogram] [Werkloze beroepsb...] [2014-09-26 14:10:00] [be6f075fcfffb6e204f178c2e69229d5]
- RMP       [Kernel Density Estimation] [Werkloze beroepsb...] [2014-09-26 14:20:39] [be6f075fcfffb6e204f178c2e69229d5]
- R  D          [Kernel Density Estimation] [Werkloze beroepsb...] [2014-10-01 14:28:18] [30b408b6447afc100cbee3b5fe745b69] [Current]
Feedback Forum

Post a new message
Dataseries X:
82
80
76
73
70
68
67
64
69
69
67
57
67
69
67
66
65
56
57
53
58
59
60
59
65
62
61
62
57
51
45
46
48
49
48
43
51
54
57
60
58
61
62
62
64
68
70
73
79
84
82
78
78
76
73
71
71
70
74
72
80
80
80
79
82
71
75
74
76
82
85
82
92
93
93
99
98
89
96
94
99
108
113
115
126
131
134
134
137
139
139
134
133
135
130
133


Summary of computational transaction
Raw Inputview raw input (R code)
Raw Outputview raw output of R engine
Computing time3 seconds
R Server'George Udny Yule' @ yule.wessa.net

\begin{tabular}{lllllllll}
\hline
Summary of computational transaction \tabularnewline
Raw Input & view raw input (R code)  \tabularnewline
Raw Output & view raw output of R engine  \tabularnewline
Computing time & 3 seconds \tabularnewline
R Server & 'George Udny Yule' @ yule.wessa.net \tabularnewline
\hline
\end{tabular}
%Source: https://freestatistics.org/blog/index.php?pk=237557&T=0

[TABLE]
[ROW][C]Summary of computational transaction[/C][/ROW]
[ROW][C]Raw Input[/C][C]view raw input (R code) [/C][/ROW]
[ROW][C]Raw Output[/C][C]view raw output of R engine [/C][/ROW]
[ROW][C]Computing time[/C][C]3 seconds[/C][/ROW]
[ROW][C]R Server[/C][C]'George Udny Yule' @ yule.wessa.net[/C][/ROW]
[/TABLE]
Source: https://freestatistics.org/blog/index.php?pk=237557&T=0

Globally Unique Identifier (entire table): ba.freestatistics.org/blog/index.php?pk=237557&T=0

As an alternative you can also use a QR Code:  

The GUIDs for individual cells are displayed in the table below:

Summary of computational transaction
Raw Inputview raw input (R code)
Raw Outputview raw output of R engine
Computing time3 seconds
R Server'George Udny Yule' @ yule.wessa.net


Properties of Density Trace
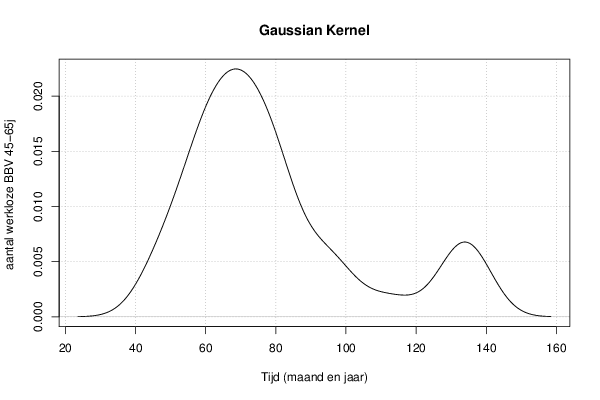
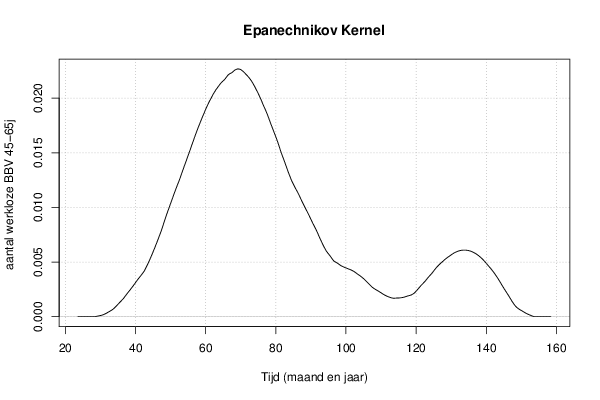
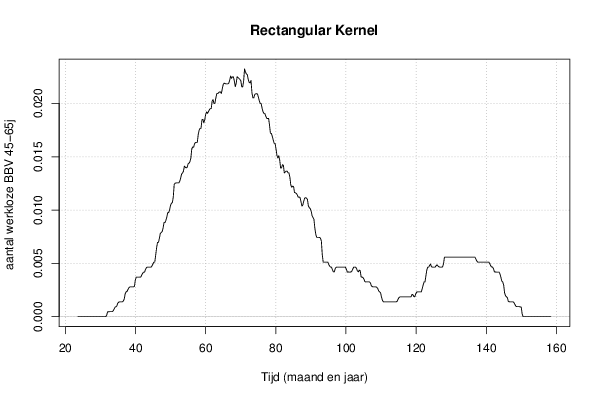
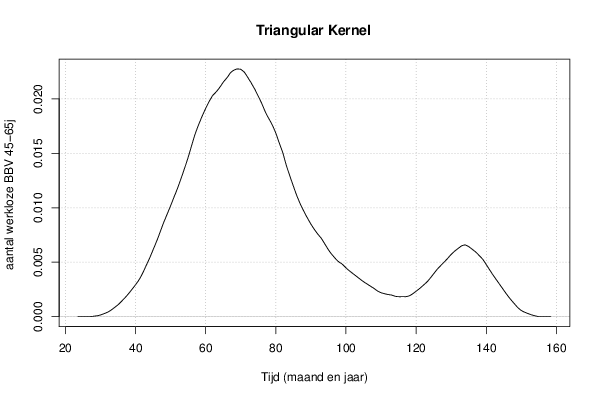
Bandwidth6.46985736344066
#Observations96

\begin{tabular}{lllllllll}
\hline
Properties of Density Trace \tabularnewline
Bandwidth & 6.46985736344066 \tabularnewline
#Observations & 96 \tabularnewline
\hline
\end{tabular}
%Source: https://freestatistics.org/blog/index.php?pk=237557&T=1

[TABLE]
[ROW][C]Properties of Density Trace[/C][/ROW]
[ROW][C]Bandwidth[/C][C]6.46985736344066[/C][/ROW]
[ROW][C]#Observations[/C][C]96[/C][/ROW]
[/TABLE]
Source: https://freestatistics.org/blog/index.php?pk=237557&T=1

Globally Unique Identifier (entire table): ba.freestatistics.org/blog/index.php?pk=237557&T=1

As an alternative you can also use a QR Code:  

The GUIDs for individual cells are displayed in the table below:

Properties of Density Trace
Bandwidth6.46985736344066
#Observations96


Maximum Density Values
Kernelx-valuemax. density
Gaussian68.70603193098940.0224735542657974
Epanechnikov69.23369981427960.0226727763362076
Rectangular71.08053740579530.0232402572717349
Triangular68.96986587263450.0227567207424278
Biweight68.96986587263450.0225297169826487
Cosine68.96986587263450.0225097005776733
Optcosine69.23369981427960.0226320684116799

\begin{tabular}{lllllllll}
\hline
Maximum Density Values \tabularnewline
Kernel & x-value & max. density \tabularnewline
Gaussian & 68.7060319309894 & 0.0224735542657974 \tabularnewline
Epanechnikov & 69.2336998142796 & 0.0226727763362076 \tabularnewline
Rectangular & 71.0805374057953 & 0.0232402572717349 \tabularnewline
Triangular & 68.9698658726345 & 0.0227567207424278 \tabularnewline
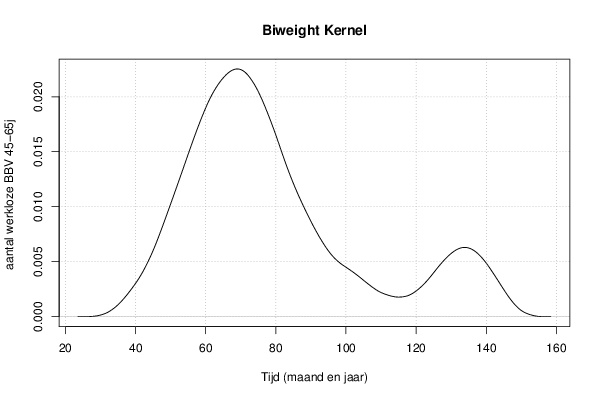
Biweight & 68.9698658726345 & 0.0225297169826487 \tabularnewline
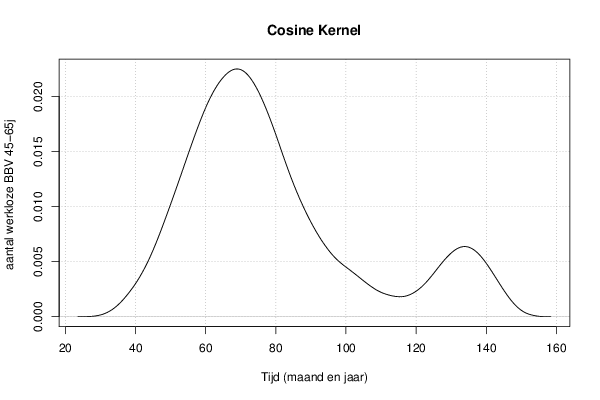
Cosine & 68.9698658726345 & 0.0225097005776733 \tabularnewline
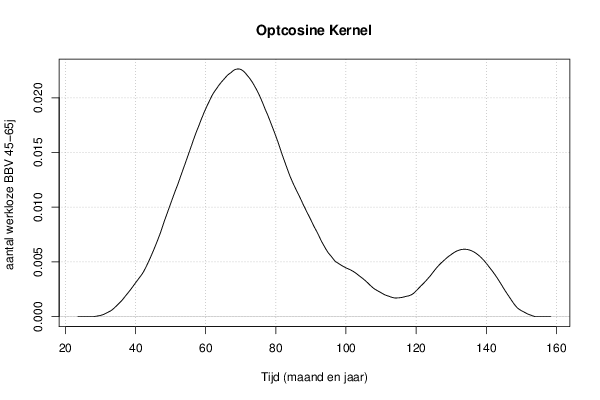
Optcosine & 69.2336998142796 & 0.0226320684116799 \tabularnewline
\hline
\end{tabular}
%Source: https://freestatistics.org/blog/index.php?pk=237557&T=2

[TABLE]
[ROW][C]Maximum Density Values[/C][/ROW]
[ROW][C]Kernel[/C][C]x-value[/C][C]max. density[/C][/ROW]
[ROW][C]Gaussian[/C][C]68.7060319309894[/C][C]0.0224735542657974[/C][/ROW]
[ROW][C]Epanechnikov[/C][C]69.2336998142796[/C][C]0.0226727763362076[/C][/ROW]
[ROW][C]Rectangular[/C][C]71.0805374057953[/C][C]0.0232402572717349[/C][/ROW]
[ROW][C]Triangular[/C][C]68.9698658726345[/C][C]0.0227567207424278[/C][/ROW]
[ROW][C]Biweight[/C][C]68.9698658726345[/C][C]0.0225297169826487[/C][/ROW]
[ROW][C]Cosine[/C][C]68.9698658726345[/C][C]0.0225097005776733[/C][/ROW]
[ROW][C]Optcosine[/C][C]69.2336998142796[/C][C]0.0226320684116799[/C][/ROW]
[/TABLE]
Source: https://freestatistics.org/blog/index.php?pk=237557&T=2

Globally Unique Identifier (entire table): ba.freestatistics.org/blog/index.php?pk=237557&T=2

As an alternative you can also use a QR Code:  

The GUIDs for individual cells are displayed in the table below:

Maximum Density Values
Kernelx-valuemax. density
Gaussian68.70603193098940.0224735542657974
Epanechnikov69.23369981427960.0226727763362076
Rectangular71.08053740579530.0232402572717349
Triangular68.96986587263450.0227567207424278
Biweight68.96986587263450.0225297169826487
Cosine68.96986587263450.0225097005776733
Optcosine69.23369981427960.0226320684116799


Parameters (Session):
par1 = 0 ; par2 = no ; par3 = 512 ;
Parameters (R input):
par1 = 0 ; par2 = no ; par3 = 512 ;
R code (references can be found in the software module):
if (par1 == '0') bw <- 'nrd0'
if (par1 != '0') bw <- as.numeric(par1)
par3 <- as.numeric(par3)
mydensity <- array(NA, dim=c(par3,8))
bitmap(file='density1.png')
mydensity1<-density(x,bw=bw,kernel='gaussian',na.rm=TRUE)
mydensity[,8] = signif(mydensity1$x,3)
mydensity[,1] = signif(mydensity1$y,3)
plot(mydensity1,main='Gaussian Kernel',xlab=xlab,ylab=ylab)
grid()
dev.off()
mydensity1
bitmap(file='density2.png')
mydensity2<-density(x,bw=bw,kernel='epanechnikov',na.rm=TRUE)
mydensity[,2] = signif(mydensity2$y,3)
plot(mydensity2,main='Epanechnikov Kernel',xlab=xlab,ylab=ylab)
grid()
dev.off()
bitmap(file='density3.png')
mydensity3<-density(x,bw=bw,kernel='rectangular',na.rm=TRUE)
mydensity[,3] = signif(mydensity3$y,3)
plot(mydensity3,main='Rectangular Kernel',xlab=xlab,ylab=ylab)
grid()
dev.off()
bitmap(file='density4.png')
mydensity4<-density(x,bw=bw,kernel='triangular',na.rm=TRUE)
mydensity[,4] = signif(mydensity4$y,3)
plot(mydensity4,main='Triangular Kernel',xlab=xlab,ylab=ylab)
grid()
dev.off()
bitmap(file='density5.png')
mydensity5<-density(x,bw=bw,kernel='biweight',na.rm=TRUE)
mydensity[,5] = signif(mydensity5$y,3)
plot(mydensity5,main='Biweight Kernel',xlab=xlab,ylab=ylab)
grid()
dev.off()
bitmap(file='density6.png')
mydensity6<-density(x,bw=bw,kernel='cosine',na.rm=TRUE)
mydensity[,6] = signif(mydensity6$y,3)
plot(mydensity6,main='Cosine Kernel',xlab=xlab,ylab=ylab)
grid()
dev.off()
bitmap(file='density7.png')
mydensity7<-density(x,bw=bw,kernel='optcosine',na.rm=TRUE)
mydensity[,7] = signif(mydensity7$y,3)
plot(mydensity7,main='Optcosine Kernel',xlab=xlab,ylab=ylab)
grid()
dev.off()
load(file='createtable')
a<-table.start()
a<-table.row.start(a)
a<-table.element(a,'Properties of Density Trace',2,TRUE)
a<-table.row.end(a)
a<-table.row.start(a)
a<-table.element(a,'Bandwidth',header=TRUE)
a<-table.element(a,mydensity1$bw)
a<-table.row.end(a)
a<-table.row.start(a)
a<-table.element(a,'#Observations',header=TRUE)
a<-table.element(a,mydensity1$n)
a<-table.row.end(a)
a<-table.end(a)
table.save(a,file='mytable.tab')
a<-table.start()
a<-table.row.start(a)
a<-table.element(a,'Maximum Density Values',3,TRUE)
a<-table.row.end(a)
a<-table.row.start(a)
a<-table.element(a,'Kernel',1,TRUE)
a<-table.element(a,'x-value',1,TRUE)
a<-table.element(a,'max. density',1,TRUE)
a<-table.row.end(a)
a<-table.row.start(a)
a<-table.element(a,'Gaussian',1,TRUE)
a<-table.element(a,mydensity1$x[mydensity1$y==max(mydensity1$y)],1)
a<-table.element(a,mydensity1$y[mydensity1$y==max(mydensity1$y)],1)
a<-table.row.end(a)
a<-table.row.start(a)
a<-table.element(a,'Epanechnikov',1,TRUE)
a<-table.element(a,mydensity2$x[mydensity2$y==max(mydensity2$y)],1)
a<-table.element(a,mydensity2$y[mydensity2$y==max(mydensity2$y)],1)
a<-table.row.end(a)
a<-table.row.start(a)
a<-table.element(a,'Rectangular',1,TRUE)
a<-table.element(a,mydensity3$x[mydensity3$y==max(mydensity3$y)],1)
a<-table.element(a,mydensity3$y[mydensity3$y==max(mydensity3$y)],1)
a<-table.row.end(a)
a<-table.row.start(a)
a<-table.element(a,'Triangular',1,TRUE)
a<-table.element(a,mydensity4$x[mydensity4$y==max(mydensity4$y)],1)
a<-table.element(a,mydensity4$y[mydensity4$y==max(mydensity4$y)],1)
a<-table.row.end(a)
a<-table.row.start(a)
a<-table.element(a,'Biweight',1,TRUE)
a<-table.element(a,mydensity5$x[mydensity5$y==max(mydensity5$y)],1)
a<-table.element(a,mydensity5$y[mydensity5$y==max(mydensity5$y)],1)
a<-table.row.end(a)
a<-table.row.start(a)
a<-table.element(a,'Cosine',1,TRUE)
a<-table.element(a,mydensity6$x[mydensity6$y==max(mydensity6$y)],1)
a<-table.element(a,mydensity6$y[mydensity6$y==max(mydensity6$y)],1)
a<-table.row.end(a)
a<-table.row.start(a)
a<-table.element(a,'Optcosine',1,TRUE)
a<-table.element(a,mydensity7$x[mydensity7$y==max(mydensity7$y)],1)
a<-table.element(a,mydensity7$y[mydensity7$y==max(mydensity7$y)],1)
a<-table.row.end(a)
a<-table.end(a)
table.save(a,file='mytable2.tab')
if (par2=='yes') {
a<-table.start()
a<-table.row.start(a)
a<-table.element(a,'Kernel Density Values',8,TRUE)
a<-table.row.end(a)
a<-table.row.start(a)
a<-table.element(a,'x-value',1,TRUE)
a<-table.element(a,'Gaussian',1,TRUE)
a<-table.element(a,'Epanechnikov',1,TRUE)
a<-table.element(a,'Rectangular',1,TRUE)
a<-table.element(a,'Triangular',1,TRUE)
a<-table.element(a,'Biweight',1,TRUE)
a<-table.element(a,'Cosine',1,TRUE)
a<-table.element(a,'Optcosine',1,TRUE)
a<-table.row.end(a)
for(i in 1:par3) {
a<-table.row.start(a)
a<-table.element(a,mydensity[i,8],1,TRUE)
for(j in 1:7) {
a<-table.element(a,mydensity[i,j],1)
}
a<-table.row.end(a)
}
a<-table.end(a)
table.save(a,file='mytable1.tab')
}