Free Statistics

of Irreproducible Research!

Author's title

Author*Unverified author*
R Software Modulerwasp_density.wasp
Title produced by softwareKernel Density Estimation
Date of computationWed, 01 Oct 2014 15:24:14 +0100
Cite this page as followsStatistical Computations at FreeStatistics.org, Office for Research Development and Education, URL https://freestatistics.org/blog/index.php?v=date/2014/Oct/01/t1412173554nybd46qaxx93bwj.htm/, Retrieved Mon, 13 May 2024 05:22:22 +0000
Statistical Computations at FreeStatistics.org, Office for Research Development and Education, URL https://freestatistics.org/blog/index.php?pk=237552, Retrieved Mon, 13 May 2024 05:22:22 +0000
QR Codes:

Original text written by user:
IsPrivate?No (this computation is public)
User-defined keywords
Estimated Impact76
Family? (F = Feedback message, R = changed R code, M = changed R Module, P = changed Parameters, D = changed Data)
-     [Univariate Data Series] [] [2014-09-25 09:41:27] [04a55301da4d99c9ab03cc0bef0efffc]
- RMP     [Kernel Density Estimation] [] [2014-10-01 14:24:14] [7a6c09eb8232161d54860d64a56e9131] [Current]
Feedback Forum

Post a new message
Dataseries X:
324
336
327
302
299
311
315
264
278
278
287
279
324
354
354
360
363
385
412
370
389
395
417
404
456
478
468
437
432
441
449
386
396
394
403
373
409
430
415
392
401
400
447
392
427
444
448
427
480
490
482
490
485
498
544
483
508
529
547
543
608
638
661
650
654
678
725
644
670
662
641
642


Summary of computational transaction
Raw Inputview raw input (R code)
Raw Outputview raw output of R engine
Computing time3 seconds
R Server'Sir Ronald Aylmer Fisher' @ fisher.wessa.net

\begin{tabular}{lllllllll}
\hline
Summary of computational transaction \tabularnewline
Raw Input & view raw input (R code)  \tabularnewline
Raw Output & view raw output of R engine  \tabularnewline
Computing time & 3 seconds \tabularnewline
R Server & 'Sir Ronald Aylmer Fisher' @ fisher.wessa.net \tabularnewline
\hline
\end{tabular}
%Source: https://freestatistics.org/blog/index.php?pk=237552&T=0

[TABLE]
[ROW][C]Summary of computational transaction[/C][/ROW]
[ROW][C]Raw Input[/C][C]view raw input (R code) [/C][/ROW]
[ROW][C]Raw Output[/C][C]view raw output of R engine [/C][/ROW]
[ROW][C]Computing time[/C][C]3 seconds[/C][/ROW]
[ROW][C]R Server[/C][C]'Sir Ronald Aylmer Fisher' @ fisher.wessa.net[/C][/ROW]
[/TABLE]
Source: https://freestatistics.org/blog/index.php?pk=237552&T=0

Globally Unique Identifier (entire table): ba.freestatistics.org/blog/index.php?pk=237552&T=0

As an alternative you can also use a QR Code:  

The GUIDs for individual cells are displayed in the table below:

Summary of computational transaction
Raw Inputview raw input (R code)
Raw Outputview raw output of R engine
Computing time3 seconds
R Server'Sir Ronald Aylmer Fisher' @ fisher.wessa.net


Properties of Density Trace
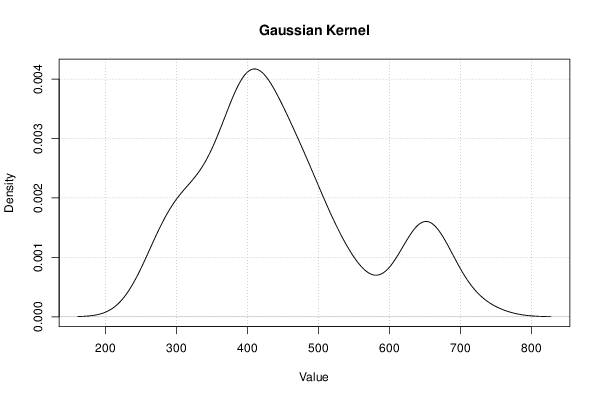
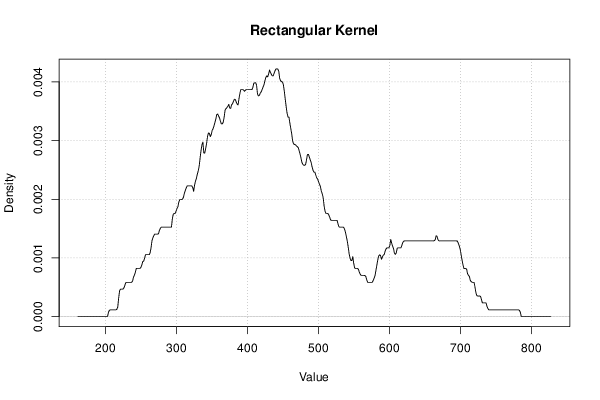
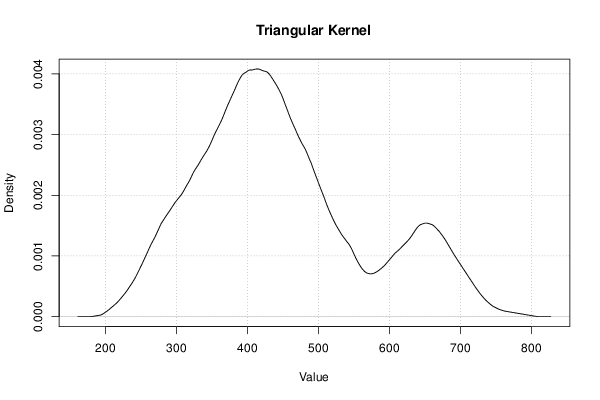
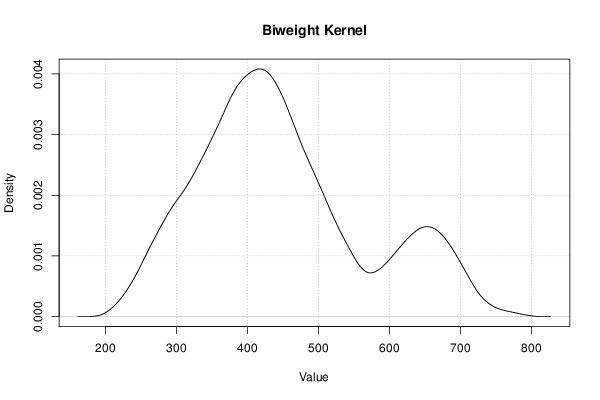
Bandwidth34.1937501380459
#Observations72

\begin{tabular}{lllllllll}
\hline
Properties of Density Trace \tabularnewline
Bandwidth & 34.1937501380459 \tabularnewline
#Observations & 72 \tabularnewline
\hline
\end{tabular}
%Source: https://freestatistics.org/blog/index.php?pk=237552&T=1

[TABLE]
[ROW][C]Properties of Density Trace[/C][/ROW]
[ROW][C]Bandwidth[/C][C]34.1937501380459[/C][/ROW]
[ROW][C]#Observations[/C][C]72[/C][/ROW]
[/TABLE]
Source: https://freestatistics.org/blog/index.php?pk=237552&T=1

Globally Unique Identifier (entire table): ba.freestatistics.org/blog/index.php?pk=237552&T=1

As an alternative you can also use a QR Code:  

The GUIDs for individual cells are displayed in the table below:

Properties of Density Trace
Bandwidth34.1937501380459
#Observations72


Maximum Density Values
Kernelx-valuemax. density
Gaussian410.4149093866460.00417220523069448
Epanechnikov422.1477127280440.00407593971410631
Rectangular440.3987401479970.00422116809986303
Triangular414.3258438337790.00408199218928709
Biweight418.2367782809120.00408310259862002
Cosine415.629488649490.00409363209625113
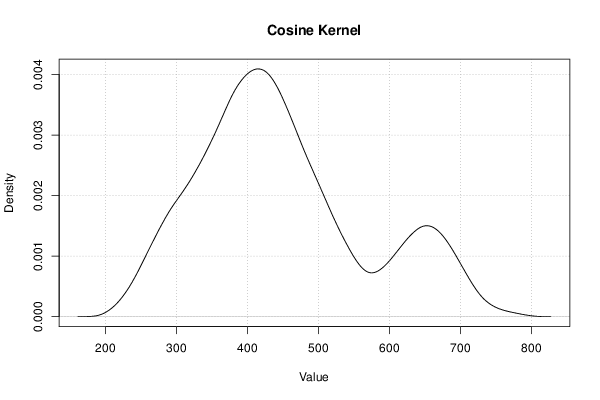
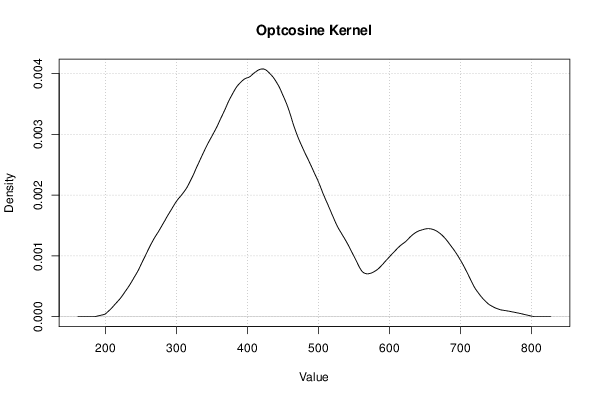
Optcosine422.1477127280440.00407873431662551

\begin{tabular}{lllllllll}
\hline
Maximum Density Values \tabularnewline
Kernel & x-value & max. density \tabularnewline
Gaussian & 410.414909386646 & 0.00417220523069448 \tabularnewline
Epanechnikov & 422.147712728044 & 0.00407593971410631 \tabularnewline
Rectangular & 440.398740147997 & 0.00422116809986303 \tabularnewline
Triangular & 414.325843833779 & 0.00408199218928709 \tabularnewline
Biweight & 418.236778280912 & 0.00408310259862002 \tabularnewline
Cosine & 415.62948864949 & 0.00409363209625113 \tabularnewline
Optcosine & 422.147712728044 & 0.00407873431662551 \tabularnewline
 \hline
\end{tabular}
%Source: https://freestatistics.org/blog/index.php?pk=237552&T=2

[TABLE]
[ROW][C]Maximum Density Values[/C][/ROW]
[ROW][C]Kernel[/C][C]x-value[/C][C]max. density[/C][/ROW]
[ROW][C]Gaussian[/C][C]410.414909386646[/C][C]0.00417220523069448[/C][/ROW]
[ROW][C]Epanechnikov[/C][C]422.147712728044[/C][C]0.00407593971410631[/C][/ROW]
[ROW][C]Rectangular[/C][C]440.398740147997[/C][C]0.00422116809986303[/C][/ROW]
[ROW][C]Triangular[/C][C]414.325843833779[/C][C]0.00408199218928709[/C][/ROW]
[ROW][C]Biweight[/C][C]418.236778280912[/C][C]0.00408310259862002[/C][/ROW]
[ROW][C]Cosine[/C][C]415.62948864949[/C][C]0.00409363209625113[/C][/ROW]
[ROW][C]Optcosine[/C][C]422.147712728044[/C][C]0.00407873431662551[/C][/ROW]
 [/TABLE]
Source: https://freestatistics.org/blog/index.php?pk=237552&T=2

Globally Unique Identifier (entire table): ba.freestatistics.org/blog/index.php?pk=237552&T=2

As an alternative you can also use a QR Code:  

The GUIDs for individual cells are displayed in the table below:

Maximum Density Values
Kernelx-valuemax. density
Gaussian410.4149093866460.00417220523069448
Epanechnikov422.1477127280440.00407593971410631
Rectangular440.3987401479970.00422116809986303
Triangular414.3258438337790.00408199218928709
Biweight418.2367782809120.00408310259862002
Cosine415.629488649490.00409363209625113
Optcosine422.1477127280440.00407873431662551


Maximum Density Values
Kernelx-valuemax. density
Gaussian410.4149093866460.00417220523069448
Epanechnikov422.1477127280440.00407593971410631
Rectangular441.7023849637080.00422116809986303
Triangular414.3258438337790.00408199218928709
Biweight418.2367782809120.00408310259862002
Cosine415.629488649490.00409363209625113
Optcosine422.1477127280440.00407873431662551

\begin{tabular}{lllllllll}
\hline
Maximum Density Values \tabularnewline
Kernel & x-value & max. density \tabularnewline
Gaussian & 410.414909386646 & 0.00417220523069448 \tabularnewline
Epanechnikov & 422.147712728044 & 0.00407593971410631 \tabularnewline
Rectangular & 441.702384963708 & 0.00422116809986303 \tabularnewline
Triangular & 414.325843833779 & 0.00408199218928709 \tabularnewline
Biweight & 418.236778280912 & 0.00408310259862002 \tabularnewline
Cosine & 415.62948864949 & 0.00409363209625113 \tabularnewline
Optcosine & 422.147712728044 & 0.00407873431662551 \tabularnewline
\hline
\end{tabular}
%Source: https://freestatistics.org/blog/index.php?pk=237552&T=3

[TABLE]
[ROW][C]Maximum Density Values[/C][/ROW]
[ROW][C]Kernel[/C][C]x-value[/C][C]max. density[/C][/ROW]
[ROW][C]Gaussian[/C][C]410.414909386646[/C][C]0.00417220523069448[/C][/ROW]
[ROW][C]Epanechnikov[/C][C]422.147712728044[/C][C]0.00407593971410631[/C][/ROW]
[ROW][C]Rectangular[/C][C]441.702384963708[/C][C]0.00422116809986303[/C][/ROW]
[ROW][C]Triangular[/C][C]414.325843833779[/C][C]0.00408199218928709[/C][/ROW]
[ROW][C]Biweight[/C][C]418.236778280912[/C][C]0.00408310259862002[/C][/ROW]
[ROW][C]Cosine[/C][C]415.62948864949[/C][C]0.00409363209625113[/C][/ROW]
[ROW][C]Optcosine[/C][C]422.147712728044[/C][C]0.00407873431662551[/C][/ROW]
[/TABLE]
Source: https://freestatistics.org/blog/index.php?pk=237552&T=3

Globally Unique Identifier (entire table): ba.freestatistics.org/blog/index.php?pk=237552&T=3

As an alternative you can also use a QR Code:  

The GUIDs for individual cells are displayed in the table below:

Maximum Density Values
Kernelx-valuemax. density
Gaussian410.4149093866460.00417220523069448
Epanechnikov422.1477127280440.00407593971410631
Rectangular441.7023849637080.00422116809986303
Triangular414.3258438337790.00408199218928709
Biweight418.2367782809120.00408310259862002
Cosine415.629488649490.00409363209625113
Optcosine422.1477127280440.00407873431662551


Parameters (Session):
par1 = 0 ; par2 = no ; par3 = 512 ;
Parameters (R input):
par1 = 0 ; par2 = no ; par3 = 512 ;
R code (references can be found in the software module):
if (par1 == '0') bw <- 'nrd0'
if (par1 != '0') bw <- as.numeric(par1)
par3 <- as.numeric(par3)
mydensity <- array(NA, dim=c(par3,8))
bitmap(file='density1.png')
mydensity1<-density(x,bw=bw,kernel='gaussian',na.rm=TRUE)
mydensity[,8] = signif(mydensity1$x,3)
mydensity[,1] = signif(mydensity1$y,3)
plot(mydensity1,main='Gaussian Kernel',xlab=xlab,ylab=ylab)
grid()
dev.off()
mydensity1
bitmap(file='density2.png')
mydensity2<-density(x,bw=bw,kernel='epanechnikov',na.rm=TRUE)
mydensity[,2] = signif(mydensity2$y,3)
plot(mydensity2,main='Epanechnikov Kernel',xlab=xlab,ylab=ylab)
grid()
dev.off()
bitmap(file='density3.png')
mydensity3<-density(x,bw=bw,kernel='rectangular',na.rm=TRUE)
mydensity[,3] = signif(mydensity3$y,3)
plot(mydensity3,main='Rectangular Kernel',xlab=xlab,ylab=ylab)
grid()
dev.off()
bitmap(file='density4.png')
mydensity4<-density(x,bw=bw,kernel='triangular',na.rm=TRUE)
mydensity[,4] = signif(mydensity4$y,3)
plot(mydensity4,main='Triangular Kernel',xlab=xlab,ylab=ylab)
grid()
dev.off()
bitmap(file='density5.png')
mydensity5<-density(x,bw=bw,kernel='biweight',na.rm=TRUE)
mydensity[,5] = signif(mydensity5$y,3)
plot(mydensity5,main='Biweight Kernel',xlab=xlab,ylab=ylab)
grid()
dev.off()
bitmap(file='density6.png')
mydensity6<-density(x,bw=bw,kernel='cosine',na.rm=TRUE)
mydensity[,6] = signif(mydensity6$y,3)
plot(mydensity6,main='Cosine Kernel',xlab=xlab,ylab=ylab)
grid()
dev.off()
bitmap(file='density7.png')
mydensity7<-density(x,bw=bw,kernel='optcosine',na.rm=TRUE)
mydensity[,7] = signif(mydensity7$y,3)
plot(mydensity7,main='Optcosine Kernel',xlab=xlab,ylab=ylab)
grid()
dev.off()
load(file='createtable')
a<-table.start()
a<-table.row.start(a)
a<-table.element(a,'Properties of Density Trace',2,TRUE)
a<-table.row.end(a)
a<-table.row.start(a)
a<-table.element(a,'Bandwidth',header=TRUE)
a<-table.element(a,mydensity1$bw)
a<-table.row.end(a)
a<-table.row.start(a)
a<-table.element(a,'#Observations',header=TRUE)
a<-table.element(a,mydensity1$n)
a<-table.row.end(a)
a<-table.end(a)
table.save(a,file='mytable.tab')
a<-table.start()
a<-table.row.start(a)
a<-table.element(a,'Maximum Density Values',3,TRUE)
a<-table.row.end(a)
a<-table.row.start(a)
a<-table.element(a,'Kernel',1,TRUE)
a<-table.element(a,'x-value',1,TRUE)
a<-table.element(a,'max. density',1,TRUE)
a<-table.row.end(a)
a<-table.row.start(a)
a<-table.element(a,'Gaussian',1,TRUE)
a<-table.element(a,mydensity1$x[mydensity1$y==max(mydensity1$y)],1)
a<-table.element(a,mydensity1$y[mydensity1$y==max(mydensity1$y)],1)
a<-table.row.end(a)
a<-table.row.start(a)
a<-table.element(a,'Epanechnikov',1,TRUE)
a<-table.element(a,mydensity2$x[mydensity2$y==max(mydensity2$y)],1)
a<-table.element(a,mydensity2$y[mydensity2$y==max(mydensity2$y)],1)
a<-table.row.end(a)
a<-table.row.start(a)
a<-table.element(a,'Rectangular',1,TRUE)
a<-table.element(a,mydensity3$x[mydensity3$y==max(mydensity3$y)],1)
a<-table.element(a,mydensity3$y[mydensity3$y==max(mydensity3$y)],1)
a<-table.row.end(a)
a<-table.row.start(a)
a<-table.element(a,'Triangular',1,TRUE)
a<-table.element(a,mydensity4$x[mydensity4$y==max(mydensity4$y)],1)
a<-table.element(a,mydensity4$y[mydensity4$y==max(mydensity4$y)],1)
a<-table.row.end(a)
a<-table.row.start(a)
a<-table.element(a,'Biweight',1,TRUE)
a<-table.element(a,mydensity5$x[mydensity5$y==max(mydensity5$y)],1)
a<-table.element(a,mydensity5$y[mydensity5$y==max(mydensity5$y)],1)
a<-table.row.end(a)
a<-table.row.start(a)
a<-table.element(a,'Cosine',1,TRUE)
a<-table.element(a,mydensity6$x[mydensity6$y==max(mydensity6$y)],1)
a<-table.element(a,mydensity6$y[mydensity6$y==max(mydensity6$y)],1)
a<-table.row.end(a)
a<-table.row.start(a)
a<-table.element(a,'Optcosine',1,TRUE)
a<-table.element(a,mydensity7$x[mydensity7$y==max(mydensity7$y)],1)
a<-table.element(a,mydensity7$y[mydensity7$y==max(mydensity7$y)],1)
a<-table.row.end(a)
a<-table.end(a)
table.save(a,file='mytable2.tab')
if (par2=='yes') {
a<-table.start()
a<-table.row.start(a)
a<-table.element(a,'Kernel Density Values',8,TRUE)
a<-table.row.end(a)
a<-table.row.start(a)
a<-table.element(a,'x-value',1,TRUE)
a<-table.element(a,'Gaussian',1,TRUE)
a<-table.element(a,'Epanechnikov',1,TRUE)
a<-table.element(a,'Rectangular',1,TRUE)
a<-table.element(a,'Triangular',1,TRUE)
a<-table.element(a,'Biweight',1,TRUE)
a<-table.element(a,'Cosine',1,TRUE)
a<-table.element(a,'Optcosine',1,TRUE)
a<-table.row.end(a)
for(i in 1:par3) {
a<-table.row.start(a)
a<-table.element(a,mydensity[i,8],1,TRUE)
for(j in 1:7) {
a<-table.element(a,mydensity[i,j],1)
}
a<-table.row.end(a)
}
a<-table.end(a)
table.save(a,file='mytable1.tab')
}