Free Statistics

of Irreproducible Research!

Author's title

Author*Unverified author*
R Software Modulerwasp_exponentialsmoothing.wasp
Title produced by softwareExponential Smoothing
Date of computationSun, 30 Nov 2014 17:20:41 +0000
Cite this page as followsStatistical Computations at FreeStatistics.org, Office for Research Development and Education, URL https://freestatistics.org/blog/index.php?v=date/2014/Nov/30/t1417368060ap5x9fvxa9ivo8c.htm/, Retrieved Sun, 19 May 2024 16:29:33 +0000
Statistical Computations at FreeStatistics.org, Office for Research Development and Education, URL https://freestatistics.org/blog/index.php?pk=261554, Retrieved Sun, 19 May 2024 16:29:33 +0000
QR Codes:

Original text written by user:
IsPrivate?No (this computation is public)
User-defined keywords
Estimated Impact78
Family? (F = Feedback message, R = changed R code, M = changed R Module, P = changed Parameters, D = changed Data)
-       [Exponential Smoothing] [] [2014-11-30 17:20:41] [f3f8000f3957416038d6f50ac60d9d25] [Current]
Feedback Forum

Post a new message
Dataseries X:
412
406
398
397
385
390
413
413
401
397
397
409
419
424
428
430
424
433
456
459
446
441
439
454
460
457
451
444
437
443
471
469
454
444
436
442
446
442
438
433
428
426
452
455
439
434
431
435
450
449
442
437
431
433
460
465
451
447
446
449
460
457
454
453
449
451
482
486
476
472
471
479


Summary of computational transaction
Raw Inputview raw input (R code)
Raw Outputview raw output of R engine
Computing time2 seconds
R Server'Sir Ronald Aylmer Fisher' @ fisher.wessa.net

\begin{tabular}{lllllllll}
\hline
Summary of computational transaction \tabularnewline
Raw Input & view raw input (R code)  \tabularnewline
Raw Output & view raw output of R engine  \tabularnewline
Computing time & 2 seconds \tabularnewline
R Server & 'Sir Ronald Aylmer Fisher' @ fisher.wessa.net \tabularnewline
\hline
\end{tabular}
%Source: https://freestatistics.org/blog/index.php?pk=261554&T=0

[TABLE]
[ROW][C]Summary of computational transaction[/C][/ROW]
[ROW][C]Raw Input[/C][C]view raw input (R code) [/C][/ROW]
[ROW][C]Raw Output[/C][C]view raw output of R engine [/C][/ROW]
[ROW][C]Computing time[/C][C]2 seconds[/C][/ROW]
[ROW][C]R Server[/C][C]'Sir Ronald Aylmer Fisher' @ fisher.wessa.net[/C][/ROW]
[/TABLE]
Source: https://freestatistics.org/blog/index.php?pk=261554&T=0

Globally Unique Identifier (entire table): ba.freestatistics.org/blog/index.php?pk=261554&T=0

As an alternative you can also use a QR Code:  

The GUIDs for individual cells are displayed in the table below:

Summary of computational transaction
Raw Inputview raw input (R code)
Raw Outputview raw output of R engine
Computing time2 seconds
R Server'Sir Ronald Aylmer Fisher' @ fisher.wessa.net


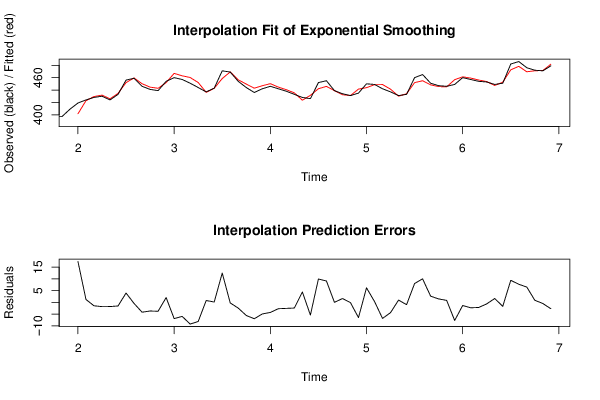
Estimated Parameters of Exponential Smoothing
ParameterValue
alpha0.83714278357738
beta0.139639228119873
gamma1

\begin{tabular}{lllllllll}
\hline
Estimated Parameters of Exponential Smoothing \tabularnewline
Parameter & Value \tabularnewline
alpha & 0.83714278357738 \tabularnewline
beta & 0.139639228119873 \tabularnewline
gamma & 1 \tabularnewline
\hline
\end{tabular}
%Source: https://freestatistics.org/blog/index.php?pk=261554&T=1

[TABLE]
[ROW][C]Estimated Parameters of Exponential Smoothing[/C][/ROW]
[ROW][C]Parameter[/C][C]Value[/C][/ROW]
[ROW][C]alpha[/C][C]0.83714278357738[/C][/ROW]
[ROW][C]beta[/C][C]0.139639228119873[/C][/ROW]
[ROW][C]gamma[/C][C]1[/C][/ROW]
[/TABLE]
Source: https://freestatistics.org/blog/index.php?pk=261554&T=1

Globally Unique Identifier (entire table): ba.freestatistics.org/blog/index.php?pk=261554&T=1

As an alternative you can also use a QR Code:  

The GUIDs for individual cells are displayed in the table below:

Estimated Parameters of Exponential Smoothing
ParameterValue
alpha0.83714278357738
beta0.139639228119873
gamma1


Interpolation Forecasts of Exponential Smoothing
tObservedFittedResiduals
13419401.6001602564117.3998397435898
14424422.7427116193781.2572883806223
15428429.435283729047-1.43528372904734
16430431.789340103829-1.7893401038292
17424425.762830509904-1.76283050990355
18433434.510775252754-1.51077525275394
19456452.001453005143.99854699486002
20459459.446642154663-0.446642154663436
21446450.160028390548-4.16002839054789
22441444.653481253589-3.65348125358912
23439442.768901847136-3.76890184713636
24454451.9304552739852.06954472601512
25460466.888570498716-6.88857049871615
26457462.954583838697-5.95458383869709
27451460.21349144428-9.21349144428001
28444452.131367095955-8.13136709595528
29437436.1915729269730.808427073027133
30443442.8252314908910.174768509109072
31471458.5133746464712.4866253535298
32469469.22179707732-0.221797077319593
33454456.42637380312-2.4263738031205
34444449.564013457463-5.56401345746292
35436442.948286894358-6.94828689435849
36442446.914448732419-4.91444873241892
37446450.266030352925-4.2660303529255
38442444.68512017303-2.68512017303044
39438440.53802219853-2.53802219853003
40433435.388522460538-2.38852246053818
41428423.5516180662314.44838193376944
42426431.394144883509-5.39414488350889
43452442.0392946112559.96070538874477
44455445.8821356443359.11786435566478
45439438.9567313675650.0432686324350016
46434432.34994335391.65005664610032
47431431.090411014681-0.0904110146811377
48435441.472917576376-6.47291757637583
49450443.7873542142026.21264578579763
50449448.6229071188730.377092881127055
51442448.808093509628-6.80809350962789
52437441.353937660801-4.35393766080148
53431430.0010424435970.998957556402956
54433433.96565441126-0.965654411260346
55460451.9490851051168.05091489488365
56465454.96299937886610.0370006211339
57451448.3437284750362.65627152496387
58447445.5060772197221.49392278027767
59446445.1341423107730.865857689227425
60449456.691282424785-7.69128242478462
61460461.322822239947-1.32282223994656
62457459.289982612453-2.28998261245334
63454456.150742877529-2.15074287752941
64453453.618022667632-0.618022667631863
65449447.3239914050971.67600859490295
66451452.674198483979-1.67419848397896
67482472.5888205907599.41117940924056
68486478.2798616340627.72013836593783
69476469.4631474723046.53685252769594
70472471.0825380236520.917461976347624
71471471.456089386437-0.456089386437213
72479481.688797300098-2.68879730009797

\begin{tabular}{lllllllll}
\hline
Interpolation Forecasts of Exponential Smoothing \tabularnewline
t & Observed & Fitted & Residuals \tabularnewline
13 & 419 & 401.60016025641 & 17.3998397435898 \tabularnewline
14 & 424 & 422.742711619378 & 1.2572883806223 \tabularnewline
15 & 428 & 429.435283729047 & -1.43528372904734 \tabularnewline
16 & 430 & 431.789340103829 & -1.7893401038292 \tabularnewline
17 & 424 & 425.762830509904 & -1.76283050990355 \tabularnewline
18 & 433 & 434.510775252754 & -1.51077525275394 \tabularnewline
19 & 456 & 452.00145300514 & 3.99854699486002 \tabularnewline
20 & 459 & 459.446642154663 & -0.446642154663436 \tabularnewline
21 & 446 & 450.160028390548 & -4.16002839054789 \tabularnewline
22 & 441 & 444.653481253589 & -3.65348125358912 \tabularnewline
23 & 439 & 442.768901847136 & -3.76890184713636 \tabularnewline
24 & 454 & 451.930455273985 & 2.06954472601512 \tabularnewline
25 & 460 & 466.888570498716 & -6.88857049871615 \tabularnewline
26 & 457 & 462.954583838697 & -5.95458383869709 \tabularnewline
27 & 451 & 460.21349144428 & -9.21349144428001 \tabularnewline
28 & 444 & 452.131367095955 & -8.13136709595528 \tabularnewline
29 & 437 & 436.191572926973 & 0.808427073027133 \tabularnewline
30 & 443 & 442.825231490891 & 0.174768509109072 \tabularnewline
31 & 471 & 458.51337464647 & 12.4866253535298 \tabularnewline
32 & 469 & 469.22179707732 & -0.221797077319593 \tabularnewline
33 & 454 & 456.42637380312 & -2.4263738031205 \tabularnewline
34 & 444 & 449.564013457463 & -5.56401345746292 \tabularnewline
35 & 436 & 442.948286894358 & -6.94828689435849 \tabularnewline
36 & 442 & 446.914448732419 & -4.91444873241892 \tabularnewline
37 & 446 & 450.266030352925 & -4.2660303529255 \tabularnewline
38 & 442 & 444.68512017303 & -2.68512017303044 \tabularnewline
39 & 438 & 440.53802219853 & -2.53802219853003 \tabularnewline
40 & 433 & 435.388522460538 & -2.38852246053818 \tabularnewline
41 & 428 & 423.551618066231 & 4.44838193376944 \tabularnewline
42 & 426 & 431.394144883509 & -5.39414488350889 \tabularnewline
43 & 452 & 442.039294611255 & 9.96070538874477 \tabularnewline
44 & 455 & 445.882135644335 & 9.11786435566478 \tabularnewline
45 & 439 & 438.956731367565 & 0.0432686324350016 \tabularnewline
46 & 434 & 432.3499433539 & 1.65005664610032 \tabularnewline
47 & 431 & 431.090411014681 & -0.0904110146811377 \tabularnewline
48 & 435 & 441.472917576376 & -6.47291757637583 \tabularnewline
49 & 450 & 443.787354214202 & 6.21264578579763 \tabularnewline
50 & 449 & 448.622907118873 & 0.377092881127055 \tabularnewline
51 & 442 & 448.808093509628 & -6.80809350962789 \tabularnewline
52 & 437 & 441.353937660801 & -4.35393766080148 \tabularnewline
53 & 431 & 430.001042443597 & 0.998957556402956 \tabularnewline
54 & 433 & 433.96565441126 & -0.965654411260346 \tabularnewline
55 & 460 & 451.949085105116 & 8.05091489488365 \tabularnewline
56 & 465 & 454.962999378866 & 10.0370006211339 \tabularnewline
57 & 451 & 448.343728475036 & 2.65627152496387 \tabularnewline
58 & 447 & 445.506077219722 & 1.49392278027767 \tabularnewline
59 & 446 & 445.134142310773 & 0.865857689227425 \tabularnewline
60 & 449 & 456.691282424785 & -7.69128242478462 \tabularnewline
61 & 460 & 461.322822239947 & -1.32282223994656 \tabularnewline
62 & 457 & 459.289982612453 & -2.28998261245334 \tabularnewline
63 & 454 & 456.150742877529 & -2.15074287752941 \tabularnewline
64 & 453 & 453.618022667632 & -0.618022667631863 \tabularnewline
65 & 449 & 447.323991405097 & 1.67600859490295 \tabularnewline
66 & 451 & 452.674198483979 & -1.67419848397896 \tabularnewline
67 & 482 & 472.588820590759 & 9.41117940924056 \tabularnewline
68 & 486 & 478.279861634062 & 7.72013836593783 \tabularnewline
69 & 476 & 469.463147472304 & 6.53685252769594 \tabularnewline
70 & 472 & 471.082538023652 & 0.917461976347624 \tabularnewline
71 & 471 & 471.456089386437 & -0.456089386437213 \tabularnewline
72 & 479 & 481.688797300098 & -2.68879730009797 \tabularnewline
\hline
\end{tabular}
%Source: https://freestatistics.org/blog/index.php?pk=261554&T=2

[TABLE]
[ROW][C]Interpolation Forecasts of Exponential Smoothing[/C][/ROW]
[ROW][C]t[/C][C]Observed[/C][C]Fitted[/C][C]Residuals[/C][/ROW]
[ROW][C]13[/C][C]419[/C][C]401.60016025641[/C][C]17.3998397435898[/C][/ROW]
[ROW][C]14[/C][C]424[/C][C]422.742711619378[/C][C]1.2572883806223[/C][/ROW]
[ROW][C]15[/C][C]428[/C][C]429.435283729047[/C][C]-1.43528372904734[/C][/ROW]
[ROW][C]16[/C][C]430[/C][C]431.789340103829[/C][C]-1.7893401038292[/C][/ROW]
[ROW][C]17[/C][C]424[/C][C]425.762830509904[/C][C]-1.76283050990355[/C][/ROW]
[ROW][C]18[/C][C]433[/C][C]434.510775252754[/C][C]-1.51077525275394[/C][/ROW]
[ROW][C]19[/C][C]456[/C][C]452.00145300514[/C][C]3.99854699486002[/C][/ROW]
[ROW][C]20[/C][C]459[/C][C]459.446642154663[/C][C]-0.446642154663436[/C][/ROW]
[ROW][C]21[/C][C]446[/C][C]450.160028390548[/C][C]-4.16002839054789[/C][/ROW]
[ROW][C]22[/C][C]441[/C][C]444.653481253589[/C][C]-3.65348125358912[/C][/ROW]
[ROW][C]23[/C][C]439[/C][C]442.768901847136[/C][C]-3.76890184713636[/C][/ROW]
[ROW][C]24[/C][C]454[/C][C]451.930455273985[/C][C]2.06954472601512[/C][/ROW]
[ROW][C]25[/C][C]460[/C][C]466.888570498716[/C][C]-6.88857049871615[/C][/ROW]
[ROW][C]26[/C][C]457[/C][C]462.954583838697[/C][C]-5.95458383869709[/C][/ROW]
[ROW][C]27[/C][C]451[/C][C]460.21349144428[/C][C]-9.21349144428001[/C][/ROW]
[ROW][C]28[/C][C]444[/C][C]452.131367095955[/C][C]-8.13136709595528[/C][/ROW]
[ROW][C]29[/C][C]437[/C][C]436.191572926973[/C][C]0.808427073027133[/C][/ROW]
[ROW][C]30[/C][C]443[/C][C]442.825231490891[/C][C]0.174768509109072[/C][/ROW]
[ROW][C]31[/C][C]471[/C][C]458.51337464647[/C][C]12.4866253535298[/C][/ROW]
[ROW][C]32[/C][C]469[/C][C]469.22179707732[/C][C]-0.221797077319593[/C][/ROW]
[ROW][C]33[/C][C]454[/C][C]456.42637380312[/C][C]-2.4263738031205[/C][/ROW]
[ROW][C]34[/C][C]444[/C][C]449.564013457463[/C][C]-5.56401345746292[/C][/ROW]
[ROW][C]35[/C][C]436[/C][C]442.948286894358[/C][C]-6.94828689435849[/C][/ROW]
[ROW][C]36[/C][C]442[/C][C]446.914448732419[/C][C]-4.91444873241892[/C][/ROW]
[ROW][C]37[/C][C]446[/C][C]450.266030352925[/C][C]-4.2660303529255[/C][/ROW]
[ROW][C]38[/C][C]442[/C][C]444.68512017303[/C][C]-2.68512017303044[/C][/ROW]
[ROW][C]39[/C][C]438[/C][C]440.53802219853[/C][C]-2.53802219853003[/C][/ROW]
[ROW][C]40[/C][C]433[/C][C]435.388522460538[/C][C]-2.38852246053818[/C][/ROW]
[ROW][C]41[/C][C]428[/C][C]423.551618066231[/C][C]4.44838193376944[/C][/ROW]
[ROW][C]42[/C][C]426[/C][C]431.394144883509[/C][C]-5.39414488350889[/C][/ROW]
[ROW][C]43[/C][C]452[/C][C]442.039294611255[/C][C]9.96070538874477[/C][/ROW]
[ROW][C]44[/C][C]455[/C][C]445.882135644335[/C][C]9.11786435566478[/C][/ROW]
[ROW][C]45[/C][C]439[/C][C]438.956731367565[/C][C]0.0432686324350016[/C][/ROW]
[ROW][C]46[/C][C]434[/C][C]432.3499433539[/C][C]1.65005664610032[/C][/ROW]
[ROW][C]47[/C][C]431[/C][C]431.090411014681[/C][C]-0.0904110146811377[/C][/ROW]
[ROW][C]48[/C][C]435[/C][C]441.472917576376[/C][C]-6.47291757637583[/C][/ROW]
[ROW][C]49[/C][C]450[/C][C]443.787354214202[/C][C]6.21264578579763[/C][/ROW]
[ROW][C]50[/C][C]449[/C][C]448.622907118873[/C][C]0.377092881127055[/C][/ROW]
[ROW][C]51[/C][C]442[/C][C]448.808093509628[/C][C]-6.80809350962789[/C][/ROW]
[ROW][C]52[/C][C]437[/C][C]441.353937660801[/C][C]-4.35393766080148[/C][/ROW]
[ROW][C]53[/C][C]431[/C][C]430.001042443597[/C][C]0.998957556402956[/C][/ROW]
[ROW][C]54[/C][C]433[/C][C]433.96565441126[/C][C]-0.965654411260346[/C][/ROW]
[ROW][C]55[/C][C]460[/C][C]451.949085105116[/C][C]8.05091489488365[/C][/ROW]
[ROW][C]56[/C][C]465[/C][C]454.962999378866[/C][C]10.0370006211339[/C][/ROW]
[ROW][C]57[/C][C]451[/C][C]448.343728475036[/C][C]2.65627152496387[/C][/ROW]
[ROW][C]58[/C][C]447[/C][C]445.506077219722[/C][C]1.49392278027767[/C][/ROW]
[ROW][C]59[/C][C]446[/C][C]445.134142310773[/C][C]0.865857689227425[/C][/ROW]
[ROW][C]60[/C][C]449[/C][C]456.691282424785[/C][C]-7.69128242478462[/C][/ROW]
[ROW][C]61[/C][C]460[/C][C]461.322822239947[/C][C]-1.32282223994656[/C][/ROW]
[ROW][C]62[/C][C]457[/C][C]459.289982612453[/C][C]-2.28998261245334[/C][/ROW]
[ROW][C]63[/C][C]454[/C][C]456.150742877529[/C][C]-2.15074287752941[/C][/ROW]
[ROW][C]64[/C][C]453[/C][C]453.618022667632[/C][C]-0.618022667631863[/C][/ROW]
[ROW][C]65[/C][C]449[/C][C]447.323991405097[/C][C]1.67600859490295[/C][/ROW]
[ROW][C]66[/C][C]451[/C][C]452.674198483979[/C][C]-1.67419848397896[/C][/ROW]
[ROW][C]67[/C][C]482[/C][C]472.588820590759[/C][C]9.41117940924056[/C][/ROW]
[ROW][C]68[/C][C]486[/C][C]478.279861634062[/C][C]7.72013836593783[/C][/ROW]
[ROW][C]69[/C][C]476[/C][C]469.463147472304[/C][C]6.53685252769594[/C][/ROW]
[ROW][C]70[/C][C]472[/C][C]471.082538023652[/C][C]0.917461976347624[/C][/ROW]
[ROW][C]71[/C][C]471[/C][C]471.456089386437[/C][C]-0.456089386437213[/C][/ROW]
[ROW][C]72[/C][C]479[/C][C]481.688797300098[/C][C]-2.68879730009797[/C][/ROW]
[/TABLE]
Source: https://freestatistics.org/blog/index.php?pk=261554&T=2

Globally Unique Identifier (entire table): ba.freestatistics.org/blog/index.php?pk=261554&T=2

As an alternative you can also use a QR Code:  

The GUIDs for individual cells are displayed in the table below:

Interpolation Forecasts of Exponential Smoothing
tObservedFittedResiduals
13419401.6001602564117.3998397435898
14424422.7427116193781.2572883806223
15428429.435283729047-1.43528372904734
16430431.789340103829-1.7893401038292
17424425.762830509904-1.76283050990355
18433434.510775252754-1.51077525275394
19456452.001453005143.99854699486002
20459459.446642154663-0.446642154663436
21446450.160028390548-4.16002839054789
22441444.653481253589-3.65348125358912
23439442.768901847136-3.76890184713636
24454451.9304552739852.06954472601512
25460466.888570498716-6.88857049871615
26457462.954583838697-5.95458383869709
27451460.21349144428-9.21349144428001
28444452.131367095955-8.13136709595528
29437436.1915729269730.808427073027133
30443442.8252314908910.174768509109072
31471458.5133746464712.4866253535298
32469469.22179707732-0.221797077319593
33454456.42637380312-2.4263738031205
34444449.564013457463-5.56401345746292
35436442.948286894358-6.94828689435849
36442446.914448732419-4.91444873241892
37446450.266030352925-4.2660303529255
38442444.68512017303-2.68512017303044
39438440.53802219853-2.53802219853003
40433435.388522460538-2.38852246053818
41428423.5516180662314.44838193376944
42426431.394144883509-5.39414488350889
43452442.0392946112559.96070538874477
44455445.8821356443359.11786435566478
45439438.9567313675650.0432686324350016
46434432.34994335391.65005664610032
47431431.090411014681-0.0904110146811377
48435441.472917576376-6.47291757637583
49450443.7873542142026.21264578579763
50449448.6229071188730.377092881127055
51442448.808093509628-6.80809350962789
52437441.353937660801-4.35393766080148
53431430.0010424435970.998957556402956
54433433.96565441126-0.965654411260346
55460451.9490851051168.05091489488365
56465454.96299937886610.0370006211339
57451448.3437284750362.65627152496387
58447445.5060772197221.49392278027767
59446445.1341423107730.865857689227425
60449456.691282424785-7.69128242478462
61460461.322822239947-1.32282223994656
62457459.289982612453-2.28998261245334
63454456.150742877529-2.15074287752941
64453453.618022667632-0.618022667631863
65449447.3239914050971.67600859490295
66451452.674198483979-1.67419848397896
67482472.5888205907599.41117940924056
68486478.2798616340627.72013836593783
69476469.4631474723046.53685252769594
70472471.0825380236520.917461976347624
71471471.456089386437-0.456089386437213
72479481.688797300098-2.68879730009797


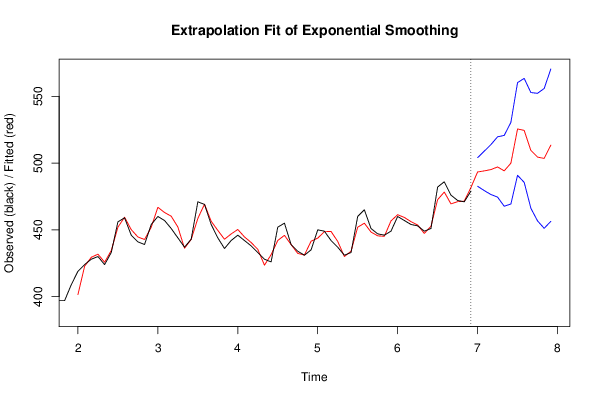
Extrapolation Forecasts of Exponential Smoothing
tForecast95% Lower Bound95% Upper Bound
73493.305879776425482.628717652765503.983041900085
74494.138156072769479.381275974687508.895036170852
75495.121563153432476.452999286323513.79012702054
76497.07328205208474.504126311569519.642437792591
77494.17681483057467.654451585609520.699178075531
78499.889027282628469.33026650006530.447788065195
79525.51690603586490.822687264196560.211124807524
80524.460279806983485.523095537207563.39746407676
81509.491764258998466.199731867983552.783796650013
82504.46333615461456.702559724933552.224112584288
83503.477517216914451.133509836388555.82152459744
84513.414109521357456.372670208025570.45554883469

\begin{tabular}{lllllllll}
\hline
Extrapolation Forecasts of Exponential Smoothing \tabularnewline
t & Forecast & 95% Lower Bound & 95% Upper Bound \tabularnewline
73 & 493.305879776425 & 482.628717652765 & 503.983041900085 \tabularnewline
74 & 494.138156072769 & 479.381275974687 & 508.895036170852 \tabularnewline
75 & 495.121563153432 & 476.452999286323 & 513.79012702054 \tabularnewline
76 & 497.07328205208 & 474.504126311569 & 519.642437792591 \tabularnewline
77 & 494.17681483057 & 467.654451585609 & 520.699178075531 \tabularnewline
78 & 499.889027282628 & 469.33026650006 & 530.447788065195 \tabularnewline
79 & 525.51690603586 & 490.822687264196 & 560.211124807524 \tabularnewline
80 & 524.460279806983 & 485.523095537207 & 563.39746407676 \tabularnewline
81 & 509.491764258998 & 466.199731867983 & 552.783796650013 \tabularnewline
82 & 504.46333615461 & 456.702559724933 & 552.224112584288 \tabularnewline
83 & 503.477517216914 & 451.133509836388 & 555.82152459744 \tabularnewline
84 & 513.414109521357 & 456.372670208025 & 570.45554883469 \tabularnewline
\hline
\end{tabular}
%Source: https://freestatistics.org/blog/index.php?pk=261554&T=3

[TABLE]
[ROW][C]Extrapolation Forecasts of Exponential Smoothing[/C][/ROW]
[ROW][C]t[/C][C]Forecast[/C][C]95% Lower Bound[/C][C]95% Upper Bound[/C][/ROW]
[ROW][C]73[/C][C]493.305879776425[/C][C]482.628717652765[/C][C]503.983041900085[/C][/ROW]
[ROW][C]74[/C][C]494.138156072769[/C][C]479.381275974687[/C][C]508.895036170852[/C][/ROW]
[ROW][C]75[/C][C]495.121563153432[/C][C]476.452999286323[/C][C]513.79012702054[/C][/ROW]
[ROW][C]76[/C][C]497.07328205208[/C][C]474.504126311569[/C][C]519.642437792591[/C][/ROW]
[ROW][C]77[/C][C]494.17681483057[/C][C]467.654451585609[/C][C]520.699178075531[/C][/ROW]
[ROW][C]78[/C][C]499.889027282628[/C][C]469.33026650006[/C][C]530.447788065195[/C][/ROW]
[ROW][C]79[/C][C]525.51690603586[/C][C]490.822687264196[/C][C]560.211124807524[/C][/ROW]
[ROW][C]80[/C][C]524.460279806983[/C][C]485.523095537207[/C][C]563.39746407676[/C][/ROW]
[ROW][C]81[/C][C]509.491764258998[/C][C]466.199731867983[/C][C]552.783796650013[/C][/ROW]
[ROW][C]82[/C][C]504.46333615461[/C][C]456.702559724933[/C][C]552.224112584288[/C][/ROW]
[ROW][C]83[/C][C]503.477517216914[/C][C]451.133509836388[/C][C]555.82152459744[/C][/ROW]
[ROW][C]84[/C][C]513.414109521357[/C][C]456.372670208025[/C][C]570.45554883469[/C][/ROW]
[/TABLE]
Source: https://freestatistics.org/blog/index.php?pk=261554&T=3

Globally Unique Identifier (entire table): ba.freestatistics.org/blog/index.php?pk=261554&T=3

As an alternative you can also use a QR Code:  

The GUIDs for individual cells are displayed in the table below:

Extrapolation Forecasts of Exponential Smoothing
tForecast95% Lower Bound95% Upper Bound
73493.305879776425482.628717652765503.983041900085
74494.138156072769479.381275974687508.895036170852
75495.121563153432476.452999286323513.79012702054
76497.07328205208474.504126311569519.642437792591
77494.17681483057467.654451585609520.699178075531
78499.889027282628469.33026650006530.447788065195
79525.51690603586490.822687264196560.211124807524
80524.460279806983485.523095537207563.39746407676
81509.491764258998466.199731867983552.783796650013
82504.46333615461456.702559724933552.224112584288
83503.477517216914451.133509836388555.82152459744
84513.414109521357456.372670208025570.45554883469


Parameters (Session):
par1 = 12 ; par2 = Triple ; par3 = additive ;
Parameters (R input):
par1 = 12 ; par2 = Triple ; par3 = additive ;
R code (references can be found in the software module):
par1 <- as.numeric(par1)
if (par2 == 'Single') K <- 1
if (par2 == 'Double') K <- 2
if (par2 == 'Triple') K <- par1
nx <- length(x)
nxmK <- nx - K
x <- ts(x, frequency = par1)
if (par2 == 'Single') fit <- HoltWinters(x, gamma=F, beta=F)
if (par2 == 'Double') fit <- HoltWinters(x, gamma=F)
if (par2 == 'Triple') fit <- HoltWinters(x, seasonal=par3)
fit
myresid <- x - fit$fitted[,'xhat']
bitmap(file='test1.png')
op <- par(mfrow=c(2,1))
plot(fit,ylab='Observed (black) / Fitted (red)',main='Interpolation Fit of Exponential Smoothing')
plot(myresid,ylab='Residuals',main='Interpolation Prediction Errors')
par(op)
dev.off()
bitmap(file='test2.png')
p <- predict(fit, par1, prediction.interval=TRUE)
np <- length(p[,1])
plot(fit,p,ylab='Observed (black) / Fitted (red)',main='Extrapolation Fit of Exponential Smoothing')
dev.off()
bitmap(file='test3.png')
op <- par(mfrow = c(2,2))
acf(as.numeric(myresid),lag.max = nx/2,main='Residual ACF')
spectrum(myresid,main='Residals Periodogram')
cpgram(myresid,main='Residal Cumulative Periodogram')
qqnorm(myresid,main='Residual Normal QQ Plot')
qqline(myresid)
par(op)
dev.off()
load(file='createtable')
a<-table.start()
a<-table.row.start(a)
a<-table.element(a,'Estimated Parameters of Exponential Smoothing',2,TRUE)
a<-table.row.end(a)
a<-table.row.start(a)
a<-table.element(a,'Parameter',header=TRUE)
a<-table.element(a,'Value',header=TRUE)
a<-table.row.end(a)
a<-table.row.start(a)
a<-table.element(a,'alpha',header=TRUE)
a<-table.element(a,fit$alpha)
a<-table.row.end(a)
a<-table.row.start(a)
a<-table.element(a,'beta',header=TRUE)
a<-table.element(a,fit$beta)
a<-table.row.end(a)
a<-table.row.start(a)
a<-table.element(a,'gamma',header=TRUE)
a<-table.element(a,fit$gamma)
a<-table.row.end(a)
a<-table.end(a)
table.save(a,file='mytable.tab')
a<-table.start()
a<-table.row.start(a)
a<-table.element(a,'Interpolation Forecasts of Exponential Smoothing',4,TRUE)
a<-table.row.end(a)
a<-table.row.start(a)
a<-table.element(a,'t',header=TRUE)
a<-table.element(a,'Observed',header=TRUE)
a<-table.element(a,'Fitted',header=TRUE)
a<-table.element(a,'Residuals',header=TRUE)
a<-table.row.end(a)
for (i in 1:nxmK) {
a<-table.row.start(a)
a<-table.element(a,i+K,header=TRUE)
a<-table.element(a,x[i+K])
a<-table.element(a,fit$fitted[i,'xhat'])
a<-table.element(a,myresid[i])
a<-table.row.end(a)
}
a<-table.end(a)
table.save(a,file='mytable1.tab')
a<-table.start()
a<-table.row.start(a)
a<-table.element(a,'Extrapolation Forecasts of Exponential Smoothing',4,TRUE)
a<-table.row.end(a)
a<-table.row.start(a)
a<-table.element(a,'t',header=TRUE)
a<-table.element(a,'Forecast',header=TRUE)
a<-table.element(a,'95% Lower Bound',header=TRUE)
a<-table.element(a,'95% Upper Bound',header=TRUE)
a<-table.row.end(a)
for (i in 1:np) {
a<-table.row.start(a)
a<-table.element(a,nx+i,header=TRUE)
a<-table.element(a,p[i,'fit'])
a<-table.element(a,p[i,'lwr'])
a<-table.element(a,p[i,'upr'])
a<-table.row.end(a)
}
a<-table.end(a)
table.save(a,file='mytable2.tab')