Free Statistics
of Irreproducible Research!
Description of Statistical Computation | ||||||||||||||||||||||||||||||
|---|---|---|---|---|---|---|---|---|---|---|---|---|---|---|---|---|---|---|---|---|---|---|---|---|---|---|---|---|---|---|
| Author's title | ||||||||||||||||||||||||||||||
| Author | *The author of this computation has been verified* | |||||||||||||||||||||||||||||
| R Software Module | rwasp_Distributional Plots.wasp | |||||||||||||||||||||||||||||
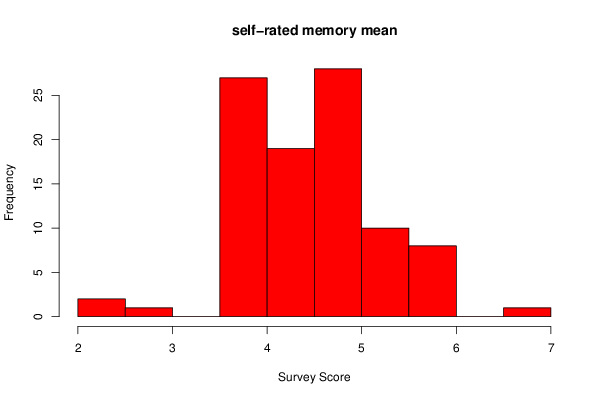
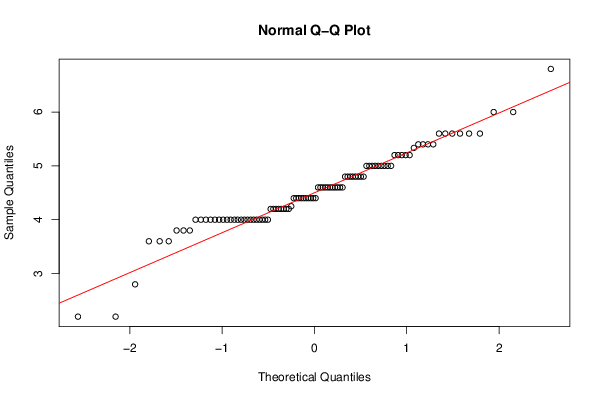
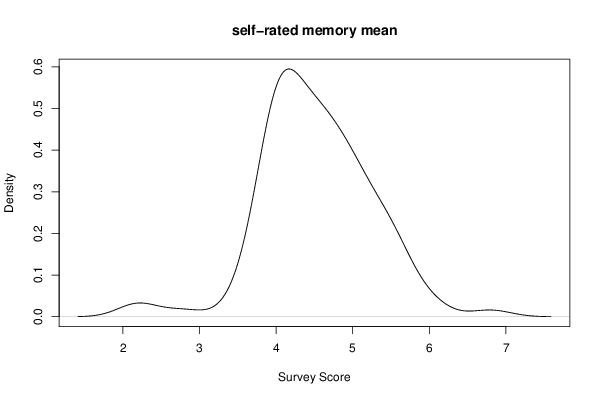
| Title produced by software | Histogram, QQplot and Density | |||||||||||||||||||||||||||||
| Date of computation | Sat, 29 Nov 2014 13:25:45 +0000 | |||||||||||||||||||||||||||||
| Cite this page as follows | Statistical Computations at FreeStatistics.org, Office for Research Development and Education, URL https://freestatistics.org/blog/index.php?v=date/2014/Nov/29/t14172675641a2700zg7z0vlhk.htm/, Retrieved Sun, 19 May 2024 13:56:29 +0000 | |||||||||||||||||||||||||||||
| Statistical Computations at FreeStatistics.org, Office for Research Development and Education, URL https://freestatistics.org/blog/index.php?pk=261107, Retrieved Sun, 19 May 2024 13:56:29 +0000 | ||||||||||||||||||||||||||||||
| QR Codes: | ||||||||||||||||||||||||||||||
|
| ||||||||||||||||||||||||||||||
| Original text written by user: | ||||||||||||||||||||||||||||||
| IsPrivate? | No (this computation is public) | |||||||||||||||||||||||||||||
| User-defined keywords | ||||||||||||||||||||||||||||||
| Estimated Impact | 123 | |||||||||||||||||||||||||||||
Tree of Dependent Computations | ||||||||||||||||||||||||||||||
| Family? (F = Feedback message, R = changed R code, M = changed R Module, P = changed Parameters, D = changed Data) | ||||||||||||||||||||||||||||||
| - [Histogram, QQplot and Density] [] [2014-10-11 09:05:01] [32b17a345b130fdf5cc88718ed94a974] - R D [Histogram, QQplot and Density] [Q1] [2014-11-27 11:30:39] [021e629afd0307032aad5facffdb37fc] - D [Histogram, QQplot and Density] [esr] [2014-11-27 11:37:47] [021e629afd0307032aad5facffdb37fc] - R D [Histogram, QQplot and Density] [week 7 q2 composi...] [2014-11-29 13:05:08] [d83283e7c42ef05cd3465b9a9fb48224] - R D [Histogram, QQplot and Density] [week 7 q1 composi...] [2014-11-29 13:10:40] [d83283e7c42ef05cd3465b9a9fb48224] - D [Histogram, QQplot and Density] [week 7 question 1...] [2014-11-29 13:15:45] [d83283e7c42ef05cd3465b9a9fb48224] - D [Histogram, QQplot and Density] [week 7 1 self-rat...] [2014-11-29 13:25:45] [430d68408478de9bcd3bee55914cb721] [Current] - D [Histogram, QQplot and Density] [WEEK 7 1 self-rat...] [2014-11-29 13:28:02] [d83283e7c42ef05cd3465b9a9fb48224] - D [Histogram, QQplot and Density] [WEEK 7 1 self-rat...] [2014-11-29 13:30:19] [d83283e7c42ef05cd3465b9a9fb48224] | ||||||||||||||||||||||||||||||
| Feedback Forum | ||||||||||||||||||||||||||||||
Post a new message | ||||||||||||||||||||||||||||||
Dataset | ||||||||||||||||||||||||||||||
| Dataseries X: | ||||||||||||||||||||||||||||||
4.6 5.6 4 5 4.4 6 4 4.4 4.6 4 4.8 5.333333333 4.4 5.2 5.2 4 5.2 4.8 4 4.4 5.6 6 4.8 4.2 4 2.8 4.8 4.2 4.8 5.2 4.6 4.4 4 3.6 4.6 4 2.2 4 5.6 3.6 4 5.4 5 4.4 4.6 3.8 4.25 4.6 5.2 4 4.2 4.2 4.6 5.6 5.4 4 3.6 4.4 4.6 4.4 4 5 4.8 4 4.6 4 5 4.2 4.8 6.8 4 4.2 5 5 4.6 4.8 5 4.2 4 4 3.8 4.6 4 4.2 5.6 4 5.6 3.8 5 5.4 5 4.4 4.4 4 5.4 2.2 | ||||||||||||||||||||||||||||||
Tables (Output of Computation) | ||||||||||||||||||||||||||||||
| ||||||||||||||||||||||||||||||
Figures (Output of Computation) | ||||||||||||||||||||||||||||||
Input Parameters & R Code | ||||||||||||||||||||||||||||||
| Parameters (Session): | ||||||||||||||||||||||||||||||
| par1 = 10 ; | ||||||||||||||||||||||||||||||
| Parameters (R input): | ||||||||||||||||||||||||||||||
| par1 = 10 ; | ||||||||||||||||||||||||||||||
| R code (references can be found in the software module): | ||||||||||||||||||||||||||||||
par1 <- '10' | ||||||||||||||||||||||||||||||