Free Statistics

of Irreproducible Research!

Author's title

Author*Unverified author*
R Software Modulerwasp_exponentialsmoothing.wasp
Title produced by softwareExponential Smoothing
Date of computationFri, 28 Nov 2014 16:33:09 +0000
Cite this page as followsStatistical Computations at FreeStatistics.org, Office for Research Development and Education, URL https://freestatistics.org/blog/index.php?v=date/2014/Nov/28/t1417192437da8tryv3ckl4qmr.htm/, Retrieved Sun, 19 May 2024 14:57:51 +0000
Statistical Computations at FreeStatistics.org, Office for Research Development and Education, URL https://freestatistics.org/blog/index.php?pk=260964, Retrieved Sun, 19 May 2024 14:57:51 +0000
QR Codes:

Original text written by user:
IsPrivate?No (this computation is public)
User-defined keywords
Estimated Impact63
Family? (F = Feedback message, R = changed R code, M = changed R Module, P = changed Parameters, D = changed Data)
-       [Exponential Smoothing] [Exponential smoot...] [2014-11-28 16:33:09] [8ab2f7883acfec92c4c89513940c9803] [Current]
Feedback Forum

Post a new message
Dataseries X:
876
819
610
757
840
745
662
563
624
588
754
705
661
737
542
709
787
689
601
467
555
471
718
676
700
781
596
779
727
692
560
517
572
491
639
585
596
617
445
615
571
592
580
487
540
546
649
620
593
528
492
570
592
512
475
405
540
472
567
538
508
578
466
540
515
550
485
355
386
365
417
356


Summary of computational transaction
Raw Inputview raw input (R code)
Raw Outputview raw output of R engine
Computing time2 seconds
R Server'Gertrude Mary Cox' @ cox.wessa.net

\begin{tabular}{lllllllll}
\hline
Summary of computational transaction \tabularnewline
Raw Input & view raw input (R code)  \tabularnewline
Raw Output & view raw output of R engine  \tabularnewline
Computing time & 2 seconds \tabularnewline
R Server & 'Gertrude Mary Cox' @ cox.wessa.net \tabularnewline
\hline
\end{tabular}
%Source: https://freestatistics.org/blog/index.php?pk=260964&T=0

[TABLE]
[ROW][C]Summary of computational transaction[/C][/ROW]
[ROW][C]Raw Input[/C][C]view raw input (R code) [/C][/ROW]
[ROW][C]Raw Output[/C][C]view raw output of R engine [/C][/ROW]
[ROW][C]Computing time[/C][C]2 seconds[/C][/ROW]
[ROW][C]R Server[/C][C]'Gertrude Mary Cox' @ cox.wessa.net[/C][/ROW]
[/TABLE]
Source: https://freestatistics.org/blog/index.php?pk=260964&T=0

Globally Unique Identifier (entire table): ba.freestatistics.org/blog/index.php?pk=260964&T=0

As an alternative you can also use a QR Code:  

The GUIDs for individual cells are displayed in the table below:

Summary of computational transaction
Raw Inputview raw input (R code)
Raw Outputview raw output of R engine
Computing time2 seconds
R Server'Gertrude Mary Cox' @ cox.wessa.net


Estimated Parameters of Exponential Smoothing
ParameterValue
alpha0.535078321538088
beta0
gamma0.862261976599988

\begin{tabular}{lllllllll}
\hline
Estimated Parameters of Exponential Smoothing \tabularnewline
Parameter & Value \tabularnewline
alpha & 0.535078321538088 \tabularnewline
beta & 0 \tabularnewline
gamma & 0.862261976599988 \tabularnewline
\hline
\end{tabular}
%Source: https://freestatistics.org/blog/index.php?pk=260964&T=1

[TABLE]
[ROW][C]Estimated Parameters of Exponential Smoothing[/C][/ROW]
[ROW][C]Parameter[/C][C]Value[/C][/ROW]
[ROW][C]alpha[/C][C]0.535078321538088[/C][/ROW]
[ROW][C]beta[/C][C]0[/C][/ROW]
[ROW][C]gamma[/C][C]0.862261976599988[/C][/ROW]
[/TABLE]
Source: https://freestatistics.org/blog/index.php?pk=260964&T=1

Globally Unique Identifier (entire table): ba.freestatistics.org/blog/index.php?pk=260964&T=1

As an alternative you can also use a QR Code:  

The GUIDs for individual cells are displayed in the table below:

Estimated Parameters of Exponential Smoothing
ParameterValue
alpha0.535078321538088
beta0
gamma0.862261976599988


Interpolation Forecasts of Exponential Smoothing
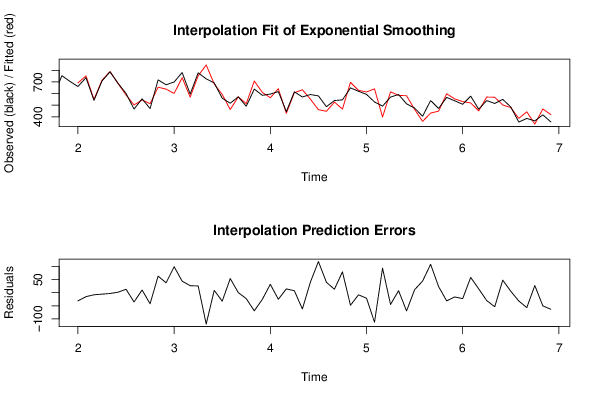
tObservedFittedResiduals
13661692.235576923077-31.2355769230772
14737752.202749531456-15.2027495314558
15542550.082073843387-8.08207384338652
16709714.646517350706-5.64651735070629
17787790.139174338141-3.13917433814072
18689687.3067895495921.69321045040795
19601588.0184424360612.9815575639402
20467502.478578482309-35.4785784823088
21555544.88374627142410.1162537285763
22471513.269053684083-42.2690536840831
23718654.9991187331263.00088126688
24676638.39017721747537.6098227825248
25700601.00651214432998.9934878556707
26781737.08374270238443.9162572976159
27596569.45093294443726.5490670555627
28779753.5221255211225.47787447888
29727846.673924259556-119.673924259556
30692683.4235482050998.57645179490135
31560592.343595283267-32.3435952832672
32517463.12431760960453.8756823903962
33572571.619265059140.380734940859838
34491513.794860890162-22.7948608901618
35639708.146206983259-69.1462069832589
36585610.649346953652-25.6493469536515
37596564.02481822639431.9751817736064
38617642.162409837741-25.1624098377408
39445430.60486916472414.3951308352758
40615607.7433296779087.25667032209162
41571632.9562819629-61.9562819629001
42592552.00292543300239.9970745669975
43580461.331262772858118.668737227142
44487447.47936403132339.5206359686771
45540526.84795355324813.1520464467525
46546466.56646913443979.4335308655614
47649697.036485244256-48.0364852442559
48620628.272187342515-8.27218734251483
49593614.046568035424-21.0465680354245
50528640.907808169365-112.907808169365
51492398.25760346063193.7423965393692
52570614.991369083466-44.9913690834658
53592584.5011432200777.49885677992256
54512581.583224231047-69.5832242310471
55475463.81575248587811.1842475141216
56405360.72200338080544.2779966191946
57540432.065400286141107.934599713859
58472449.07121089937922.9287891006213
59567598.206038304128-31.2060383041284
60538554.388229852001-16.3882298520008
61508530.698843665454-22.6988436654544
62578519.85025931831558.1497406816845
63466451.57206038482614.4279396151736
64540570.250193025575-30.2501930255752
65515568.690157592294-53.6901575922935
66550502.13032853050247.8696714694984
67485479.5877652735025.41223472649767
68355386.672301216475-31.6723012164753
69386442.895272080391-56.8952720803911
70365337.62669790913427.3733020908664
71417467.437886263471-50.4378862634712
72356419.269759438223-63.2697594382229

\begin{tabular}{lllllllll}
\hline
Interpolation Forecasts of Exponential Smoothing \tabularnewline
t & Observed & Fitted & Residuals \tabularnewline
13 & 661 & 692.235576923077 & -31.2355769230772 \tabularnewline
14 & 737 & 752.202749531456 & -15.2027495314558 \tabularnewline
15 & 542 & 550.082073843387 & -8.08207384338652 \tabularnewline
16 & 709 & 714.646517350706 & -5.64651735070629 \tabularnewline
17 & 787 & 790.139174338141 & -3.13917433814072 \tabularnewline
18 & 689 & 687.306789549592 & 1.69321045040795 \tabularnewline
19 & 601 & 588.01844243606 & 12.9815575639402 \tabularnewline
20 & 467 & 502.478578482309 & -35.4785784823088 \tabularnewline
21 & 555 & 544.883746271424 & 10.1162537285763 \tabularnewline
22 & 471 & 513.269053684083 & -42.2690536840831 \tabularnewline
23 & 718 & 654.99911873312 & 63.00088126688 \tabularnewline
24 & 676 & 638.390177217475 & 37.6098227825248 \tabularnewline
25 & 700 & 601.006512144329 & 98.9934878556707 \tabularnewline
26 & 781 & 737.083742702384 & 43.9162572976159 \tabularnewline
27 & 596 & 569.450932944437 & 26.5490670555627 \tabularnewline
28 & 779 & 753.52212552112 & 25.47787447888 \tabularnewline
29 & 727 & 846.673924259556 & -119.673924259556 \tabularnewline
30 & 692 & 683.423548205099 & 8.57645179490135 \tabularnewline
31 & 560 & 592.343595283267 & -32.3435952832672 \tabularnewline
32 & 517 & 463.124317609604 & 53.8756823903962 \tabularnewline
33 & 572 & 571.61926505914 & 0.380734940859838 \tabularnewline
34 & 491 & 513.794860890162 & -22.7948608901618 \tabularnewline
35 & 639 & 708.146206983259 & -69.1462069832589 \tabularnewline
36 & 585 & 610.649346953652 & -25.6493469536515 \tabularnewline
37 & 596 & 564.024818226394 & 31.9751817736064 \tabularnewline
38 & 617 & 642.162409837741 & -25.1624098377408 \tabularnewline
39 & 445 & 430.604869164724 & 14.3951308352758 \tabularnewline
40 & 615 & 607.743329677908 & 7.25667032209162 \tabularnewline
41 & 571 & 632.9562819629 & -61.9562819629001 \tabularnewline
42 & 592 & 552.002925433002 & 39.9970745669975 \tabularnewline
43 & 580 & 461.331262772858 & 118.668737227142 \tabularnewline
44 & 487 & 447.479364031323 & 39.5206359686771 \tabularnewline
45 & 540 & 526.847953553248 & 13.1520464467525 \tabularnewline
46 & 546 & 466.566469134439 & 79.4335308655614 \tabularnewline
47 & 649 & 697.036485244256 & -48.0364852442559 \tabularnewline
48 & 620 & 628.272187342515 & -8.27218734251483 \tabularnewline
49 & 593 & 614.046568035424 & -21.0465680354245 \tabularnewline
50 & 528 & 640.907808169365 & -112.907808169365 \tabularnewline
51 & 492 & 398.257603460631 & 93.7423965393692 \tabularnewline
52 & 570 & 614.991369083466 & -44.9913690834658 \tabularnewline
53 & 592 & 584.501143220077 & 7.49885677992256 \tabularnewline
54 & 512 & 581.583224231047 & -69.5832242310471 \tabularnewline
55 & 475 & 463.815752485878 & 11.1842475141216 \tabularnewline
56 & 405 & 360.722003380805 & 44.2779966191946 \tabularnewline
57 & 540 & 432.065400286141 & 107.934599713859 \tabularnewline
58 & 472 & 449.071210899379 & 22.9287891006213 \tabularnewline
59 & 567 & 598.206038304128 & -31.2060383041284 \tabularnewline
60 & 538 & 554.388229852001 & -16.3882298520008 \tabularnewline
61 & 508 & 530.698843665454 & -22.6988436654544 \tabularnewline
62 & 578 & 519.850259318315 & 58.1497406816845 \tabularnewline
63 & 466 & 451.572060384826 & 14.4279396151736 \tabularnewline
64 & 540 & 570.250193025575 & -30.2501930255752 \tabularnewline
65 & 515 & 568.690157592294 & -53.6901575922935 \tabularnewline
66 & 550 & 502.130328530502 & 47.8696714694984 \tabularnewline
67 & 485 & 479.587765273502 & 5.41223472649767 \tabularnewline
68 & 355 & 386.672301216475 & -31.6723012164753 \tabularnewline
69 & 386 & 442.895272080391 & -56.8952720803911 \tabularnewline
70 & 365 & 337.626697909134 & 27.3733020908664 \tabularnewline
71 & 417 & 467.437886263471 & -50.4378862634712 \tabularnewline
72 & 356 & 419.269759438223 & -63.2697594382229 \tabularnewline
\hline
\end{tabular}
%Source: https://freestatistics.org/blog/index.php?pk=260964&T=2

[TABLE]
[ROW][C]Interpolation Forecasts of Exponential Smoothing[/C][/ROW]
[ROW][C]t[/C][C]Observed[/C][C]Fitted[/C][C]Residuals[/C][/ROW]
[ROW][C]13[/C][C]661[/C][C]692.235576923077[/C][C]-31.2355769230772[/C][/ROW]
[ROW][C]14[/C][C]737[/C][C]752.202749531456[/C][C]-15.2027495314558[/C][/ROW]
[ROW][C]15[/C][C]542[/C][C]550.082073843387[/C][C]-8.08207384338652[/C][/ROW]
[ROW][C]16[/C][C]709[/C][C]714.646517350706[/C][C]-5.64651735070629[/C][/ROW]
[ROW][C]17[/C][C]787[/C][C]790.139174338141[/C][C]-3.13917433814072[/C][/ROW]
[ROW][C]18[/C][C]689[/C][C]687.306789549592[/C][C]1.69321045040795[/C][/ROW]
[ROW][C]19[/C][C]601[/C][C]588.01844243606[/C][C]12.9815575639402[/C][/ROW]
[ROW][C]20[/C][C]467[/C][C]502.478578482309[/C][C]-35.4785784823088[/C][/ROW]
[ROW][C]21[/C][C]555[/C][C]544.883746271424[/C][C]10.1162537285763[/C][/ROW]
[ROW][C]22[/C][C]471[/C][C]513.269053684083[/C][C]-42.2690536840831[/C][/ROW]
[ROW][C]23[/C][C]718[/C][C]654.99911873312[/C][C]63.00088126688[/C][/ROW]
[ROW][C]24[/C][C]676[/C][C]638.390177217475[/C][C]37.6098227825248[/C][/ROW]
[ROW][C]25[/C][C]700[/C][C]601.006512144329[/C][C]98.9934878556707[/C][/ROW]
[ROW][C]26[/C][C]781[/C][C]737.083742702384[/C][C]43.9162572976159[/C][/ROW]
[ROW][C]27[/C][C]596[/C][C]569.450932944437[/C][C]26.5490670555627[/C][/ROW]
[ROW][C]28[/C][C]779[/C][C]753.52212552112[/C][C]25.47787447888[/C][/ROW]
[ROW][C]29[/C][C]727[/C][C]846.673924259556[/C][C]-119.673924259556[/C][/ROW]
[ROW][C]30[/C][C]692[/C][C]683.423548205099[/C][C]8.57645179490135[/C][/ROW]
[ROW][C]31[/C][C]560[/C][C]592.343595283267[/C][C]-32.3435952832672[/C][/ROW]
[ROW][C]32[/C][C]517[/C][C]463.124317609604[/C][C]53.8756823903962[/C][/ROW]
[ROW][C]33[/C][C]572[/C][C]571.61926505914[/C][C]0.380734940859838[/C][/ROW]
[ROW][C]34[/C][C]491[/C][C]513.794860890162[/C][C]-22.7948608901618[/C][/ROW]
[ROW][C]35[/C][C]639[/C][C]708.146206983259[/C][C]-69.1462069832589[/C][/ROW]
[ROW][C]36[/C][C]585[/C][C]610.649346953652[/C][C]-25.6493469536515[/C][/ROW]
[ROW][C]37[/C][C]596[/C][C]564.024818226394[/C][C]31.9751817736064[/C][/ROW]
[ROW][C]38[/C][C]617[/C][C]642.162409837741[/C][C]-25.1624098377408[/C][/ROW]
[ROW][C]39[/C][C]445[/C][C]430.604869164724[/C][C]14.3951308352758[/C][/ROW]
[ROW][C]40[/C][C]615[/C][C]607.743329677908[/C][C]7.25667032209162[/C][/ROW]
[ROW][C]41[/C][C]571[/C][C]632.9562819629[/C][C]-61.9562819629001[/C][/ROW]
[ROW][C]42[/C][C]592[/C][C]552.002925433002[/C][C]39.9970745669975[/C][/ROW]
[ROW][C]43[/C][C]580[/C][C]461.331262772858[/C][C]118.668737227142[/C][/ROW]
[ROW][C]44[/C][C]487[/C][C]447.479364031323[/C][C]39.5206359686771[/C][/ROW]
[ROW][C]45[/C][C]540[/C][C]526.847953553248[/C][C]13.1520464467525[/C][/ROW]
[ROW][C]46[/C][C]546[/C][C]466.566469134439[/C][C]79.4335308655614[/C][/ROW]
[ROW][C]47[/C][C]649[/C][C]697.036485244256[/C][C]-48.0364852442559[/C][/ROW]
[ROW][C]48[/C][C]620[/C][C]628.272187342515[/C][C]-8.27218734251483[/C][/ROW]
[ROW][C]49[/C][C]593[/C][C]614.046568035424[/C][C]-21.0465680354245[/C][/ROW]
[ROW][C]50[/C][C]528[/C][C]640.907808169365[/C][C]-112.907808169365[/C][/ROW]
[ROW][C]51[/C][C]492[/C][C]398.257603460631[/C][C]93.7423965393692[/C][/ROW]
[ROW][C]52[/C][C]570[/C][C]614.991369083466[/C][C]-44.9913690834658[/C][/ROW]
[ROW][C]53[/C][C]592[/C][C]584.501143220077[/C][C]7.49885677992256[/C][/ROW]
[ROW][C]54[/C][C]512[/C][C]581.583224231047[/C][C]-69.5832242310471[/C][/ROW]
[ROW][C]55[/C][C]475[/C][C]463.815752485878[/C][C]11.1842475141216[/C][/ROW]
[ROW][C]56[/C][C]405[/C][C]360.722003380805[/C][C]44.2779966191946[/C][/ROW]
[ROW][C]57[/C][C]540[/C][C]432.065400286141[/C][C]107.934599713859[/C][/ROW]
[ROW][C]58[/C][C]472[/C][C]449.071210899379[/C][C]22.9287891006213[/C][/ROW]
[ROW][C]59[/C][C]567[/C][C]598.206038304128[/C][C]-31.2060383041284[/C][/ROW]
[ROW][C]60[/C][C]538[/C][C]554.388229852001[/C][C]-16.3882298520008[/C][/ROW]
[ROW][C]61[/C][C]508[/C][C]530.698843665454[/C][C]-22.6988436654544[/C][/ROW]
[ROW][C]62[/C][C]578[/C][C]519.850259318315[/C][C]58.1497406816845[/C][/ROW]
[ROW][C]63[/C][C]466[/C][C]451.572060384826[/C][C]14.4279396151736[/C][/ROW]
[ROW][C]64[/C][C]540[/C][C]570.250193025575[/C][C]-30.2501930255752[/C][/ROW]
[ROW][C]65[/C][C]515[/C][C]568.690157592294[/C][C]-53.6901575922935[/C][/ROW]
[ROW][C]66[/C][C]550[/C][C]502.130328530502[/C][C]47.8696714694984[/C][/ROW]
[ROW][C]67[/C][C]485[/C][C]479.587765273502[/C][C]5.41223472649767[/C][/ROW]
[ROW][C]68[/C][C]355[/C][C]386.672301216475[/C][C]-31.6723012164753[/C][/ROW]
[ROW][C]69[/C][C]386[/C][C]442.895272080391[/C][C]-56.8952720803911[/C][/ROW]
[ROW][C]70[/C][C]365[/C][C]337.626697909134[/C][C]27.3733020908664[/C][/ROW]
[ROW][C]71[/C][C]417[/C][C]467.437886263471[/C][C]-50.4378862634712[/C][/ROW]
[ROW][C]72[/C][C]356[/C][C]419.269759438223[/C][C]-63.2697594382229[/C][/ROW]
[/TABLE]
Source: https://freestatistics.org/blog/index.php?pk=260964&T=2

Globally Unique Identifier (entire table): ba.freestatistics.org/blog/index.php?pk=260964&T=2

As an alternative you can also use a QR Code:  

The GUIDs for individual cells are displayed in the table below:

Interpolation Forecasts of Exponential Smoothing
tObservedFittedResiduals
13661692.235576923077-31.2355769230772
14737752.202749531456-15.2027495314558
15542550.082073843387-8.08207384338652
16709714.646517350706-5.64651735070629
17787790.139174338141-3.13917433814072
18689687.3067895495921.69321045040795
19601588.0184424360612.9815575639402
20467502.478578482309-35.4785784823088
21555544.88374627142410.1162537285763
22471513.269053684083-42.2690536840831
23718654.9991187331263.00088126688
24676638.39017721747537.6098227825248
25700601.00651214432998.9934878556707
26781737.08374270238443.9162572976159
27596569.45093294443726.5490670555627
28779753.5221255211225.47787447888
29727846.673924259556-119.673924259556
30692683.4235482050998.57645179490135
31560592.343595283267-32.3435952832672
32517463.12431760960453.8756823903962
33572571.619265059140.380734940859838
34491513.794860890162-22.7948608901618
35639708.146206983259-69.1462069832589
36585610.649346953652-25.6493469536515
37596564.02481822639431.9751817736064
38617642.162409837741-25.1624098377408
39445430.60486916472414.3951308352758
40615607.7433296779087.25667032209162
41571632.9562819629-61.9562819629001
42592552.00292543300239.9970745669975
43580461.331262772858118.668737227142
44487447.47936403132339.5206359686771
45540526.84795355324813.1520464467525
46546466.56646913443979.4335308655614
47649697.036485244256-48.0364852442559
48620628.272187342515-8.27218734251483
49593614.046568035424-21.0465680354245
50528640.907808169365-112.907808169365
51492398.25760346063193.7423965393692
52570614.991369083466-44.9913690834658
53592584.5011432200777.49885677992256
54512581.583224231047-69.5832242310471
55475463.81575248587811.1842475141216
56405360.72200338080544.2779966191946
57540432.065400286141107.934599713859
58472449.07121089937922.9287891006213
59567598.206038304128-31.2060383041284
60538554.388229852001-16.3882298520008
61508530.698843665454-22.6988436654544
62578519.85025931831558.1497406816845
63466451.57206038482614.4279396151736
64540570.250193025575-30.2501930255752
65515568.690157592294-53.6901575922935
66550502.13032853050247.8696714694984
67485479.5877652735025.41223472649767
68355386.672301216475-31.6723012164753
69386442.895272080391-56.8952720803911
70365337.62669790913427.3733020908664
71417467.437886263471-50.4378862634712
72356419.269759438223-63.2697594382229


Extrapolation Forecasts of Exponential Smoothing
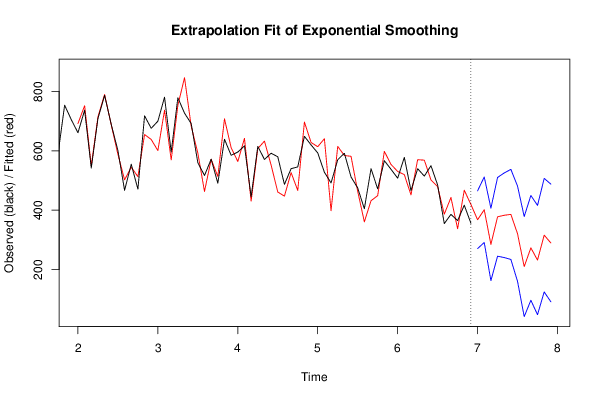
tForecast95% Lower Bound95% Upper Bound
73367.965257180282270.659989098766465.270525261797
74401.673258966924291.313949188769512.032568745078
75284.753011413135162.728262640577406.777760185693
76377.800305063098245.131916321465510.468693804731
77383.0297786942240.510434640151525.549122748248
78385.91212854232234.180043972538537.644213112101
79320.735022632733160.31841642818481.151628837285
80210.05698141030341.402454034126378.71150878648
81273.11562139705796.6072316169196449.624011177194
82232.07242105527848.0450488492063416.099793261349
83316.043466229622124.792490338342507.294442120902
84289.71946261971191.5079648763607487.930960363061

\begin{tabular}{lllllllll}
\hline
Extrapolation Forecasts of Exponential Smoothing \tabularnewline
t & Forecast & 95% Lower Bound & 95% Upper Bound \tabularnewline
73 & 367.965257180282 & 270.659989098766 & 465.270525261797 \tabularnewline
74 & 401.673258966924 & 291.313949188769 & 512.032568745078 \tabularnewline
75 & 284.753011413135 & 162.728262640577 & 406.777760185693 \tabularnewline
76 & 377.800305063098 & 245.131916321465 & 510.468693804731 \tabularnewline
77 & 383.0297786942 & 240.510434640151 & 525.549122748248 \tabularnewline
78 & 385.91212854232 & 234.180043972538 & 537.644213112101 \tabularnewline
79 & 320.735022632733 & 160.31841642818 & 481.151628837285 \tabularnewline
80 & 210.056981410303 & 41.402454034126 & 378.71150878648 \tabularnewline
81 & 273.115621397057 & 96.6072316169196 & 449.624011177194 \tabularnewline
82 & 232.072421055278 & 48.0450488492063 & 416.099793261349 \tabularnewline
83 & 316.043466229622 & 124.792490338342 & 507.294442120902 \tabularnewline
84 & 289.719462619711 & 91.5079648763607 & 487.930960363061 \tabularnewline
\hline
\end{tabular}
%Source: https://freestatistics.org/blog/index.php?pk=260964&T=3

[TABLE]
[ROW][C]Extrapolation Forecasts of Exponential Smoothing[/C][/ROW]
[ROW][C]t[/C][C]Forecast[/C][C]95% Lower Bound[/C][C]95% Upper Bound[/C][/ROW]
[ROW][C]73[/C][C]367.965257180282[/C][C]270.659989098766[/C][C]465.270525261797[/C][/ROW]
[ROW][C]74[/C][C]401.673258966924[/C][C]291.313949188769[/C][C]512.032568745078[/C][/ROW]
[ROW][C]75[/C][C]284.753011413135[/C][C]162.728262640577[/C][C]406.777760185693[/C][/ROW]
[ROW][C]76[/C][C]377.800305063098[/C][C]245.131916321465[/C][C]510.468693804731[/C][/ROW]
[ROW][C]77[/C][C]383.0297786942[/C][C]240.510434640151[/C][C]525.549122748248[/C][/ROW]
[ROW][C]78[/C][C]385.91212854232[/C][C]234.180043972538[/C][C]537.644213112101[/C][/ROW]
[ROW][C]79[/C][C]320.735022632733[/C][C]160.31841642818[/C][C]481.151628837285[/C][/ROW]
[ROW][C]80[/C][C]210.056981410303[/C][C]41.402454034126[/C][C]378.71150878648[/C][/ROW]
[ROW][C]81[/C][C]273.115621397057[/C][C]96.6072316169196[/C][C]449.624011177194[/C][/ROW]
[ROW][C]82[/C][C]232.072421055278[/C][C]48.0450488492063[/C][C]416.099793261349[/C][/ROW]
[ROW][C]83[/C][C]316.043466229622[/C][C]124.792490338342[/C][C]507.294442120902[/C][/ROW]
[ROW][C]84[/C][C]289.719462619711[/C][C]91.5079648763607[/C][C]487.930960363061[/C][/ROW]
[/TABLE]
Source: https://freestatistics.org/blog/index.php?pk=260964&T=3

Globally Unique Identifier (entire table): ba.freestatistics.org/blog/index.php?pk=260964&T=3

As an alternative you can also use a QR Code:  

The GUIDs for individual cells are displayed in the table below:

Extrapolation Forecasts of Exponential Smoothing
tForecast95% Lower Bound95% Upper Bound
73367.965257180282270.659989098766465.270525261797
74401.673258966924291.313949188769512.032568745078
75284.753011413135162.728262640577406.777760185693
76377.800305063098245.131916321465510.468693804731
77383.0297786942240.510434640151525.549122748248
78385.91212854232234.180043972538537.644213112101
79320.735022632733160.31841642818481.151628837285
80210.05698141030341.402454034126378.71150878648
81273.11562139705796.6072316169196449.624011177194
82232.07242105527848.0450488492063416.099793261349
83316.043466229622124.792490338342507.294442120902
84289.71946261971191.5079648763607487.930960363061


Parameters (Session):
par1 = 12 ; par2 = Triple ; par3 = additive ;
Parameters (R input):
par1 = 12 ; par2 = Triple ; par3 = additive ;
R code (references can be found in the software module):
par1 <- as.numeric(par1)
if (par2 == 'Single') K <- 1
if (par2 == 'Double') K <- 2
if (par2 == 'Triple') K <- par1
nx <- length(x)
nxmK <- nx - K
x <- ts(x, frequency = par1)
if (par2 == 'Single') fit <- HoltWinters(x, gamma=F, beta=F)
if (par2 == 'Double') fit <- HoltWinters(x, gamma=F)
if (par2 == 'Triple') fit <- HoltWinters(x, seasonal=par3)
fit
myresid <- x - fit$fitted[,'xhat']
bitmap(file='test1.png')
op <- par(mfrow=c(2,1))
plot(fit,ylab='Observed (black) / Fitted (red)',main='Interpolation Fit of Exponential Smoothing')
plot(myresid,ylab='Residuals',main='Interpolation Prediction Errors')
par(op)
dev.off()
bitmap(file='test2.png')
p <- predict(fit, par1, prediction.interval=TRUE)
np <- length(p[,1])
plot(fit,p,ylab='Observed (black) / Fitted (red)',main='Extrapolation Fit of Exponential Smoothing')
dev.off()
bitmap(file='test3.png')
op <- par(mfrow = c(2,2))
acf(as.numeric(myresid),lag.max = nx/2,main='Residual ACF')
spectrum(myresid,main='Residals Periodogram')
cpgram(myresid,main='Residal Cumulative Periodogram')
qqnorm(myresid,main='Residual Normal QQ Plot')
qqline(myresid)
par(op)
dev.off()
load(file='createtable')
a<-table.start()
a<-table.row.start(a)
a<-table.element(a,'Estimated Parameters of Exponential Smoothing',2,TRUE)
a<-table.row.end(a)
a<-table.row.start(a)
a<-table.element(a,'Parameter',header=TRUE)
a<-table.element(a,'Value',header=TRUE)
a<-table.row.end(a)
a<-table.row.start(a)
a<-table.element(a,'alpha',header=TRUE)
a<-table.element(a,fit$alpha)
a<-table.row.end(a)
a<-table.row.start(a)
a<-table.element(a,'beta',header=TRUE)
a<-table.element(a,fit$beta)
a<-table.row.end(a)
a<-table.row.start(a)
a<-table.element(a,'gamma',header=TRUE)
a<-table.element(a,fit$gamma)
a<-table.row.end(a)
a<-table.end(a)
table.save(a,file='mytable.tab')
a<-table.start()
a<-table.row.start(a)
a<-table.element(a,'Interpolation Forecasts of Exponential Smoothing',4,TRUE)
a<-table.row.end(a)
a<-table.row.start(a)
a<-table.element(a,'t',header=TRUE)
a<-table.element(a,'Observed',header=TRUE)
a<-table.element(a,'Fitted',header=TRUE)
a<-table.element(a,'Residuals',header=TRUE)
a<-table.row.end(a)
for (i in 1:nxmK) {
a<-table.row.start(a)
a<-table.element(a,i+K,header=TRUE)
a<-table.element(a,x[i+K])
a<-table.element(a,fit$fitted[i,'xhat'])
a<-table.element(a,myresid[i])
a<-table.row.end(a)
}
a<-table.end(a)
table.save(a,file='mytable1.tab')
a<-table.start()
a<-table.row.start(a)
a<-table.element(a,'Extrapolation Forecasts of Exponential Smoothing',4,TRUE)
a<-table.row.end(a)
a<-table.row.start(a)
a<-table.element(a,'t',header=TRUE)
a<-table.element(a,'Forecast',header=TRUE)
a<-table.element(a,'95% Lower Bound',header=TRUE)
a<-table.element(a,'95% Upper Bound',header=TRUE)
a<-table.row.end(a)
for (i in 1:np) {
a<-table.row.start(a)
a<-table.element(a,nx+i,header=TRUE)
a<-table.element(a,p[i,'fit'])
a<-table.element(a,p[i,'lwr'])
a<-table.element(a,p[i,'upr'])
a<-table.row.end(a)
}
a<-table.end(a)
table.save(a,file='mytable2.tab')