Free Statistics

of Irreproducible Research!

Author's title

Author*Unverified author*
R Software Modulerwasp_exponentialsmoothing.wasp
Title produced by softwareExponential Smoothing
Date of computationThu, 27 Nov 2014 13:45:08 +0000
Cite this page as followsStatistical Computations at FreeStatistics.org, Office for Research Development and Education, URL https://freestatistics.org/blog/index.php?v=date/2014/Nov/27/t14170959664vep1fge9plrldd.htm/, Retrieved Sun, 19 May 2024 17:43:42 +0000
Statistical Computations at FreeStatistics.org, Office for Research Development and Education, URL https://freestatistics.org/blog/index.php?pk=260214, Retrieved Sun, 19 May 2024 17:43:42 +0000
QR Codes:

Original text written by user:
IsPrivate?No (this computation is public)
User-defined keywords
Estimated Impact78
Family? (F = Feedback message, R = changed R code, M = changed R Module, P = changed Parameters, D = changed Data)
-       [Exponential Smoothing] [] [2014-11-27 13:45:08] [e5757b82694375e1f239be852782e5f7] [Current]
- R P     [Exponential Smoothing] [] [2015-01-03 12:56:26] [e0fdc24fab02fa85c96022445b7a1857]
- RMPD    [(Partial) Autocorrelation Function] [] [2015-01-03 13:36:45] [e0fdc24fab02fa85c96022445b7a1857]
- RMPD    [Mean Plot] [] [2015-01-03 13:38:08] [e0fdc24fab02fa85c96022445b7a1857]
- RMPD    [(Partial) Autocorrelation Function] [] [2015-01-03 13:41:32] [e0fdc24fab02fa85c96022445b7a1857]
Feedback Forum

Post a new message
Dataseries X:
220.05
220.05
220.62
221.53
221.61
221.5
221.5
221.87
222.27
220.86
221.49
221.67
221.67
221.72
221.67
220.29
220.75
219.59
219.59
219.59
219.82
221.59
220.9
221.01
221.01
219.69
221
219.82
218.04
217.97
217.97
217.53
217
217.18
217.68
217.71
217.71
218.5
218.8
218.94
220
219.89
219.89
220.08
220.16
221
222.16
221.5
221.5
221.6
221.85
223.11
222.79
222.45
222.45
222.4
223.15
224.4
224.24
223.92
212.42
212.34
212.95
213.37
214.26
214.1
213.54
213.69
211.82
212.82
212.36
212.7


Summary of computational transaction
Raw Inputview raw input (R code)
Raw Outputview raw output of R engine
Computing time2 seconds
R Server'Sir Maurice George Kendall' @ kendall.wessa.net

\begin{tabular}{lllllllll}
\hline
Summary of computational transaction \tabularnewline
Raw Input & view raw input (R code)  \tabularnewline
Raw Output & view raw output of R engine  \tabularnewline
Computing time & 2 seconds \tabularnewline
R Server & 'Sir Maurice George Kendall' @ kendall.wessa.net \tabularnewline
\hline
\end{tabular}
%Source: https://freestatistics.org/blog/index.php?pk=260214&T=0

[TABLE]
[ROW][C]Summary of computational transaction[/C][/ROW]
[ROW][C]Raw Input[/C][C]view raw input (R code) [/C][/ROW]
[ROW][C]Raw Output[/C][C]view raw output of R engine [/C][/ROW]
[ROW][C]Computing time[/C][C]2 seconds[/C][/ROW]
[ROW][C]R Server[/C][C]'Sir Maurice George Kendall' @ kendall.wessa.net[/C][/ROW]
[/TABLE]
Source: https://freestatistics.org/blog/index.php?pk=260214&T=0

Globally Unique Identifier (entire table): ba.freestatistics.org/blog/index.php?pk=260214&T=0

As an alternative you can also use a QR Code:  

The GUIDs for individual cells are displayed in the table below:

Summary of computational transaction
Raw Inputview raw input (R code)
Raw Outputview raw output of R engine
Computing time2 seconds
R Server'Sir Maurice George Kendall' @ kendall.wessa.net


Estimated Parameters of Exponential Smoothing
ParameterValue
alpha0.765062753370693
beta0
gamma1

\begin{tabular}{lllllllll}
\hline
Estimated Parameters of Exponential Smoothing \tabularnewline
Parameter & Value \tabularnewline
alpha & 0.765062753370693 \tabularnewline
beta & 0 \tabularnewline
gamma & 1 \tabularnewline
\hline
\end{tabular}
%Source: https://freestatistics.org/blog/index.php?pk=260214&T=1

[TABLE]
[ROW][C]Estimated Parameters of Exponential Smoothing[/C][/ROW]
[ROW][C]Parameter[/C][C]Value[/C][/ROW]
[ROW][C]alpha[/C][C]0.765062753370693[/C][/ROW]
[ROW][C]beta[/C][C]0[/C][/ROW]
[ROW][C]gamma[/C][C]1[/C][/ROW]
[/TABLE]
Source: https://freestatistics.org/blog/index.php?pk=260214&T=1

Globally Unique Identifier (entire table): ba.freestatistics.org/blog/index.php?pk=260214&T=1

As an alternative you can also use a QR Code:  

The GUIDs for individual cells are displayed in the table below:

Estimated Parameters of Exponential Smoothing
ParameterValue
alpha0.765062753370693
beta0
gamma1


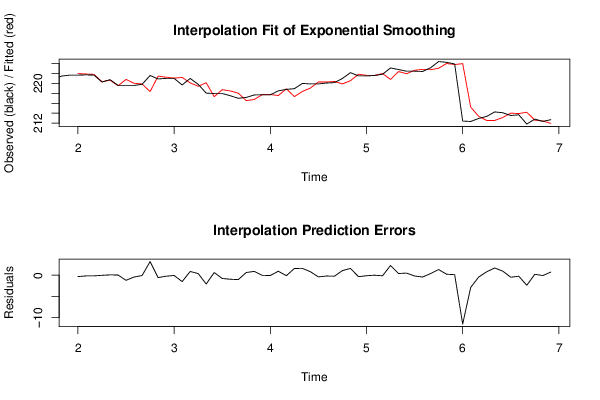
Interpolation Forecasts of Exponential Smoothing
tObservedFittedResiduals
13221.67221.986006944445-0.316006944444524
14221.72221.885548619625-0.165548619625326
15221.67221.82270035506-0.152700355059864
16220.29220.314265152492-0.0242651524922053
17220.75220.6665909396310.0834090603693198
18219.59219.5392109231950.0507890768053301
19219.59220.795624572318-1.20562457231827
20219.59220.022886269004-0.432886269004229
21219.82219.895091259659-0.075091259658592
22221.59218.3522818853053.23771811469476
23220.9221.46356290562-0.563562905620216
24221.01221.244542068864-0.234542068863959
25221.01221.066751017949-0.0567510179492388
26219.69221.199988010648-1.5099880106477
27221220.1115777797480.888422220252352
28219.82219.4298408941060.390159105893702
29218.04220.124523928532-2.08452392853178
30217.97217.330875481360.639124518639676
31217.97218.742224300167-0.772224300166698
32217.53218.482609411722-0.952609411722136
33217218.041252958172-1.04125295817164
34217.18216.5375715675710.642428432429057
35217.68216.77023062120.909769378799865
36217.71217.755700688063-0.0457006880634196
37217.71217.764154883871-0.0541548838714903
38218.5217.5579585842910.942041415708843
39218.8218.908980633601-0.108980633600595
40218.94217.3471074101861.59289258981363
41220218.3805618170031.61943818299741
42219.89219.0605632882230.829436711776964
43219.89220.285934471987-0.395934471987147
44220.08220.271825734113-0.191825734113252
45220.16220.391690864939-0.231690864939395
46221219.902934748521.09706525147979
47222.16220.5462278445681.61377215543232
48221.5221.845828707356-0.345828707356446
49221.5221.622679928875-0.122679928874902
50221.6221.5981012854150.00189871458488255
51221.85221.98293094483-0.132930944829837
52223.11220.8025676395842.30743236041647
53222.79222.3889263592630.401073640737224
54222.45221.9512017286910.498798271309226
55222.45222.635728424808-0.185728424808019
56222.4222.830393249053-0.430393249053225
57223.15222.7583734559620.391626544038218
58224.4223.0586685761121.34133142388774
59224.24224.0102343199060.229765680093607
60223.92223.7906001467940.129399853206337
61212.42223.983456998942-11.5634569989418
62212.34215.23523411304-2.89523411303958
63212.95213.371898845524-0.421898845524481
64213.37212.5437891982470.826210801753234
65214.26212.5490458052141.71095419478613
66214.1213.1364211535440.963578846456329
67213.54214.015713338966-0.475713338966131
68213.69213.931040626194-0.241040626194348
69211.82214.197010538969-2.37701053896899
70212.82212.6022455988920.217754401107925
71212.36212.43305621672-0.0730562167197775
72212.7211.9581646184250.741835381574504

\begin{tabular}{lllllllll}
\hline
Interpolation Forecasts of Exponential Smoothing \tabularnewline
t & Observed & Fitted & Residuals \tabularnewline
13 & 221.67 & 221.986006944445 & -0.316006944444524 \tabularnewline
14 & 221.72 & 221.885548619625 & -0.165548619625326 \tabularnewline
15 & 221.67 & 221.82270035506 & -0.152700355059864 \tabularnewline
16 & 220.29 & 220.314265152492 & -0.0242651524922053 \tabularnewline
17 & 220.75 & 220.666590939631 & 0.0834090603693198 \tabularnewline
18 & 219.59 & 219.539210923195 & 0.0507890768053301 \tabularnewline
19 & 219.59 & 220.795624572318 & -1.20562457231827 \tabularnewline
20 & 219.59 & 220.022886269004 & -0.432886269004229 \tabularnewline
21 & 219.82 & 219.895091259659 & -0.075091259658592 \tabularnewline
22 & 221.59 & 218.352281885305 & 3.23771811469476 \tabularnewline
23 & 220.9 & 221.46356290562 & -0.563562905620216 \tabularnewline
24 & 221.01 & 221.244542068864 & -0.234542068863959 \tabularnewline
25 & 221.01 & 221.066751017949 & -0.0567510179492388 \tabularnewline
26 & 219.69 & 221.199988010648 & -1.5099880106477 \tabularnewline
27 & 221 & 220.111577779748 & 0.888422220252352 \tabularnewline
28 & 219.82 & 219.429840894106 & 0.390159105893702 \tabularnewline
29 & 218.04 & 220.124523928532 & -2.08452392853178 \tabularnewline
30 & 217.97 & 217.33087548136 & 0.639124518639676 \tabularnewline
31 & 217.97 & 218.742224300167 & -0.772224300166698 \tabularnewline
32 & 217.53 & 218.482609411722 & -0.952609411722136 \tabularnewline
33 & 217 & 218.041252958172 & -1.04125295817164 \tabularnewline
34 & 217.18 & 216.537571567571 & 0.642428432429057 \tabularnewline
35 & 217.68 & 216.7702306212 & 0.909769378799865 \tabularnewline
36 & 217.71 & 217.755700688063 & -0.0457006880634196 \tabularnewline
37 & 217.71 & 217.764154883871 & -0.0541548838714903 \tabularnewline
38 & 218.5 & 217.557958584291 & 0.942041415708843 \tabularnewline
39 & 218.8 & 218.908980633601 & -0.108980633600595 \tabularnewline
40 & 218.94 & 217.347107410186 & 1.59289258981363 \tabularnewline
41 & 220 & 218.380561817003 & 1.61943818299741 \tabularnewline
42 & 219.89 & 219.060563288223 & 0.829436711776964 \tabularnewline
43 & 219.89 & 220.285934471987 & -0.395934471987147 \tabularnewline
44 & 220.08 & 220.271825734113 & -0.191825734113252 \tabularnewline
45 & 220.16 & 220.391690864939 & -0.231690864939395 \tabularnewline
46 & 221 & 219.90293474852 & 1.09706525147979 \tabularnewline
47 & 222.16 & 220.546227844568 & 1.61377215543232 \tabularnewline
48 & 221.5 & 221.845828707356 & -0.345828707356446 \tabularnewline
49 & 221.5 & 221.622679928875 & -0.122679928874902 \tabularnewline
50 & 221.6 & 221.598101285415 & 0.00189871458488255 \tabularnewline
51 & 221.85 & 221.98293094483 & -0.132930944829837 \tabularnewline
52 & 223.11 & 220.802567639584 & 2.30743236041647 \tabularnewline
53 & 222.79 & 222.388926359263 & 0.401073640737224 \tabularnewline
54 & 222.45 & 221.951201728691 & 0.498798271309226 \tabularnewline
55 & 222.45 & 222.635728424808 & -0.185728424808019 \tabularnewline
56 & 222.4 & 222.830393249053 & -0.430393249053225 \tabularnewline
57 & 223.15 & 222.758373455962 & 0.391626544038218 \tabularnewline
58 & 224.4 & 223.058668576112 & 1.34133142388774 \tabularnewline
59 & 224.24 & 224.010234319906 & 0.229765680093607 \tabularnewline
60 & 223.92 & 223.790600146794 & 0.129399853206337 \tabularnewline
61 & 212.42 & 223.983456998942 & -11.5634569989418 \tabularnewline
62 & 212.34 & 215.23523411304 & -2.89523411303958 \tabularnewline
63 & 212.95 & 213.371898845524 & -0.421898845524481 \tabularnewline
64 & 213.37 & 212.543789198247 & 0.826210801753234 \tabularnewline
65 & 214.26 & 212.549045805214 & 1.71095419478613 \tabularnewline
66 & 214.1 & 213.136421153544 & 0.963578846456329 \tabularnewline
67 & 213.54 & 214.015713338966 & -0.475713338966131 \tabularnewline
68 & 213.69 & 213.931040626194 & -0.241040626194348 \tabularnewline
69 & 211.82 & 214.197010538969 & -2.37701053896899 \tabularnewline
70 & 212.82 & 212.602245598892 & 0.217754401107925 \tabularnewline
71 & 212.36 & 212.43305621672 & -0.0730562167197775 \tabularnewline
72 & 212.7 & 211.958164618425 & 0.741835381574504 \tabularnewline
\hline
\end{tabular}
%Source: https://freestatistics.org/blog/index.php?pk=260214&T=2

[TABLE]
[ROW][C]Interpolation Forecasts of Exponential Smoothing[/C][/ROW]
[ROW][C]t[/C][C]Observed[/C][C]Fitted[/C][C]Residuals[/C][/ROW]
[ROW][C]13[/C][C]221.67[/C][C]221.986006944445[/C][C]-0.316006944444524[/C][/ROW]
[ROW][C]14[/C][C]221.72[/C][C]221.885548619625[/C][C]-0.165548619625326[/C][/ROW]
[ROW][C]15[/C][C]221.67[/C][C]221.82270035506[/C][C]-0.152700355059864[/C][/ROW]
[ROW][C]16[/C][C]220.29[/C][C]220.314265152492[/C][C]-0.0242651524922053[/C][/ROW]
[ROW][C]17[/C][C]220.75[/C][C]220.666590939631[/C][C]0.0834090603693198[/C][/ROW]
[ROW][C]18[/C][C]219.59[/C][C]219.539210923195[/C][C]0.0507890768053301[/C][/ROW]
[ROW][C]19[/C][C]219.59[/C][C]220.795624572318[/C][C]-1.20562457231827[/C][/ROW]
[ROW][C]20[/C][C]219.59[/C][C]220.022886269004[/C][C]-0.432886269004229[/C][/ROW]
[ROW][C]21[/C][C]219.82[/C][C]219.895091259659[/C][C]-0.075091259658592[/C][/ROW]
[ROW][C]22[/C][C]221.59[/C][C]218.352281885305[/C][C]3.23771811469476[/C][/ROW]
[ROW][C]23[/C][C]220.9[/C][C]221.46356290562[/C][C]-0.563562905620216[/C][/ROW]
[ROW][C]24[/C][C]221.01[/C][C]221.244542068864[/C][C]-0.234542068863959[/C][/ROW]
[ROW][C]25[/C][C]221.01[/C][C]221.066751017949[/C][C]-0.0567510179492388[/C][/ROW]
[ROW][C]26[/C][C]219.69[/C][C]221.199988010648[/C][C]-1.5099880106477[/C][/ROW]
[ROW][C]27[/C][C]221[/C][C]220.111577779748[/C][C]0.888422220252352[/C][/ROW]
[ROW][C]28[/C][C]219.82[/C][C]219.429840894106[/C][C]0.390159105893702[/C][/ROW]
[ROW][C]29[/C][C]218.04[/C][C]220.124523928532[/C][C]-2.08452392853178[/C][/ROW]
[ROW][C]30[/C][C]217.97[/C][C]217.33087548136[/C][C]0.639124518639676[/C][/ROW]
[ROW][C]31[/C][C]217.97[/C][C]218.742224300167[/C][C]-0.772224300166698[/C][/ROW]
[ROW][C]32[/C][C]217.53[/C][C]218.482609411722[/C][C]-0.952609411722136[/C][/ROW]
[ROW][C]33[/C][C]217[/C][C]218.041252958172[/C][C]-1.04125295817164[/C][/ROW]
[ROW][C]34[/C][C]217.18[/C][C]216.537571567571[/C][C]0.642428432429057[/C][/ROW]
[ROW][C]35[/C][C]217.68[/C][C]216.7702306212[/C][C]0.909769378799865[/C][/ROW]
[ROW][C]36[/C][C]217.71[/C][C]217.755700688063[/C][C]-0.0457006880634196[/C][/ROW]
[ROW][C]37[/C][C]217.71[/C][C]217.764154883871[/C][C]-0.0541548838714903[/C][/ROW]
[ROW][C]38[/C][C]218.5[/C][C]217.557958584291[/C][C]0.942041415708843[/C][/ROW]
[ROW][C]39[/C][C]218.8[/C][C]218.908980633601[/C][C]-0.108980633600595[/C][/ROW]
[ROW][C]40[/C][C]218.94[/C][C]217.347107410186[/C][C]1.59289258981363[/C][/ROW]
[ROW][C]41[/C][C]220[/C][C]218.380561817003[/C][C]1.61943818299741[/C][/ROW]
[ROW][C]42[/C][C]219.89[/C][C]219.060563288223[/C][C]0.829436711776964[/C][/ROW]
[ROW][C]43[/C][C]219.89[/C][C]220.285934471987[/C][C]-0.395934471987147[/C][/ROW]
[ROW][C]44[/C][C]220.08[/C][C]220.271825734113[/C][C]-0.191825734113252[/C][/ROW]
[ROW][C]45[/C][C]220.16[/C][C]220.391690864939[/C][C]-0.231690864939395[/C][/ROW]
[ROW][C]46[/C][C]221[/C][C]219.90293474852[/C][C]1.09706525147979[/C][/ROW]
[ROW][C]47[/C][C]222.16[/C][C]220.546227844568[/C][C]1.61377215543232[/C][/ROW]
[ROW][C]48[/C][C]221.5[/C][C]221.845828707356[/C][C]-0.345828707356446[/C][/ROW]
[ROW][C]49[/C][C]221.5[/C][C]221.622679928875[/C][C]-0.122679928874902[/C][/ROW]
[ROW][C]50[/C][C]221.6[/C][C]221.598101285415[/C][C]0.00189871458488255[/C][/ROW]
[ROW][C]51[/C][C]221.85[/C][C]221.98293094483[/C][C]-0.132930944829837[/C][/ROW]
[ROW][C]52[/C][C]223.11[/C][C]220.802567639584[/C][C]2.30743236041647[/C][/ROW]
[ROW][C]53[/C][C]222.79[/C][C]222.388926359263[/C][C]0.401073640737224[/C][/ROW]
[ROW][C]54[/C][C]222.45[/C][C]221.951201728691[/C][C]0.498798271309226[/C][/ROW]
[ROW][C]55[/C][C]222.45[/C][C]222.635728424808[/C][C]-0.185728424808019[/C][/ROW]
[ROW][C]56[/C][C]222.4[/C][C]222.830393249053[/C][C]-0.430393249053225[/C][/ROW]
[ROW][C]57[/C][C]223.15[/C][C]222.758373455962[/C][C]0.391626544038218[/C][/ROW]
[ROW][C]58[/C][C]224.4[/C][C]223.058668576112[/C][C]1.34133142388774[/C][/ROW]
[ROW][C]59[/C][C]224.24[/C][C]224.010234319906[/C][C]0.229765680093607[/C][/ROW]
[ROW][C]60[/C][C]223.92[/C][C]223.790600146794[/C][C]0.129399853206337[/C][/ROW]
[ROW][C]61[/C][C]212.42[/C][C]223.983456998942[/C][C]-11.5634569989418[/C][/ROW]
[ROW][C]62[/C][C]212.34[/C][C]215.23523411304[/C][C]-2.89523411303958[/C][/ROW]
[ROW][C]63[/C][C]212.95[/C][C]213.371898845524[/C][C]-0.421898845524481[/C][/ROW]
[ROW][C]64[/C][C]213.37[/C][C]212.543789198247[/C][C]0.826210801753234[/C][/ROW]
[ROW][C]65[/C][C]214.26[/C][C]212.549045805214[/C][C]1.71095419478613[/C][/ROW]
[ROW][C]66[/C][C]214.1[/C][C]213.136421153544[/C][C]0.963578846456329[/C][/ROW]
[ROW][C]67[/C][C]213.54[/C][C]214.015713338966[/C][C]-0.475713338966131[/C][/ROW]
[ROW][C]68[/C][C]213.69[/C][C]213.931040626194[/C][C]-0.241040626194348[/C][/ROW]
[ROW][C]69[/C][C]211.82[/C][C]214.197010538969[/C][C]-2.37701053896899[/C][/ROW]
[ROW][C]70[/C][C]212.82[/C][C]212.602245598892[/C][C]0.217754401107925[/C][/ROW]
[ROW][C]71[/C][C]212.36[/C][C]212.43305621672[/C][C]-0.0730562167197775[/C][/ROW]
[ROW][C]72[/C][C]212.7[/C][C]211.958164618425[/C][C]0.741835381574504[/C][/ROW]
[/TABLE]
Source: https://freestatistics.org/blog/index.php?pk=260214&T=2

Globally Unique Identifier (entire table): ba.freestatistics.org/blog/index.php?pk=260214&T=2

As an alternative you can also use a QR Code:  

The GUIDs for individual cells are displayed in the table below:

Interpolation Forecasts of Exponential Smoothing
tObservedFittedResiduals
13221.67221.986006944445-0.316006944444524
14221.72221.885548619625-0.165548619625326
15221.67221.82270035506-0.152700355059864
16220.29220.314265152492-0.0242651524922053
17220.75220.6665909396310.0834090603693198
18219.59219.5392109231950.0507890768053301
19219.59220.795624572318-1.20562457231827
20219.59220.022886269004-0.432886269004229
21219.82219.895091259659-0.075091259658592
22221.59218.3522818853053.23771811469476
23220.9221.46356290562-0.563562905620216
24221.01221.244542068864-0.234542068863959
25221.01221.066751017949-0.0567510179492388
26219.69221.199988010648-1.5099880106477
27221220.1115777797480.888422220252352
28219.82219.4298408941060.390159105893702
29218.04220.124523928532-2.08452392853178
30217.97217.330875481360.639124518639676
31217.97218.742224300167-0.772224300166698
32217.53218.482609411722-0.952609411722136
33217218.041252958172-1.04125295817164
34217.18216.5375715675710.642428432429057
35217.68216.77023062120.909769378799865
36217.71217.755700688063-0.0457006880634196
37217.71217.764154883871-0.0541548838714903
38218.5217.5579585842910.942041415708843
39218.8218.908980633601-0.108980633600595
40218.94217.3471074101861.59289258981363
41220218.3805618170031.61943818299741
42219.89219.0605632882230.829436711776964
43219.89220.285934471987-0.395934471987147
44220.08220.271825734113-0.191825734113252
45220.16220.391690864939-0.231690864939395
46221219.902934748521.09706525147979
47222.16220.5462278445681.61377215543232
48221.5221.845828707356-0.345828707356446
49221.5221.622679928875-0.122679928874902
50221.6221.5981012854150.00189871458488255
51221.85221.98293094483-0.132930944829837
52223.11220.8025676395842.30743236041647
53222.79222.3889263592630.401073640737224
54222.45221.9512017286910.498798271309226
55222.45222.635728424808-0.185728424808019
56222.4222.830393249053-0.430393249053225
57223.15222.7583734559620.391626544038218
58224.4223.0586685761121.34133142388774
59224.24224.0102343199060.229765680093607
60223.92223.7906001467940.129399853206337
61212.42223.983456998942-11.5634569989418
62212.34215.23523411304-2.89523411303958
63212.95213.371898845524-0.421898845524481
64213.37212.5437891982470.826210801753234
65214.26212.5490458052141.71095419478613
66214.1213.1364211535440.963578846456329
67213.54214.015713338966-0.475713338966131
68213.69213.931040626194-0.241040626194348
69211.82214.197010538969-2.37701053896899
70212.82212.6022455988920.217754401107925
71212.36212.43305621672-0.0730562167197775
72212.7211.9581646184250.741835381574504


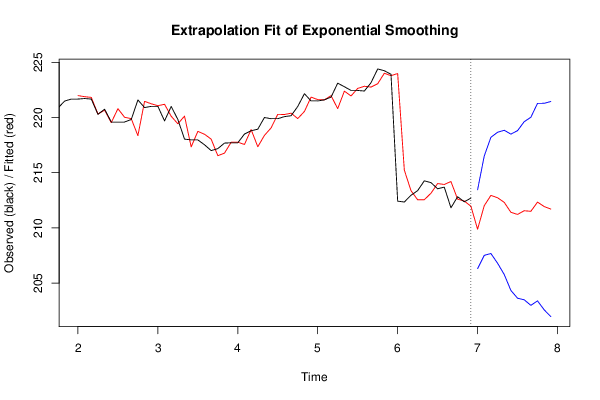
Extrapolation Forecasts of Exponential Smoothing
tForecast95% Lower Bound95% Upper Bound
73209.872485488095206.298021864542213.446949111647
74212.00752127027207.506930862056216.508111678483
75212.94030036267207.674007753167218.206592972174
76212.728197251817206.794196773614218.662197730019
77212.309209924662205.775383671867218.843036177457
78211.412011639303204.328974908626218.49504836998
79211.215962196227203.623338594697218.808585797758
80211.550373401378203.480276934735219.620469868021
81211.498935629113202.978079990896220.019791267329
82212.332339847442203.383401104008221.281278590876
83211.928232437757202.570773997553221.28569087796
84211.700681818182201.951807406921221.449556229443

\begin{tabular}{lllllllll}
\hline
Extrapolation Forecasts of Exponential Smoothing \tabularnewline
t & Forecast & 95% Lower Bound & 95% Upper Bound \tabularnewline
73 & 209.872485488095 & 206.298021864542 & 213.446949111647 \tabularnewline
74 & 212.00752127027 & 207.506930862056 & 216.508111678483 \tabularnewline
75 & 212.94030036267 & 207.674007753167 & 218.206592972174 \tabularnewline
76 & 212.728197251817 & 206.794196773614 & 218.662197730019 \tabularnewline
77 & 212.309209924662 & 205.775383671867 & 218.843036177457 \tabularnewline
78 & 211.412011639303 & 204.328974908626 & 218.49504836998 \tabularnewline
79 & 211.215962196227 & 203.623338594697 & 218.808585797758 \tabularnewline
80 & 211.550373401378 & 203.480276934735 & 219.620469868021 \tabularnewline
81 & 211.498935629113 & 202.978079990896 & 220.019791267329 \tabularnewline
82 & 212.332339847442 & 203.383401104008 & 221.281278590876 \tabularnewline
83 & 211.928232437757 & 202.570773997553 & 221.28569087796 \tabularnewline
84 & 211.700681818182 & 201.951807406921 & 221.449556229443 \tabularnewline
\hline
\end{tabular}
%Source: https://freestatistics.org/blog/index.php?pk=260214&T=3

[TABLE]
[ROW][C]Extrapolation Forecasts of Exponential Smoothing[/C][/ROW]
[ROW][C]t[/C][C]Forecast[/C][C]95% Lower Bound[/C][C]95% Upper Bound[/C][/ROW]
[ROW][C]73[/C][C]209.872485488095[/C][C]206.298021864542[/C][C]213.446949111647[/C][/ROW]
[ROW][C]74[/C][C]212.00752127027[/C][C]207.506930862056[/C][C]216.508111678483[/C][/ROW]
[ROW][C]75[/C][C]212.94030036267[/C][C]207.674007753167[/C][C]218.206592972174[/C][/ROW]
[ROW][C]76[/C][C]212.728197251817[/C][C]206.794196773614[/C][C]218.662197730019[/C][/ROW]
[ROW][C]77[/C][C]212.309209924662[/C][C]205.775383671867[/C][C]218.843036177457[/C][/ROW]
[ROW][C]78[/C][C]211.412011639303[/C][C]204.328974908626[/C][C]218.49504836998[/C][/ROW]
[ROW][C]79[/C][C]211.215962196227[/C][C]203.623338594697[/C][C]218.808585797758[/C][/ROW]
[ROW][C]80[/C][C]211.550373401378[/C][C]203.480276934735[/C][C]219.620469868021[/C][/ROW]
[ROW][C]81[/C][C]211.498935629113[/C][C]202.978079990896[/C][C]220.019791267329[/C][/ROW]
[ROW][C]82[/C][C]212.332339847442[/C][C]203.383401104008[/C][C]221.281278590876[/C][/ROW]
[ROW][C]83[/C][C]211.928232437757[/C][C]202.570773997553[/C][C]221.28569087796[/C][/ROW]
[ROW][C]84[/C][C]211.700681818182[/C][C]201.951807406921[/C][C]221.449556229443[/C][/ROW]
[/TABLE]
Source: https://freestatistics.org/blog/index.php?pk=260214&T=3

Globally Unique Identifier (entire table): ba.freestatistics.org/blog/index.php?pk=260214&T=3

As an alternative you can also use a QR Code:  

The GUIDs for individual cells are displayed in the table below:

Extrapolation Forecasts of Exponential Smoothing
tForecast95% Lower Bound95% Upper Bound
73209.872485488095206.298021864542213.446949111647
74212.00752127027207.506930862056216.508111678483
75212.94030036267207.674007753167218.206592972174
76212.728197251817206.794196773614218.662197730019
77212.309209924662205.775383671867218.843036177457
78211.412011639303204.328974908626218.49504836998
79211.215962196227203.623338594697218.808585797758
80211.550373401378203.480276934735219.620469868021
81211.498935629113202.978079990896220.019791267329
82212.332339847442203.383401104008221.281278590876
83211.928232437757202.570773997553221.28569087796
84211.700681818182201.951807406921221.449556229443


Parameters (Session):
par1 = 12 ; par2 = Triple ; par3 = additive ;
Parameters (R input):
par1 = 12 ; par2 = Triple ; par3 = additive ;
R code (references can be found in the software module):
par3 <- 'additive'
par2 <- 'Single'
par1 <- '12'
par1 <- as.numeric(par1)
if (par2 == 'Single') K <- 1
if (par2 == 'Double') K <- 2
if (par2 == 'Triple') K <- par1
nx <- length(x)
nxmK <- nx - K
x <- ts(x, frequency = par1)
if (par2 == 'Single') fit <- HoltWinters(x, gamma=F, beta=F)
if (par2 == 'Double') fit <- HoltWinters(x, gamma=F)
if (par2 == 'Triple') fit <- HoltWinters(x, seasonal=par3)
fit
myresid <- x - fit$fitted[,'xhat']
bitmap(file='test1.png')
op <- par(mfrow=c(2,1))
plot(fit,ylab='Observed (black) / Fitted (red)',main='Interpolation Fit of Exponential Smoothing')
plot(myresid,ylab='Residuals',main='Interpolation Prediction Errors')
par(op)
dev.off()
bitmap(file='test2.png')
p <- predict(fit, par1, prediction.interval=TRUE)
np <- length(p[,1])
plot(fit,p,ylab='Observed (black) / Fitted (red)',main='Extrapolation Fit of Exponential Smoothing')
dev.off()
bitmap(file='test3.png')
op <- par(mfrow = c(2,2))
acf(as.numeric(myresid),lag.max = nx/2,main='Residual ACF')
spectrum(myresid,main='Residals Periodogram')
cpgram(myresid,main='Residal Cumulative Periodogram')
qqnorm(myresid,main='Residual Normal QQ Plot')
qqline(myresid)
par(op)
dev.off()
load(file='createtable')
a<-table.start()
a<-table.row.start(a)
a<-table.element(a,'Estimated Parameters of Exponential Smoothing',2,TRUE)
a<-table.row.end(a)
a<-table.row.start(a)
a<-table.element(a,'Parameter',header=TRUE)
a<-table.element(a,'Value',header=TRUE)
a<-table.row.end(a)
a<-table.row.start(a)
a<-table.element(a,'alpha',header=TRUE)
a<-table.element(a,fit$alpha)
a<-table.row.end(a)
a<-table.row.start(a)
a<-table.element(a,'beta',header=TRUE)
a<-table.element(a,fit$beta)
a<-table.row.end(a)
a<-table.row.start(a)
a<-table.element(a,'gamma',header=TRUE)
a<-table.element(a,fit$gamma)
a<-table.row.end(a)
a<-table.end(a)
table.save(a,file='mytable.tab')
a<-table.start()
a<-table.row.start(a)
a<-table.element(a,'Interpolation Forecasts of Exponential Smoothing',4,TRUE)
a<-table.row.end(a)
a<-table.row.start(a)
a<-table.element(a,'t',header=TRUE)
a<-table.element(a,'Observed',header=TRUE)
a<-table.element(a,'Fitted',header=TRUE)
a<-table.element(a,'Residuals',header=TRUE)
a<-table.row.end(a)
for (i in 1:nxmK) {
a<-table.row.start(a)
a<-table.element(a,i+K,header=TRUE)
a<-table.element(a,x[i+K])
a<-table.element(a,fit$fitted[i,'xhat'])
a<-table.element(a,myresid[i])
a<-table.row.end(a)
}
a<-table.end(a)
table.save(a,file='mytable1.tab')
a<-table.start()
a<-table.row.start(a)
a<-table.element(a,'Extrapolation Forecasts of Exponential Smoothing',4,TRUE)
a<-table.row.end(a)
a<-table.row.start(a)
a<-table.element(a,'t',header=TRUE)
a<-table.element(a,'Forecast',header=TRUE)
a<-table.element(a,'95% Lower Bound',header=TRUE)
a<-table.element(a,'95% Upper Bound',header=TRUE)
a<-table.row.end(a)
for (i in 1:np) {
a<-table.row.start(a)
a<-table.element(a,nx+i,header=TRUE)
a<-table.element(a,p[i,'fit'])
a<-table.element(a,p[i,'lwr'])
a<-table.element(a,p[i,'upr'])
a<-table.row.end(a)
}
a<-table.end(a)
table.save(a,file='mytable2.tab')