Free Statistics
of Irreproducible Research!
Description of Statistical Computation | |||||||||||||||||||||||||||||||||||||||||||||||||||||||||||||||||||||||||||||||||||||||||||||||||||||||||||||||||||||||||||||||||||||||||||||||||||||||||||||||||||||||||||||||||||||||||||||||||||||||||||||||||||||||||||||||||||||||||||||||||||||||||||||||||||||||||||||||||||||||||||||||||||||||||||||||||||||||||||||||||||||||||||||
|---|---|---|---|---|---|---|---|---|---|---|---|---|---|---|---|---|---|---|---|---|---|---|---|---|---|---|---|---|---|---|---|---|---|---|---|---|---|---|---|---|---|---|---|---|---|---|---|---|---|---|---|---|---|---|---|---|---|---|---|---|---|---|---|---|---|---|---|---|---|---|---|---|---|---|---|---|---|---|---|---|---|---|---|---|---|---|---|---|---|---|---|---|---|---|---|---|---|---|---|---|---|---|---|---|---|---|---|---|---|---|---|---|---|---|---|---|---|---|---|---|---|---|---|---|---|---|---|---|---|---|---|---|---|---|---|---|---|---|---|---|---|---|---|---|---|---|---|---|---|---|---|---|---|---|---|---|---|---|---|---|---|---|---|---|---|---|---|---|---|---|---|---|---|---|---|---|---|---|---|---|---|---|---|---|---|---|---|---|---|---|---|---|---|---|---|---|---|---|---|---|---|---|---|---|---|---|---|---|---|---|---|---|---|---|---|---|---|---|---|---|---|---|---|---|---|---|---|---|---|---|---|---|---|---|---|---|---|---|---|---|---|---|---|---|---|---|---|---|---|---|---|---|---|---|---|---|---|---|---|---|---|---|---|---|---|---|---|---|---|---|---|---|---|---|---|---|---|---|---|---|---|---|---|---|---|---|---|---|---|---|---|---|---|---|---|---|---|---|---|---|---|---|---|---|---|---|---|---|---|---|---|---|---|---|---|---|---|---|---|---|---|---|---|---|---|---|---|---|---|---|---|---|---|
| Author's title | |||||||||||||||||||||||||||||||||||||||||||||||||||||||||||||||||||||||||||||||||||||||||||||||||||||||||||||||||||||||||||||||||||||||||||||||||||||||||||||||||||||||||||||||||||||||||||||||||||||||||||||||||||||||||||||||||||||||||||||||||||||||||||||||||||||||||||||||||||||||||||||||||||||||||||||||||||||||||||||||||||||||||||||
| Author | *Unverified author* | ||||||||||||||||||||||||||||||||||||||||||||||||||||||||||||||||||||||||||||||||||||||||||||||||||||||||||||||||||||||||||||||||||||||||||||||||||||||||||||||||||||||||||||||||||||||||||||||||||||||||||||||||||||||||||||||||||||||||||||||||||||||||||||||||||||||||||||||||||||||||||||||||||||||||||||||||||||||||||||||||||||||||||||
| R Software Module | rwasp_histogram.wasp | ||||||||||||||||||||||||||||||||||||||||||||||||||||||||||||||||||||||||||||||||||||||||||||||||||||||||||||||||||||||||||||||||||||||||||||||||||||||||||||||||||||||||||||||||||||||||||||||||||||||||||||||||||||||||||||||||||||||||||||||||||||||||||||||||||||||||||||||||||||||||||||||||||||||||||||||||||||||||||||||||||||||||||||
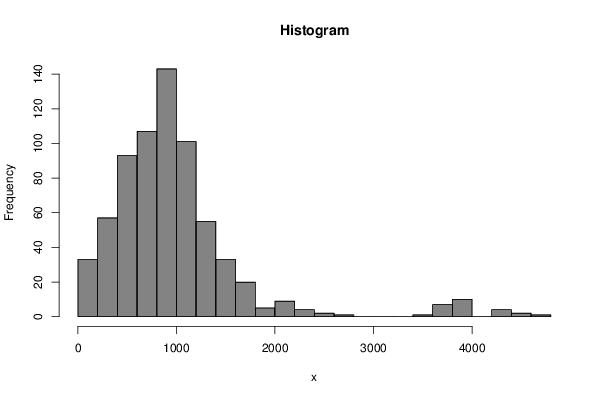
| Title produced by software | Histogram | ||||||||||||||||||||||||||||||||||||||||||||||||||||||||||||||||||||||||||||||||||||||||||||||||||||||||||||||||||||||||||||||||||||||||||||||||||||||||||||||||||||||||||||||||||||||||||||||||||||||||||||||||||||||||||||||||||||||||||||||||||||||||||||||||||||||||||||||||||||||||||||||||||||||||||||||||||||||||||||||||||||||||||||
| Date of computation | Wed, 26 Nov 2014 16:11:52 +0000 | ||||||||||||||||||||||||||||||||||||||||||||||||||||||||||||||||||||||||||||||||||||||||||||||||||||||||||||||||||||||||||||||||||||||||||||||||||||||||||||||||||||||||||||||||||||||||||||||||||||||||||||||||||||||||||||||||||||||||||||||||||||||||||||||||||||||||||||||||||||||||||||||||||||||||||||||||||||||||||||||||||||||||||||
| Cite this page as follows | Statistical Computations at FreeStatistics.org, Office for Research Development and Education, URL https://freestatistics.org/blog/index.php?v=date/2014/Nov/26/t1417018353pj5ffcdo5w73hai.htm/, Retrieved Sun, 19 May 2024 15:38:43 +0000 | ||||||||||||||||||||||||||||||||||||||||||||||||||||||||||||||||||||||||||||||||||||||||||||||||||||||||||||||||||||||||||||||||||||||||||||||||||||||||||||||||||||||||||||||||||||||||||||||||||||||||||||||||||||||||||||||||||||||||||||||||||||||||||||||||||||||||||||||||||||||||||||||||||||||||||||||||||||||||||||||||||||||||||||
| Statistical Computations at FreeStatistics.org, Office for Research Development and Education, URL https://freestatistics.org/blog/index.php?pk=259268, Retrieved Sun, 19 May 2024 15:38:43 +0000 | |||||||||||||||||||||||||||||||||||||||||||||||||||||||||||||||||||||||||||||||||||||||||||||||||||||||||||||||||||||||||||||||||||||||||||||||||||||||||||||||||||||||||||||||||||||||||||||||||||||||||||||||||||||||||||||||||||||||||||||||||||||||||||||||||||||||||||||||||||||||||||||||||||||||||||||||||||||||||||||||||||||||||||||
| QR Codes: | |||||||||||||||||||||||||||||||||||||||||||||||||||||||||||||||||||||||||||||||||||||||||||||||||||||||||||||||||||||||||||||||||||||||||||||||||||||||||||||||||||||||||||||||||||||||||||||||||||||||||||||||||||||||||||||||||||||||||||||||||||||||||||||||||||||||||||||||||||||||||||||||||||||||||||||||||||||||||||||||||||||||||||||
|
| |||||||||||||||||||||||||||||||||||||||||||||||||||||||||||||||||||||||||||||||||||||||||||||||||||||||||||||||||||||||||||||||||||||||||||||||||||||||||||||||||||||||||||||||||||||||||||||||||||||||||||||||||||||||||||||||||||||||||||||||||||||||||||||||||||||||||||||||||||||||||||||||||||||||||||||||||||||||||||||||||||||||||||||
| Original text written by user: | |||||||||||||||||||||||||||||||||||||||||||||||||||||||||||||||||||||||||||||||||||||||||||||||||||||||||||||||||||||||||||||||||||||||||||||||||||||||||||||||||||||||||||||||||||||||||||||||||||||||||||||||||||||||||||||||||||||||||||||||||||||||||||||||||||||||||||||||||||||||||||||||||||||||||||||||||||||||||||||||||||||||||||||
| IsPrivate? | No (this computation is public) | ||||||||||||||||||||||||||||||||||||||||||||||||||||||||||||||||||||||||||||||||||||||||||||||||||||||||||||||||||||||||||||||||||||||||||||||||||||||||||||||||||||||||||||||||||||||||||||||||||||||||||||||||||||||||||||||||||||||||||||||||||||||||||||||||||||||||||||||||||||||||||||||||||||||||||||||||||||||||||||||||||||||||||||
| User-defined keywords | |||||||||||||||||||||||||||||||||||||||||||||||||||||||||||||||||||||||||||||||||||||||||||||||||||||||||||||||||||||||||||||||||||||||||||||||||||||||||||||||||||||||||||||||||||||||||||||||||||||||||||||||||||||||||||||||||||||||||||||||||||||||||||||||||||||||||||||||||||||||||||||||||||||||||||||||||||||||||||||||||||||||||||||
| Estimated Impact | 70 | ||||||||||||||||||||||||||||||||||||||||||||||||||||||||||||||||||||||||||||||||||||||||||||||||||||||||||||||||||||||||||||||||||||||||||||||||||||||||||||||||||||||||||||||||||||||||||||||||||||||||||||||||||||||||||||||||||||||||||||||||||||||||||||||||||||||||||||||||||||||||||||||||||||||||||||||||||||||||||||||||||||||||||||
Tree of Dependent Computations | |||||||||||||||||||||||||||||||||||||||||||||||||||||||||||||||||||||||||||||||||||||||||||||||||||||||||||||||||||||||||||||||||||||||||||||||||||||||||||||||||||||||||||||||||||||||||||||||||||||||||||||||||||||||||||||||||||||||||||||||||||||||||||||||||||||||||||||||||||||||||||||||||||||||||||||||||||||||||||||||||||||||||||||
| Family? (F = Feedback message, R = changed R code, M = changed R Module, P = changed Parameters, D = changed Data) | |||||||||||||||||||||||||||||||||||||||||||||||||||||||||||||||||||||||||||||||||||||||||||||||||||||||||||||||||||||||||||||||||||||||||||||||||||||||||||||||||||||||||||||||||||||||||||||||||||||||||||||||||||||||||||||||||||||||||||||||||||||||||||||||||||||||||||||||||||||||||||||||||||||||||||||||||||||||||||||||||||||||||||||
| - [Histogram] [test] [2014-11-26 16:11:52] [d41d8cd98f00b204e9800998ecf8427e] [Current] | |||||||||||||||||||||||||||||||||||||||||||||||||||||||||||||||||||||||||||||||||||||||||||||||||||||||||||||||||||||||||||||||||||||||||||||||||||||||||||||||||||||||||||||||||||||||||||||||||||||||||||||||||||||||||||||||||||||||||||||||||||||||||||||||||||||||||||||||||||||||||||||||||||||||||||||||||||||||||||||||||||||||||||||
| Feedback Forum | |||||||||||||||||||||||||||||||||||||||||||||||||||||||||||||||||||||||||||||||||||||||||||||||||||||||||||||||||||||||||||||||||||||||||||||||||||||||||||||||||||||||||||||||||||||||||||||||||||||||||||||||||||||||||||||||||||||||||||||||||||||||||||||||||||||||||||||||||||||||||||||||||||||||||||||||||||||||||||||||||||||||||||||
Post a new message | |||||||||||||||||||||||||||||||||||||||||||||||||||||||||||||||||||||||||||||||||||||||||||||||||||||||||||||||||||||||||||||||||||||||||||||||||||||||||||||||||||||||||||||||||||||||||||||||||||||||||||||||||||||||||||||||||||||||||||||||||||||||||||||||||||||||||||||||||||||||||||||||||||||||||||||||||||||||||||||||||||||||||||||
Dataset | |||||||||||||||||||||||||||||||||||||||||||||||||||||||||||||||||||||||||||||||||||||||||||||||||||||||||||||||||||||||||||||||||||||||||||||||||||||||||||||||||||||||||||||||||||||||||||||||||||||||||||||||||||||||||||||||||||||||||||||||||||||||||||||||||||||||||||||||||||||||||||||||||||||||||||||||||||||||||||||||||||||||||||||
| Dataseries X: | |||||||||||||||||||||||||||||||||||||||||||||||||||||||||||||||||||||||||||||||||||||||||||||||||||||||||||||||||||||||||||||||||||||||||||||||||||||||||||||||||||||||||||||||||||||||||||||||||||||||||||||||||||||||||||||||||||||||||||||||||||||||||||||||||||||||||||||||||||||||||||||||||||||||||||||||||||||||||||||||||||||||||||||
749.50 1074.75 1499.67 1124.75 499.67 799.50 1333.00 1333.00 1166.33 533.20 583.17 499.67 874.75 666.33 666.33 433.00 1099.00 1299.00 732.67 433.00 1166.33 999.75 599.67 999.80 899.80 1333.00 799.80 624.75 999.80 399.80 1159.00 799.80 1333.00 999.67 899.80 653.20 833.00 533.20 499.75 666.33 714.00 533.20 666.33 766.33 499.75 499.75 666.33 499.80 479.60 999.67 999.67 1199.00 1124.75 499.90 1099.00 999.80 699.50 1159.00 1266.33 499.90 739.80 799.60 999.67 416.46 826.00 599.80 499.67 1074.75 1249.75 399.67 699.80 1666.33 888.33 866.00 799.80 1499.67 799.80 732.67 933.00 649.50 499.67 1333.00 999.75 1124.75 1299.00 999.67 399.67 999.75 1239.00 499.67 433.00 1466.33 1249.75 433.00 999.80 599.87 1199.75 999.75 626.53 959.80 1166.33 1166.33 999.75 499.67 399.92 899.80 1599.67 266.33 1199.00 1279.00 1333.00 1199.00 1299.00 1333.00 266.53 399.87 1320.00 999.80 599.67 1124.75 899.80 1159.00 599.87 1333.00 833.00 1239.00 1159.00 1566.33 874.75 1333.00 1199.00 999.67 1099.00 249.95 1259.00 999.80 779.50 1016.10 729.50 639.50 999.80 119.90 999.80 1199.00 833.00 1499.67 399.60 732.67 1433.00 999.80 1159.00 766.33 999.80 1666.33 566.33 333.00 949.75 449.90 1166.33 933.00 1166.33 1074.75 439.60 399.60 999.75 999.17 1199.00 706.00 1199.75 533.20 499.75 1166.33 999.17 1099.00 1099.00 533.20 1239.00 999.60 533.20 866.00 1498.75 599.60 999.67 1359.00 499.90 999.67 1199.00 799.80 1039.00 1099.67 1166.33 466.33 279.92 999.80 1259.00 899.80 1059.00 1074.75 499.75 499.80 732.67 1099.00 666.53 759.80 1333.00 1499.00 1266.33 2266.67 932.67 699.50 1499.67 649.50 1159.00 949.75 1433.00 999.75 499.67 89.90 1099.00 999.67 599.67 333.20 333.20 999.80 1074.75 1199.00 824.75 965.83 1099.00 299.75 749.50 1499.67 1099.67 999.80 333.20 1499.00 1333.00 649.50 499.67 859.80 833.17 1333.00 732.67 799.50 1333.00 1499.67 333.00 499.67 1499.67 466.33 499.75 607.92 639.50 1333.00 666.50 799.80 890.00 343.92 1333.00 589.50 799.80 599.87 999.80 1199.00 199.80 1333.00 1499.67 712.00 799.80 1099.00 1124.75 1099.00 1099.00 866.00 1499.67 399.60 399.60 1199.00 833.17 1199.00 1199.00 999.80 766.33 850.00 1333.00 1433.00 1259.00 1499.67 999.80 1765.00 1765.00 1433.00 999.80 899.80 1433.00 699.50 999.80 1765.00 259.80 1099.00 830.00 679.00 399.60 1099.00 333.00 424.75 699.50 932.67 666.53 999.80 1765.00 499.67 499.67 799.50 499.83 299.90 732.67 1059.00 999.00 959.80 1499.67 866.00 199.80 649.50 1333.00 2380.00 533.20 799.50 1333.00 686.88 1266.67 939.80 1059.00 433.00 699.50 936.88 866.00 1059.00 920.00 1333.00 1765.00 1099.00 449.90 555.44 649.50 1166.33 299.90 1249.75 1059.00 732.67 1433.00 999.67 499.67 2026.67 666.53 999.00 999.00 1166.33 499.67 119.90 866.00 1199.00 1099.00 249.90 333.00 920.00 533.20 359.92 333.00 186.00 266.00 920.00 499.90 599.67 999.80 219.00 1166.33 589.50 699.50 1099.00 939.80 830.00 890.00 433.00 299.90 199.80 799.33 333.00 466.33 999.00 699.50 680.00 1159.00 1159.00 299.80 559.80 599.50 619.80 866.00 399.60 333.00 999.80 3700.00 850.00 999.80 129.90 999.80 1166.33 498.33 1099.00 1199.00 699.80 1399.00 899.80 999.80 1333.00 279.90 1400.00 433.00 999.33 990.00 299.90 870.00 399.90 1099.00 729.50 666.53 1099.00 419.80 269.90 799.80 665.00 433.00 499.67 999.33 4700.00 666.53 970.00 1166.33 911.88 1399.00 899.67 666.53 1771.43 729.50 1999.60 259.80 433.00 1139.00 729.50 599.67 860.00 624.75 899.80 433.00 799.33 1199.00 1399.00 3700.00 3700.00 4500.00 3900.00 3900.00 533.00 541.25 259.80 279.80 2026.67 199.80 599.67 999.67 939.80 789.50 1433.00 331.67 3900.00 3900.00 3900.00 599.67 1499.00 1199.67 559.60 599.67 199.80 866.00 599.80 1099.67 811.88 199.80 959.80 433.00 1498.00 1230.00 1960.00 231.80 833.17 1159.00 999.67 1333.00 629.50 933.00 932.67 1599.67 1399.00 1499.00 990.00 990.00 4300.00 4500.00 3900.00 4300.00 4333.33 1230.00 1230.00 1059.00 1960.00 1960.00 1750.00 3700.00 499.80 777.22 3550.00 999.67 729.50 1099.67 559.80 899.80 999.80 89.90 990.00 970.00 4333.33 1190.00 3800.00 3700.00 324.75 1650.00 199.80 721.67 333.20 649.50 833.00 366.56 1099.00 649.50 1299.00 1139.00 659.80 699.50 792.00 799.50 1166.33 1266.33 1059.00 2026.67 1399.00 911.88 1099.00 1299.00 199.00 1700.00 1700.00 749.50 374.75 79.93 499.67 599.67 1199.00 811.88 2026.67 899.80 239.92 1099.67 1099.00 719.80 64.95 890.00 799.33 890.00 1628.57 799.50 2026.67 199.80 2026.67 2026.67 1439.00 1399.00 1332.50 1099.00 833.00 599.67 199.80 1266.33 890.00 890.00 3700.00 324.75 1780.00 3800.00 386.53 133.20 1079.00 429.90 3633.33 499.67 2200.00 3800.00 1650.00 199.80 319.80 49.95 699.50 1433.00 799.50 1099.00 799.50 933.00 199.80 1720.00 599.67 1760.00 1800.00 283.17 59.95 799.50 2026.67 2026.67 1700.00 699.50 899.80 1439.00 1099.00 911.88 3900.00 999.75 859.80 2600.00 840.00 1760.00 1760.00 599.67 339.80 339.80 199.80 950.00 1099.00 999.67 2400.00 2200.00 549.50 1099.67 1599.67 649.50 2550.00 699.50 579.50 789.50 789.50 789.50 555.44 199.80 1099.00 1099.00 1099.00 999.80 996.00 999.80 699.50 789.50 1399.00 199.80 996.00 996.00 996.00 996.00 699.50 333.00 199.80 199.80 199.80 199.80 699.50 199.80 199.80 1166.33 766.33 199.80 719.50 | |||||||||||||||||||||||||||||||||||||||||||||||||||||||||||||||||||||||||||||||||||||||||||||||||||||||||||||||||||||||||||||||||||||||||||||||||||||||||||||||||||||||||||||||||||||||||||||||||||||||||||||||||||||||||||||||||||||||||||||||||||||||||||||||||||||||||||||||||||||||||||||||||||||||||||||||||||||||||||||||||||||||||||||
Tables (Output of Computation) | |||||||||||||||||||||||||||||||||||||||||||||||||||||||||||||||||||||||||||||||||||||||||||||||||||||||||||||||||||||||||||||||||||||||||||||||||||||||||||||||||||||||||||||||||||||||||||||||||||||||||||||||||||||||||||||||||||||||||||||||||||||||||||||||||||||||||||||||||||||||||||||||||||||||||||||||||||||||||||||||||||||||||||||
| |||||||||||||||||||||||||||||||||||||||||||||||||||||||||||||||||||||||||||||||||||||||||||||||||||||||||||||||||||||||||||||||||||||||||||||||||||||||||||||||||||||||||||||||||||||||||||||||||||||||||||||||||||||||||||||||||||||||||||||||||||||||||||||||||||||||||||||||||||||||||||||||||||||||||||||||||||||||||||||||||||||||||||||
Figures (Output of Computation) | |||||||||||||||||||||||||||||||||||||||||||||||||||||||||||||||||||||||||||||||||||||||||||||||||||||||||||||||||||||||||||||||||||||||||||||||||||||||||||||||||||||||||||||||||||||||||||||||||||||||||||||||||||||||||||||||||||||||||||||||||||||||||||||||||||||||||||||||||||||||||||||||||||||||||||||||||||||||||||||||||||||||||||||
Input Parameters & R Code | |||||||||||||||||||||||||||||||||||||||||||||||||||||||||||||||||||||||||||||||||||||||||||||||||||||||||||||||||||||||||||||||||||||||||||||||||||||||||||||||||||||||||||||||||||||||||||||||||||||||||||||||||||||||||||||||||||||||||||||||||||||||||||||||||||||||||||||||||||||||||||||||||||||||||||||||||||||||||||||||||||||||||||||
| Parameters (Session): | |||||||||||||||||||||||||||||||||||||||||||||||||||||||||||||||||||||||||||||||||||||||||||||||||||||||||||||||||||||||||||||||||||||||||||||||||||||||||||||||||||||||||||||||||||||||||||||||||||||||||||||||||||||||||||||||||||||||||||||||||||||||||||||||||||||||||||||||||||||||||||||||||||||||||||||||||||||||||||||||||||||||||||||
| par1 = 20 ; par2 = grey ; par3 = FALSE ; par4 = Unknown ; | |||||||||||||||||||||||||||||||||||||||||||||||||||||||||||||||||||||||||||||||||||||||||||||||||||||||||||||||||||||||||||||||||||||||||||||||||||||||||||||||||||||||||||||||||||||||||||||||||||||||||||||||||||||||||||||||||||||||||||||||||||||||||||||||||||||||||||||||||||||||||||||||||||||||||||||||||||||||||||||||||||||||||||||
| Parameters (R input): | |||||||||||||||||||||||||||||||||||||||||||||||||||||||||||||||||||||||||||||||||||||||||||||||||||||||||||||||||||||||||||||||||||||||||||||||||||||||||||||||||||||||||||||||||||||||||||||||||||||||||||||||||||||||||||||||||||||||||||||||||||||||||||||||||||||||||||||||||||||||||||||||||||||||||||||||||||||||||||||||||||||||||||||
| par1 = 20 ; par2 = grey ; par3 = FALSE ; par4 = Unknown ; | |||||||||||||||||||||||||||||||||||||||||||||||||||||||||||||||||||||||||||||||||||||||||||||||||||||||||||||||||||||||||||||||||||||||||||||||||||||||||||||||||||||||||||||||||||||||||||||||||||||||||||||||||||||||||||||||||||||||||||||||||||||||||||||||||||||||||||||||||||||||||||||||||||||||||||||||||||||||||||||||||||||||||||||
| R code (references can be found in the software module): | |||||||||||||||||||||||||||||||||||||||||||||||||||||||||||||||||||||||||||||||||||||||||||||||||||||||||||||||||||||||||||||||||||||||||||||||||||||||||||||||||||||||||||||||||||||||||||||||||||||||||||||||||||||||||||||||||||||||||||||||||||||||||||||||||||||||||||||||||||||||||||||||||||||||||||||||||||||||||||||||||||||||||||||
par4 <- 'Unknown' | |||||||||||||||||||||||||||||||||||||||||||||||||||||||||||||||||||||||||||||||||||||||||||||||||||||||||||||||||||||||||||||||||||||||||||||||||||||||||||||||||||||||||||||||||||||||||||||||||||||||||||||||||||||||||||||||||||||||||||||||||||||||||||||||||||||||||||||||||||||||||||||||||||||||||||||||||||||||||||||||||||||||||||||