Free Statistics

of Irreproducible Research!

Author's title

Author*Unverified author*
R Software Modulerwasp_smp.wasp
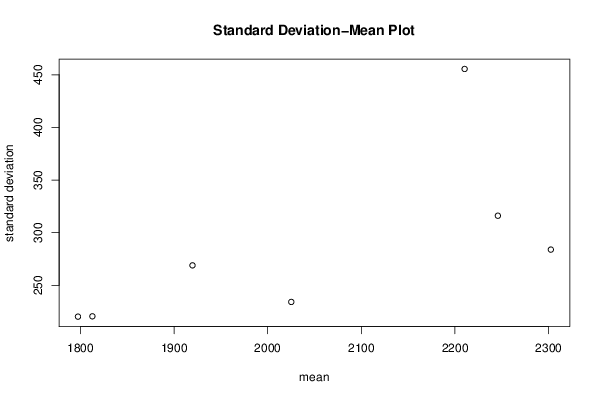
Title produced by softwareStandard Deviation-Mean Plot
Date of computationSun, 23 Nov 2014 14:10:41 +0000
Cite this page as followsStatistical Computations at FreeStatistics.org, Office for Research Development and Education, URL https://freestatistics.org/blog/index.php?v=date/2014/Nov/23/t1416751860fy1e36a48cgfiet.htm/, Retrieved Sun, 19 May 2024 13:21:49 +0000
Statistical Computations at FreeStatistics.org, Office for Research Development and Education, URL https://freestatistics.org/blog/index.php?pk=258001, Retrieved Sun, 19 May 2024 13:21:49 +0000
QR Codes:

Original text written by user:
IsPrivate?No (this computation is public)
User-defined keywords
Estimated Impact65
Family? (F = Feedback message, R = changed R code, M = changed R Module, P = changed Parameters, D = changed Data)
-       [Standard Deviation-Mean Plot] [] [2014-11-23 14:10:41] [397b699eae6f3431a51b0bb18afa5c27] [Current]
Feedback Forum

Post a new message
Dataseries X:
2011
2203
2523
2565
2596
2545
1935
2386
2478
2457
2194
1736
1881
2520
2381
2419
2541
2514
1737
2221
2648
2159
2184
1745
1770
1871
2137
2283
2042
2099
1653
2254
2302
2233
1974
1684
1842
1592
2175
2366
2569
2894
2159
2877
2419
2305
1812
1514
1557
1606
1988
1901
1993
1993
1420
1927
2029
1899
1759
1496
2091
1850
2326
2212
2083
2048
1642
2014
1844
1846
1743
1337
1682
1512
2050
2108
1948
1927
1641
1916
1921
1858
1823
1367


Summary of computational transaction
Raw Inputview raw input (R code)
Raw Outputview raw output of R engine
Computing time1 seconds
R Server'Sir Ronald Aylmer Fisher' @ fisher.wessa.net

\begin{tabular}{lllllllll}
\hline
Summary of computational transaction \tabularnewline
Raw Input & view raw input (R code)  \tabularnewline
Raw Output & view raw output of R engine  \tabularnewline
Computing time & 1 seconds \tabularnewline
R Server & 'Sir Ronald Aylmer Fisher' @ fisher.wessa.net \tabularnewline
\hline
\end{tabular}
%Source: https://freestatistics.org/blog/index.php?pk=258001&T=0

[TABLE]
[ROW][C]Summary of computational transaction[/C][/ROW]
[ROW][C]Raw Input[/C][C]view raw input (R code) [/C][/ROW]
[ROW][C]Raw Output[/C][C]view raw output of R engine [/C][/ROW]
[ROW][C]Computing time[/C][C]1 seconds[/C][/ROW]
[ROW][C]R Server[/C][C]'Sir Ronald Aylmer Fisher' @ fisher.wessa.net[/C][/ROW]
[/TABLE]
Source: https://freestatistics.org/blog/index.php?pk=258001&T=0

Globally Unique Identifier (entire table): ba.freestatistics.org/blog/index.php?pk=258001&T=0

As an alternative you can also use a QR Code:  

The GUIDs for individual cells are displayed in the table below:

Summary of computational transaction
Raw Inputview raw input (R code)
Raw Outputview raw output of R engine
Computing time1 seconds
R Server'Sir Ronald Aylmer Fisher' @ fisher.wessa.net


Standard Deviation-Mean Plot
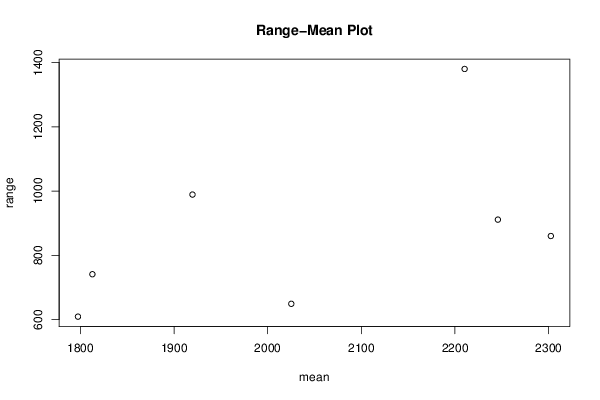
SectionMeanStandard DeviationRange
12302.41666666667283.923952152791860
22245.83333333333316.087972027735911
32025.16666666667234.193716759645649
42210.33333333333455.5377109094331380
51797.33333333333220.229357028008609
61919.66666666667268.968174302981989
71812.75220.551838886833741

\begin{tabular}{lllllllll}
\hline
Standard Deviation-Mean Plot \tabularnewline
Section & Mean & Standard Deviation & Range \tabularnewline
1 & 2302.41666666667 & 283.923952152791 & 860 \tabularnewline
2 & 2245.83333333333 & 316.087972027735 & 911 \tabularnewline
3 & 2025.16666666667 & 234.193716759645 & 649 \tabularnewline
4 & 2210.33333333333 & 455.537710909433 & 1380 \tabularnewline
5 & 1797.33333333333 & 220.229357028008 & 609 \tabularnewline
6 & 1919.66666666667 & 268.968174302981 & 989 \tabularnewline
7 & 1812.75 & 220.551838886833 & 741 \tabularnewline
\hline
\end{tabular}
%Source: https://freestatistics.org/blog/index.php?pk=258001&T=1

[TABLE]
[ROW][C]Standard Deviation-Mean Plot[/C][/ROW]
[ROW][C]Section[/C][C]Mean[/C][C]Standard Deviation[/C][C]Range[/C][/ROW]
[ROW][C]1[/C][C]2302.41666666667[/C][C]283.923952152791[/C][C]860[/C][/ROW]
[ROW][C]2[/C][C]2245.83333333333[/C][C]316.087972027735[/C][C]911[/C][/ROW]
[ROW][C]3[/C][C]2025.16666666667[/C][C]234.193716759645[/C][C]649[/C][/ROW]
[ROW][C]4[/C][C]2210.33333333333[/C][C]455.537710909433[/C][C]1380[/C][/ROW]
[ROW][C]5[/C][C]1797.33333333333[/C][C]220.229357028008[/C][C]609[/C][/ROW]
[ROW][C]6[/C][C]1919.66666666667[/C][C]268.968174302981[/C][C]989[/C][/ROW]
[ROW][C]7[/C][C]1812.75[/C][C]220.551838886833[/C][C]741[/C][/ROW]
[/TABLE]
Source: https://freestatistics.org/blog/index.php?pk=258001&T=1

Globally Unique Identifier (entire table): ba.freestatistics.org/blog/index.php?pk=258001&T=1

As an alternative you can also use a QR Code:  

The GUIDs for individual cells are displayed in the table below:

Standard Deviation-Mean Plot
SectionMeanStandard DeviationRange
12302.41666666667283.923952152791860
22245.83333333333316.087972027735911
32025.16666666667234.193716759645649
42210.33333333333455.5377109094331380
51797.33333333333220.229357028008609
61919.66666666667268.968174302981989
71812.75220.551838886833741


Regression: S.E.(k) = alpha + beta * Mean(k)
alpha-239.900816700956
beta0.257015994618655
S.D.0.133688364942132
T-STAT1.92250084537952
p-value0.112567161176938

\begin{tabular}{lllllllll}
\hline
Regression: S.E.(k) = alpha + beta * Mean(k) \tabularnewline
alpha & -239.900816700956 \tabularnewline
beta & 0.257015994618655 \tabularnewline
S.D. & 0.133688364942132 \tabularnewline
T-STAT & 1.92250084537952 \tabularnewline
p-value & 0.112567161176938 \tabularnewline
\hline
\end{tabular}
%Source: https://freestatistics.org/blog/index.php?pk=258001&T=2

[TABLE]
[ROW][C]Regression: S.E.(k) = alpha + beta * Mean(k)[/C][/ROW]
[ROW][C]alpha[/C][C]-239.900816700956[/C][/ROW]
[ROW][C]beta[/C][C]0.257015994618655[/C][/ROW]
[ROW][C]S.D.[/C][C]0.133688364942132[/C][/ROW]
[ROW][C]T-STAT[/C][C]1.92250084537952[/C][/ROW]
[ROW][C]p-value[/C][C]0.112567161176938[/C][/ROW]
[/TABLE]
Source: https://freestatistics.org/blog/index.php?pk=258001&T=2

Globally Unique Identifier (entire table): ba.freestatistics.org/blog/index.php?pk=258001&T=2

As an alternative you can also use a QR Code:  

The GUIDs for individual cells are displayed in the table below:

Regression: S.E.(k) = alpha + beta * Mean(k)
alpha-239.900816700956
beta0.257015994618655
S.D.0.133688364942132
T-STAT1.92250084537952
p-value0.112567161176938


Regression: ln S.E.(k) = alpha + beta * ln Mean(k)
alpha-8.00733178795251
beta1.78923892207135
S.D.0.778781591634643
T-STAT2.29748486776091
p-value0.069991912078787
Lambda-0.789238922071353

\begin{tabular}{lllllllll}
\hline
Regression: ln S.E.(k) = alpha + beta * ln Mean(k) \tabularnewline
alpha & -8.00733178795251 \tabularnewline
beta & 1.78923892207135 \tabularnewline
S.D. & 0.778781591634643 \tabularnewline
T-STAT & 2.29748486776091 \tabularnewline
p-value & 0.069991912078787 \tabularnewline
Lambda & -0.789238922071353 \tabularnewline
\hline
\end{tabular}
%Source: https://freestatistics.org/blog/index.php?pk=258001&T=3

[TABLE]
[ROW][C]Regression: ln S.E.(k) = alpha + beta * ln Mean(k)[/C][/ROW]
[ROW][C]alpha[/C][C]-8.00733178795251[/C][/ROW]
[ROW][C]beta[/C][C]1.78923892207135[/C][/ROW]
[ROW][C]S.D.[/C][C]0.778781591634643[/C][/ROW]
[ROW][C]T-STAT[/C][C]2.29748486776091[/C][/ROW]
[ROW][C]p-value[/C][C]0.069991912078787[/C][/ROW]
[ROW][C]Lambda[/C][C]-0.789238922071353[/C][/ROW]
[/TABLE]
Source: https://freestatistics.org/blog/index.php?pk=258001&T=3

Globally Unique Identifier (entire table): ba.freestatistics.org/blog/index.php?pk=258001&T=3

As an alternative you can also use a QR Code:  

The GUIDs for individual cells are displayed in the table below:

Regression: ln S.E.(k) = alpha + beta * ln Mean(k)
alpha-8.00733178795251
beta1.78923892207135
S.D.0.778781591634643
T-STAT2.29748486776091
p-value0.069991912078787
Lambda-0.789238922071353


Parameters (Session):
par1 = 12 ;
Parameters (R input):
par1 = 12 ;
R code (references can be found in the software module):
par1 <- as.numeric(par1)
(n <- length(x))
(np <- floor(n / par1))
arr <- array(NA,dim=c(par1,np))
j <- 0
k <- 1
for (i in 1:(np*par1))
{
j = j + 1
arr[j,k] <- x[i]
if (j == par1) {
j = 0
k=k+1
}
}
arr
arr.mean <- array(NA,dim=np)
arr.sd <- array(NA,dim=np)
arr.range <- array(NA,dim=np)
for (j in 1:np)
{
arr.mean[j] <- mean(arr[,j],na.rm=TRUE)
arr.sd[j] <- sd(arr[,j],na.rm=TRUE)
arr.range[j] <- max(arr[,j],na.rm=TRUE) - min(arr[,j],na.rm=TRUE)
}
arr.mean
arr.sd
arr.range
(lm1 <- lm(arr.sd~arr.mean))
(lnlm1 <- lm(log(arr.sd)~log(arr.mean)))
(lm2 <- lm(arr.range~arr.mean))
bitmap(file='test1.png')
plot(arr.mean,arr.sd,main='Standard Deviation-Mean Plot',xlab='mean',ylab='standard deviation')
dev.off()
bitmap(file='test2.png')
plot(arr.mean,arr.range,main='Range-Mean Plot',xlab='mean',ylab='range')
dev.off()
load(file='createtable')
a<-table.start()
a<-table.row.start(a)
a<-table.element(a,'Standard Deviation-Mean Plot',4,TRUE)
a<-table.row.end(a)
a<-table.row.start(a)
a<-table.element(a,'Section',header=TRUE)
a<-table.element(a,'Mean',header=TRUE)
a<-table.element(a,'Standard Deviation',header=TRUE)
a<-table.element(a,'Range',header=TRUE)
a<-table.row.end(a)
for (j in 1:np) {
a<-table.row.start(a)
a<-table.element(a,j,header=TRUE)
a<-table.element(a,arr.mean[j])
a<-table.element(a,arr.sd[j] )
a<-table.element(a,arr.range[j] )
a<-table.row.end(a)
}
a<-table.end(a)
table.save(a,file='mytable.tab')
a<-table.start()
a<-table.row.start(a)
a<-table.element(a,'Regression: S.E.(k) = alpha + beta * Mean(k)',2,TRUE)
a<-table.row.end(a)
a<-table.row.start(a)
a<-table.element(a,'alpha',header=TRUE)
a<-table.element(a,lm1$coefficients[[1]])
a<-table.row.end(a)
a<-table.row.start(a)
a<-table.element(a,'beta',header=TRUE)
a<-table.element(a,lm1$coefficients[[2]])
a<-table.row.end(a)
a<-table.row.start(a)
a<-table.element(a,'S.D.',header=TRUE)
a<-table.element(a,summary(lm1)$coefficients[2,2])
a<-table.row.end(a)
a<-table.row.start(a)
a<-table.element(a,'T-STAT',header=TRUE)
a<-table.element(a,summary(lm1)$coefficients[2,3])
a<-table.row.end(a)
a<-table.row.start(a)
a<-table.element(a,'p-value',header=TRUE)
a<-table.element(a,summary(lm1)$coefficients[2,4])
a<-table.row.end(a)
a<-table.end(a)
table.save(a,file='mytable1.tab')
a<-table.start()
a<-table.row.start(a)
a<-table.element(a,'Regression: ln S.E.(k) = alpha + beta * ln Mean(k)',2,TRUE)
a<-table.row.end(a)
a<-table.row.start(a)
a<-table.element(a,'alpha',header=TRUE)
a<-table.element(a,lnlm1$coefficients[[1]])
a<-table.row.end(a)
a<-table.row.start(a)
a<-table.element(a,'beta',header=TRUE)
a<-table.element(a,lnlm1$coefficients[[2]])
a<-table.row.end(a)
a<-table.row.start(a)
a<-table.element(a,'S.D.',header=TRUE)
a<-table.element(a,summary(lnlm1)$coefficients[2,2])
a<-table.row.end(a)
a<-table.row.start(a)
a<-table.element(a,'T-STAT',header=TRUE)
a<-table.element(a,summary(lnlm1)$coefficients[2,3])
a<-table.row.end(a)
a<-table.row.start(a)
a<-table.element(a,'p-value',header=TRUE)
a<-table.element(a,summary(lnlm1)$coefficients[2,4])
a<-table.row.end(a)
a<-table.row.start(a)
a<-table.element(a,'Lambda',header=TRUE)
a<-table.element(a,1-lnlm1$coefficients[[2]])
a<-table.row.end(a)
a<-table.end(a)
table.save(a,file='mytable2.tab')