Free Statistics

of Irreproducible Research!

Author's title

Author*The author of this computation has been verified*
R Software Modulerwasp_exponentialsmoothing.wasp
Title produced by softwareExponential Smoothing
Date of computationMon, 17 Nov 2014 15:23:45 +0000
Cite this page as followsStatistical Computations at FreeStatistics.org, Office for Research Development and Education, URL https://freestatistics.org/blog/index.php?v=date/2014/Nov/17/t1416237840b9qypaw5d4a0bvm.htm/, Retrieved Sun, 19 May 2024 13:06:01 +0000
Statistical Computations at FreeStatistics.org, Office for Research Development and Education, URL https://freestatistics.org/blog/index.php?pk=255542, Retrieved Sun, 19 May 2024 13:06:01 +0000
QR Codes:

Original text written by user:
IsPrivate?No (this computation is public)
User-defined keywords
Estimated Impact68
Family? (F = Feedback message, R = changed R code, M = changed R Module, P = changed Parameters, D = changed Data)
-       [Exponential Smoothing] [WS8 Triple ES Mul...] [2014-11-17 15:23:45] [8568a324fefbb8dbb43f697bfa8d1be6] [Current]
- RMPD    [Variance Reduction Matrix] [ex WS9 VRM] [2015-01-19 11:43:07] [bb1b6762b7e5624d262776d3f7139d34]
Feedback Forum

Post a new message
Dataseries X:
9700
9081
9084
9743
8587
9731
9563
9998
9437
10038
9918
9252
9737
9035
9133
9487
8700
9627
8947
9283
8829
9947
9628
9318
9605
8640
9214
9567
8547
9185
9470
9123
9278
10170
9434
9655
9429
8739
9552
9687
9019
9672
9206
9069
9788
10312
10105
9863
9656
9295
9946
9701
9049
10190
9706
9765
9893
9994
10433
10073
10112
9266
9820
10097
9115
10411
9678
10408
10153
10368
10581
10597
10680
9738
9556


Summary of computational transaction
Raw Inputview raw input (R code)
Raw Outputview raw output of R engine
Computing time2 seconds
R Server'Gwilym Jenkins' @ jenkins.wessa.net

\begin{tabular}{lllllllll}
\hline
Summary of computational transaction \tabularnewline
Raw Input & view raw input (R code)  \tabularnewline
Raw Output & view raw output of R engine  \tabularnewline
Computing time & 2 seconds \tabularnewline
R Server & 'Gwilym Jenkins' @ jenkins.wessa.net \tabularnewline
\hline
\end{tabular}
%Source: https://freestatistics.org/blog/index.php?pk=255542&T=0

[TABLE]
[ROW][C]Summary of computational transaction[/C][/ROW]
[ROW][C]Raw Input[/C][C]view raw input (R code) [/C][/ROW]
[ROW][C]Raw Output[/C][C]view raw output of R engine [/C][/ROW]
[ROW][C]Computing time[/C][C]2 seconds[/C][/ROW]
[ROW][C]R Server[/C][C]'Gwilym Jenkins' @ jenkins.wessa.net[/C][/ROW]
[/TABLE]
Source: https://freestatistics.org/blog/index.php?pk=255542&T=0

Globally Unique Identifier (entire table): ba.freestatistics.org/blog/index.php?pk=255542&T=0

As an alternative you can also use a QR Code:  

The GUIDs for individual cells are displayed in the table below:

Summary of computational transaction
Raw Inputview raw input (R code)
Raw Outputview raw output of R engine
Computing time2 seconds
R Server'Gwilym Jenkins' @ jenkins.wessa.net


Estimated Parameters of Exponential Smoothing
ParameterValue
alpha0.114796863292936
beta0.182276928582394
gamma0.552028524672773

\begin{tabular}{lllllllll}
\hline
Estimated Parameters of Exponential Smoothing \tabularnewline
Parameter & Value \tabularnewline
alpha & 0.114796863292936 \tabularnewline
beta & 0.182276928582394 \tabularnewline
gamma & 0.552028524672773 \tabularnewline
\hline
\end{tabular}
%Source: https://freestatistics.org/blog/index.php?pk=255542&T=1

[TABLE]
[ROW][C]Estimated Parameters of Exponential Smoothing[/C][/ROW]
[ROW][C]Parameter[/C][C]Value[/C][/ROW]
[ROW][C]alpha[/C][C]0.114796863292936[/C][/ROW]
[ROW][C]beta[/C][C]0.182276928582394[/C][/ROW]
[ROW][C]gamma[/C][C]0.552028524672773[/C][/ROW]
[/TABLE]
Source: https://freestatistics.org/blog/index.php?pk=255542&T=1

Globally Unique Identifier (entire table): ba.freestatistics.org/blog/index.php?pk=255542&T=1

As an alternative you can also use a QR Code:  

The GUIDs for individual cells are displayed in the table below:

Estimated Parameters of Exponential Smoothing
ParameterValue
alpha0.114796863292936
beta0.182276928582394
gamma0.552028524672773


Interpolation Forecasts of Exponential Smoothing
tObservedFittedResiduals
1397379769.78069418618-32.78069418618
1490359093.3159122712-58.3159122711986
1591339215.67915722151-82.6791572215079
1694879566.47569619419-79.4756961941857
1787008753.67194271987-53.6719427198695
1896279659.47888223266-32.4788822326555
1989479350.82964678621-403.829646786207
2092839688.29629327884-405.296293278836
2188299055.06877603077-226.068776030772
2299479559.30462729983387.695372700169
2396289450.02965530319177.970344696812
2493188795.73144048652522.268559513481
2596059305.11634736578299.88365263422
2686408683.02673796114-43.0267379611378
2792148790.39426331207423.60573668793
2895679199.17940146606367.820598533937
2985478492.3955164931354.6044835068715
3091859421.1486618584-236.148661858397
3194708937.60742375807532.392576241928
3291239416.3078076443-293.307807644303
3392788926.70135323989351.298646760113
34101709858.85165213619311.148347863807
3594349690.76166401146-256.761664011456
3696559191.43644317661463.56355682339
3794299633.91207253025-204.912072530245
3887398805.93614545582-66.936145455822
3995529174.25034311522377.749656884778
4096879587.1350139722399.8649860277656
4190198702.36240768321316.637592316785
4296729569.24247387682102.757526123181
4392069533.56534037577-327.565340375768
4490699529.10504386427-460.105043864271
4597889346.48317977979441.516820220213
461031210312.1941513744-0.194151374442299
47101059829.08633627086275.913663729136
4898639759.78481105421103.215188945791
4996569850.20625083601-194.206250836014
5092959079.62754158207215.372458417931
5199469740.26702859552205.732971404481
52970110023.4477783825-322.44777838246
5390499175.0465776563-126.046577656303
54101909906.03808870121283.961911298795
5597069673.3246607567532.6753392432493
5697659651.81359422262113.186405777382
57989310009.7694133303-116.769413330258
58999410733.3832933088-739.383293308791
591043310283.3685553046149.631444695371
601007310101.6100228711-28.6100228711475
611011210018.946343905893.0536560941728
6292669460.26384708021-194.263847080207
63982010070.9014032518-250.901403251813
641009710019.923130795377.0768692046659
6591159285.0604147163-170.060414716298
661041110212.2471978542198.752802145758
6796789823.76969802252-145.769698022521
68104089800.50024372824607.499756271756
691015310095.60733005157.3926699490221
701036810531.7503168092-163.750316809235
711058110587.9446430522-6.94464305221481
721059710296.1614075498300.838592450233
731068010317.9752465984362.024753401649
7497389641.778790418996.2212095810955
75955610297.3020308015-741.302030801517

\begin{tabular}{lllllllll}
\hline
Interpolation Forecasts of Exponential Smoothing \tabularnewline
t & Observed & Fitted & Residuals \tabularnewline
13 & 9737 & 9769.78069418618 & -32.78069418618 \tabularnewline
14 & 9035 & 9093.3159122712 & -58.3159122711986 \tabularnewline
15 & 9133 & 9215.67915722151 & -82.6791572215079 \tabularnewline
16 & 9487 & 9566.47569619419 & -79.4756961941857 \tabularnewline
17 & 8700 & 8753.67194271987 & -53.6719427198695 \tabularnewline
18 & 9627 & 9659.47888223266 & -32.4788822326555 \tabularnewline
19 & 8947 & 9350.82964678621 & -403.829646786207 \tabularnewline
20 & 9283 & 9688.29629327884 & -405.296293278836 \tabularnewline
21 & 8829 & 9055.06877603077 & -226.068776030772 \tabularnewline
22 & 9947 & 9559.30462729983 & 387.695372700169 \tabularnewline
23 & 9628 & 9450.02965530319 & 177.970344696812 \tabularnewline
24 & 9318 & 8795.73144048652 & 522.268559513481 \tabularnewline
25 & 9605 & 9305.11634736578 & 299.88365263422 \tabularnewline
26 & 8640 & 8683.02673796114 & -43.0267379611378 \tabularnewline
27 & 9214 & 8790.39426331207 & 423.60573668793 \tabularnewline
28 & 9567 & 9199.17940146606 & 367.820598533937 \tabularnewline
29 & 8547 & 8492.39551649313 & 54.6044835068715 \tabularnewline
30 & 9185 & 9421.1486618584 & -236.148661858397 \tabularnewline
31 & 9470 & 8937.60742375807 & 532.392576241928 \tabularnewline
32 & 9123 & 9416.3078076443 & -293.307807644303 \tabularnewline
33 & 9278 & 8926.70135323989 & 351.298646760113 \tabularnewline
34 & 10170 & 9858.85165213619 & 311.148347863807 \tabularnewline
35 & 9434 & 9690.76166401146 & -256.761664011456 \tabularnewline
36 & 9655 & 9191.43644317661 & 463.56355682339 \tabularnewline
37 & 9429 & 9633.91207253025 & -204.912072530245 \tabularnewline
38 & 8739 & 8805.93614545582 & -66.936145455822 \tabularnewline
39 & 9552 & 9174.25034311522 & 377.749656884778 \tabularnewline
40 & 9687 & 9587.13501397223 & 99.8649860277656 \tabularnewline
41 & 9019 & 8702.36240768321 & 316.637592316785 \tabularnewline
42 & 9672 & 9569.24247387682 & 102.757526123181 \tabularnewline
43 & 9206 & 9533.56534037577 & -327.565340375768 \tabularnewline
44 & 9069 & 9529.10504386427 & -460.105043864271 \tabularnewline
45 & 9788 & 9346.48317977979 & 441.516820220213 \tabularnewline
46 & 10312 & 10312.1941513744 & -0.194151374442299 \tabularnewline
47 & 10105 & 9829.08633627086 & 275.913663729136 \tabularnewline
48 & 9863 & 9759.78481105421 & 103.215188945791 \tabularnewline
49 & 9656 & 9850.20625083601 & -194.206250836014 \tabularnewline
50 & 9295 & 9079.62754158207 & 215.372458417931 \tabularnewline
51 & 9946 & 9740.26702859552 & 205.732971404481 \tabularnewline
52 & 9701 & 10023.4477783825 & -322.44777838246 \tabularnewline
53 & 9049 & 9175.0465776563 & -126.046577656303 \tabularnewline
54 & 10190 & 9906.03808870121 & 283.961911298795 \tabularnewline
55 & 9706 & 9673.32466075675 & 32.6753392432493 \tabularnewline
56 & 9765 & 9651.81359422262 & 113.186405777382 \tabularnewline
57 & 9893 & 10009.7694133303 & -116.769413330258 \tabularnewline
58 & 9994 & 10733.3832933088 & -739.383293308791 \tabularnewline
59 & 10433 & 10283.3685553046 & 149.631444695371 \tabularnewline
60 & 10073 & 10101.6100228711 & -28.6100228711475 \tabularnewline
61 & 10112 & 10018.9463439058 & 93.0536560941728 \tabularnewline
62 & 9266 & 9460.26384708021 & -194.263847080207 \tabularnewline
63 & 9820 & 10070.9014032518 & -250.901403251813 \tabularnewline
64 & 10097 & 10019.9231307953 & 77.0768692046659 \tabularnewline
65 & 9115 & 9285.0604147163 & -170.060414716298 \tabularnewline
66 & 10411 & 10212.2471978542 & 198.752802145758 \tabularnewline
67 & 9678 & 9823.76969802252 & -145.769698022521 \tabularnewline
68 & 10408 & 9800.50024372824 & 607.499756271756 \tabularnewline
69 & 10153 & 10095.607330051 & 57.3926699490221 \tabularnewline
70 & 10368 & 10531.7503168092 & -163.750316809235 \tabularnewline
71 & 10581 & 10587.9446430522 & -6.94464305221481 \tabularnewline
72 & 10597 & 10296.1614075498 & 300.838592450233 \tabularnewline
73 & 10680 & 10317.9752465984 & 362.024753401649 \tabularnewline
74 & 9738 & 9641.7787904189 & 96.2212095810955 \tabularnewline
75 & 9556 & 10297.3020308015 & -741.302030801517 \tabularnewline
\hline
\end{tabular}
%Source: https://freestatistics.org/blog/index.php?pk=255542&T=2

[TABLE]
[ROW][C]Interpolation Forecasts of Exponential Smoothing[/C][/ROW]
[ROW][C]t[/C][C]Observed[/C][C]Fitted[/C][C]Residuals[/C][/ROW]
[ROW][C]13[/C][C]9737[/C][C]9769.78069418618[/C][C]-32.78069418618[/C][/ROW]
[ROW][C]14[/C][C]9035[/C][C]9093.3159122712[/C][C]-58.3159122711986[/C][/ROW]
[ROW][C]15[/C][C]9133[/C][C]9215.67915722151[/C][C]-82.6791572215079[/C][/ROW]
[ROW][C]16[/C][C]9487[/C][C]9566.47569619419[/C][C]-79.4756961941857[/C][/ROW]
[ROW][C]17[/C][C]8700[/C][C]8753.67194271987[/C][C]-53.6719427198695[/C][/ROW]
[ROW][C]18[/C][C]9627[/C][C]9659.47888223266[/C][C]-32.4788822326555[/C][/ROW]
[ROW][C]19[/C][C]8947[/C][C]9350.82964678621[/C][C]-403.829646786207[/C][/ROW]
[ROW][C]20[/C][C]9283[/C][C]9688.29629327884[/C][C]-405.296293278836[/C][/ROW]
[ROW][C]21[/C][C]8829[/C][C]9055.06877603077[/C][C]-226.068776030772[/C][/ROW]
[ROW][C]22[/C][C]9947[/C][C]9559.30462729983[/C][C]387.695372700169[/C][/ROW]
[ROW][C]23[/C][C]9628[/C][C]9450.02965530319[/C][C]177.970344696812[/C][/ROW]
[ROW][C]24[/C][C]9318[/C][C]8795.73144048652[/C][C]522.268559513481[/C][/ROW]
[ROW][C]25[/C][C]9605[/C][C]9305.11634736578[/C][C]299.88365263422[/C][/ROW]
[ROW][C]26[/C][C]8640[/C][C]8683.02673796114[/C][C]-43.0267379611378[/C][/ROW]
[ROW][C]27[/C][C]9214[/C][C]8790.39426331207[/C][C]423.60573668793[/C][/ROW]
[ROW][C]28[/C][C]9567[/C][C]9199.17940146606[/C][C]367.820598533937[/C][/ROW]
[ROW][C]29[/C][C]8547[/C][C]8492.39551649313[/C][C]54.6044835068715[/C][/ROW]
[ROW][C]30[/C][C]9185[/C][C]9421.1486618584[/C][C]-236.148661858397[/C][/ROW]
[ROW][C]31[/C][C]9470[/C][C]8937.60742375807[/C][C]532.392576241928[/C][/ROW]
[ROW][C]32[/C][C]9123[/C][C]9416.3078076443[/C][C]-293.307807644303[/C][/ROW]
[ROW][C]33[/C][C]9278[/C][C]8926.70135323989[/C][C]351.298646760113[/C][/ROW]
[ROW][C]34[/C][C]10170[/C][C]9858.85165213619[/C][C]311.148347863807[/C][/ROW]
[ROW][C]35[/C][C]9434[/C][C]9690.76166401146[/C][C]-256.761664011456[/C][/ROW]
[ROW][C]36[/C][C]9655[/C][C]9191.43644317661[/C][C]463.56355682339[/C][/ROW]
[ROW][C]37[/C][C]9429[/C][C]9633.91207253025[/C][C]-204.912072530245[/C][/ROW]
[ROW][C]38[/C][C]8739[/C][C]8805.93614545582[/C][C]-66.936145455822[/C][/ROW]
[ROW][C]39[/C][C]9552[/C][C]9174.25034311522[/C][C]377.749656884778[/C][/ROW]
[ROW][C]40[/C][C]9687[/C][C]9587.13501397223[/C][C]99.8649860277656[/C][/ROW]
[ROW][C]41[/C][C]9019[/C][C]8702.36240768321[/C][C]316.637592316785[/C][/ROW]
[ROW][C]42[/C][C]9672[/C][C]9569.24247387682[/C][C]102.757526123181[/C][/ROW]
[ROW][C]43[/C][C]9206[/C][C]9533.56534037577[/C][C]-327.565340375768[/C][/ROW]
[ROW][C]44[/C][C]9069[/C][C]9529.10504386427[/C][C]-460.105043864271[/C][/ROW]
[ROW][C]45[/C][C]9788[/C][C]9346.48317977979[/C][C]441.516820220213[/C][/ROW]
[ROW][C]46[/C][C]10312[/C][C]10312.1941513744[/C][C]-0.194151374442299[/C][/ROW]
[ROW][C]47[/C][C]10105[/C][C]9829.08633627086[/C][C]275.913663729136[/C][/ROW]
[ROW][C]48[/C][C]9863[/C][C]9759.78481105421[/C][C]103.215188945791[/C][/ROW]
[ROW][C]49[/C][C]9656[/C][C]9850.20625083601[/C][C]-194.206250836014[/C][/ROW]
[ROW][C]50[/C][C]9295[/C][C]9079.62754158207[/C][C]215.372458417931[/C][/ROW]
[ROW][C]51[/C][C]9946[/C][C]9740.26702859552[/C][C]205.732971404481[/C][/ROW]
[ROW][C]52[/C][C]9701[/C][C]10023.4477783825[/C][C]-322.44777838246[/C][/ROW]
[ROW][C]53[/C][C]9049[/C][C]9175.0465776563[/C][C]-126.046577656303[/C][/ROW]
[ROW][C]54[/C][C]10190[/C][C]9906.03808870121[/C][C]283.961911298795[/C][/ROW]
[ROW][C]55[/C][C]9706[/C][C]9673.32466075675[/C][C]32.6753392432493[/C][/ROW]
[ROW][C]56[/C][C]9765[/C][C]9651.81359422262[/C][C]113.186405777382[/C][/ROW]
[ROW][C]57[/C][C]9893[/C][C]10009.7694133303[/C][C]-116.769413330258[/C][/ROW]
[ROW][C]58[/C][C]9994[/C][C]10733.3832933088[/C][C]-739.383293308791[/C][/ROW]
[ROW][C]59[/C][C]10433[/C][C]10283.3685553046[/C][C]149.631444695371[/C][/ROW]
[ROW][C]60[/C][C]10073[/C][C]10101.6100228711[/C][C]-28.6100228711475[/C][/ROW]
[ROW][C]61[/C][C]10112[/C][C]10018.9463439058[/C][C]93.0536560941728[/C][/ROW]
[ROW][C]62[/C][C]9266[/C][C]9460.26384708021[/C][C]-194.263847080207[/C][/ROW]
[ROW][C]63[/C][C]9820[/C][C]10070.9014032518[/C][C]-250.901403251813[/C][/ROW]
[ROW][C]64[/C][C]10097[/C][C]10019.9231307953[/C][C]77.0768692046659[/C][/ROW]
[ROW][C]65[/C][C]9115[/C][C]9285.0604147163[/C][C]-170.060414716298[/C][/ROW]
[ROW][C]66[/C][C]10411[/C][C]10212.2471978542[/C][C]198.752802145758[/C][/ROW]
[ROW][C]67[/C][C]9678[/C][C]9823.76969802252[/C][C]-145.769698022521[/C][/ROW]
[ROW][C]68[/C][C]10408[/C][C]9800.50024372824[/C][C]607.499756271756[/C][/ROW]
[ROW][C]69[/C][C]10153[/C][C]10095.607330051[/C][C]57.3926699490221[/C][/ROW]
[ROW][C]70[/C][C]10368[/C][C]10531.7503168092[/C][C]-163.750316809235[/C][/ROW]
[ROW][C]71[/C][C]10581[/C][C]10587.9446430522[/C][C]-6.94464305221481[/C][/ROW]
[ROW][C]72[/C][C]10597[/C][C]10296.1614075498[/C][C]300.838592450233[/C][/ROW]
[ROW][C]73[/C][C]10680[/C][C]10317.9752465984[/C][C]362.024753401649[/C][/ROW]
[ROW][C]74[/C][C]9738[/C][C]9641.7787904189[/C][C]96.2212095810955[/C][/ROW]
[ROW][C]75[/C][C]9556[/C][C]10297.3020308015[/C][C]-741.302030801517[/C][/ROW]
[/TABLE]
Source: https://freestatistics.org/blog/index.php?pk=255542&T=2

Globally Unique Identifier (entire table): ba.freestatistics.org/blog/index.php?pk=255542&T=2

As an alternative you can also use a QR Code:  

The GUIDs for individual cells are displayed in the table below:

Interpolation Forecasts of Exponential Smoothing
tObservedFittedResiduals
1397379769.78069418618-32.78069418618
1490359093.3159122712-58.3159122711986
1591339215.67915722151-82.6791572215079
1694879566.47569619419-79.4756961941857
1787008753.67194271987-53.6719427198695
1896279659.47888223266-32.4788822326555
1989479350.82964678621-403.829646786207
2092839688.29629327884-405.296293278836
2188299055.06877603077-226.068776030772
2299479559.30462729983387.695372700169
2396289450.02965530319177.970344696812
2493188795.73144048652522.268559513481
2596059305.11634736578299.88365263422
2686408683.02673796114-43.0267379611378
2792148790.39426331207423.60573668793
2895679199.17940146606367.820598533937
2985478492.3955164931354.6044835068715
3091859421.1486618584-236.148661858397
3194708937.60742375807532.392576241928
3291239416.3078076443-293.307807644303
3392788926.70135323989351.298646760113
34101709858.85165213619311.148347863807
3594349690.76166401146-256.761664011456
3696559191.43644317661463.56355682339
3794299633.91207253025-204.912072530245
3887398805.93614545582-66.936145455822
3995529174.25034311522377.749656884778
4096879587.1350139722399.8649860277656
4190198702.36240768321316.637592316785
4296729569.24247387682102.757526123181
4392069533.56534037577-327.565340375768
4490699529.10504386427-460.105043864271
4597889346.48317977979441.516820220213
461031210312.1941513744-0.194151374442299
47101059829.08633627086275.913663729136
4898639759.78481105421103.215188945791
4996569850.20625083601-194.206250836014
5092959079.62754158207215.372458417931
5199469740.26702859552205.732971404481
52970110023.4477783825-322.44777838246
5390499175.0465776563-126.046577656303
54101909906.03808870121283.961911298795
5597069673.3246607567532.6753392432493
5697659651.81359422262113.186405777382
57989310009.7694133303-116.769413330258
58999410733.3832933088-739.383293308791
591043310283.3685553046149.631444695371
601007310101.6100228711-28.6100228711475
611011210018.946343905893.0536560941728
6292669460.26384708021-194.263847080207
63982010070.9014032518-250.901403251813
641009710019.923130795377.0768692046659
6591159285.0604147163-170.060414716298
661041110212.2471978542198.752802145758
6796789823.76969802252-145.769698022521
68104089800.50024372824607.499756271756
691015310095.60733005157.3926699490221
701036810531.7503168092-163.750316809235
711058110587.9446430522-6.94464305221481
721059710296.1614075498300.838592450233
731068010317.9752465984362.024753401649
7497389641.778790418996.2212095810955
75955610297.3020308015-741.302030801517


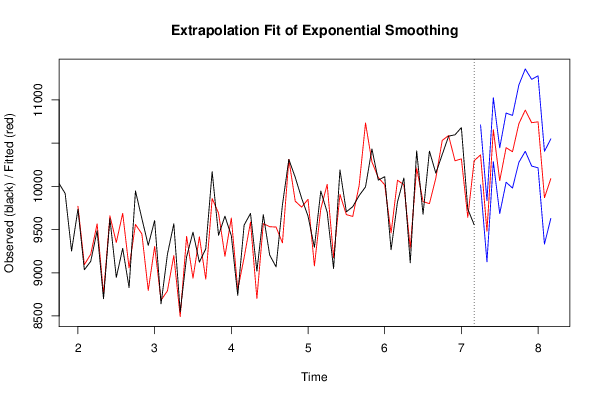
Extrapolation Forecasts of Exponential Smoothing
tForecast95% Lower Bound95% Upper Bound
7610363.853384032210016.40653497710711.3002330873
779480.821328243439126.125878540829835.51677794605
7810656.234050132410286.189003960811026.279096304
7910065.6011955249684.8360494003710446.3663416477
8010448.027721959810047.237088632410848.8183552872
8110400.77751784369980.7507614111510820.8042742761
8210726.795950173110279.026803161211174.565097185
8310882.225554975710405.527708573511358.9234013779
8410736.866235708710235.12818474511238.6042866723
8510746.975279381910214.563684926911279.386873837
869869.05669413289332.3479543363310405.7654339293
8710089.73322094549629.7716140685910549.6948278222

\begin{tabular}{lllllllll}
\hline
Extrapolation Forecasts of Exponential Smoothing \tabularnewline
t & Forecast & 95% Lower Bound & 95% Upper Bound \tabularnewline
76 & 10363.8533840322 & 10016.406534977 & 10711.3002330873 \tabularnewline
77 & 9480.82132824343 & 9126.12587854082 & 9835.51677794605 \tabularnewline
78 & 10656.2340501324 & 10286.1890039608 & 11026.279096304 \tabularnewline
79 & 10065.601195524 & 9684.83604940037 & 10446.3663416477 \tabularnewline
80 & 10448.0277219598 & 10047.2370886324 & 10848.8183552872 \tabularnewline
81 & 10400.7775178436 & 9980.75076141115 & 10820.8042742761 \tabularnewline
82 & 10726.7959501731 & 10279.0268031612 & 11174.565097185 \tabularnewline
83 & 10882.2255549757 & 10405.5277085735 & 11358.9234013779 \tabularnewline
84 & 10736.8662357087 & 10235.128184745 & 11238.6042866723 \tabularnewline
85 & 10746.9752793819 & 10214.5636849269 & 11279.386873837 \tabularnewline
86 & 9869.0566941328 & 9332.34795433633 & 10405.7654339293 \tabularnewline
87 & 10089.7332209454 & 9629.77161406859 & 10549.6948278222 \tabularnewline
\hline
\end{tabular}
%Source: https://freestatistics.org/blog/index.php?pk=255542&T=3

[TABLE]
[ROW][C]Extrapolation Forecasts of Exponential Smoothing[/C][/ROW]
[ROW][C]t[/C][C]Forecast[/C][C]95% Lower Bound[/C][C]95% Upper Bound[/C][/ROW]
[ROW][C]76[/C][C]10363.8533840322[/C][C]10016.406534977[/C][C]10711.3002330873[/C][/ROW]
[ROW][C]77[/C][C]9480.82132824343[/C][C]9126.12587854082[/C][C]9835.51677794605[/C][/ROW]
[ROW][C]78[/C][C]10656.2340501324[/C][C]10286.1890039608[/C][C]11026.279096304[/C][/ROW]
[ROW][C]79[/C][C]10065.601195524[/C][C]9684.83604940037[/C][C]10446.3663416477[/C][/ROW]
[ROW][C]80[/C][C]10448.0277219598[/C][C]10047.2370886324[/C][C]10848.8183552872[/C][/ROW]
[ROW][C]81[/C][C]10400.7775178436[/C][C]9980.75076141115[/C][C]10820.8042742761[/C][/ROW]
[ROW][C]82[/C][C]10726.7959501731[/C][C]10279.0268031612[/C][C]11174.565097185[/C][/ROW]
[ROW][C]83[/C][C]10882.2255549757[/C][C]10405.5277085735[/C][C]11358.9234013779[/C][/ROW]
[ROW][C]84[/C][C]10736.8662357087[/C][C]10235.128184745[/C][C]11238.6042866723[/C][/ROW]
[ROW][C]85[/C][C]10746.9752793819[/C][C]10214.5636849269[/C][C]11279.386873837[/C][/ROW]
[ROW][C]86[/C][C]9869.0566941328[/C][C]9332.34795433633[/C][C]10405.7654339293[/C][/ROW]
[ROW][C]87[/C][C]10089.7332209454[/C][C]9629.77161406859[/C][C]10549.6948278222[/C][/ROW]
[/TABLE]
Source: https://freestatistics.org/blog/index.php?pk=255542&T=3

Globally Unique Identifier (entire table): ba.freestatistics.org/blog/index.php?pk=255542&T=3

As an alternative you can also use a QR Code:  

The GUIDs for individual cells are displayed in the table below:

Extrapolation Forecasts of Exponential Smoothing
tForecast95% Lower Bound95% Upper Bound
7610363.853384032210016.40653497710711.3002330873
779480.821328243439126.125878540829835.51677794605
7810656.234050132410286.189003960811026.279096304
7910065.6011955249684.8360494003710446.3663416477
8010448.027721959810047.237088632410848.8183552872
8110400.77751784369980.7507614111510820.8042742761
8210726.795950173110279.026803161211174.565097185
8310882.225554975710405.527708573511358.9234013779
8410736.866235708710235.12818474511238.6042866723
8510746.975279381910214.563684926911279.386873837
869869.05669413289332.3479543363310405.7654339293
8710089.73322094549629.7716140685910549.6948278222


Parameters (Session):
par1 = 12 ; par2 = Triple ; par3 = multiplicative ;
Parameters (R input):
par1 = 12 ; par2 = Triple ; par3 = multiplicative ;
R code (references can be found in the software module):
par1 <- as.numeric(par1)
if (par2 == 'Single') K <- 1
if (par2 == 'Double') K <- 2
if (par2 == 'Triple') K <- par1
nx <- length(x)
nxmK <- nx - K
x <- ts(x, frequency = par1)
if (par2 == 'Single') fit <- HoltWinters(x, gamma=F, beta=F)
if (par2 == 'Double') fit <- HoltWinters(x, gamma=F)
if (par2 == 'Triple') fit <- HoltWinters(x, seasonal=par3)
fit
myresid <- x - fit$fitted[,'xhat']
bitmap(file='test1.png')
op <- par(mfrow=c(2,1))
plot(fit,ylab='Observed (black) / Fitted (red)',main='Interpolation Fit of Exponential Smoothing')
plot(myresid,ylab='Residuals',main='Interpolation Prediction Errors')
par(op)
dev.off()
bitmap(file='test2.png')
p <- predict(fit, par1, prediction.interval=TRUE)
np <- length(p[,1])
plot(fit,p,ylab='Observed (black) / Fitted (red)',main='Extrapolation Fit of Exponential Smoothing')
dev.off()
bitmap(file='test3.png')
op <- par(mfrow = c(2,2))
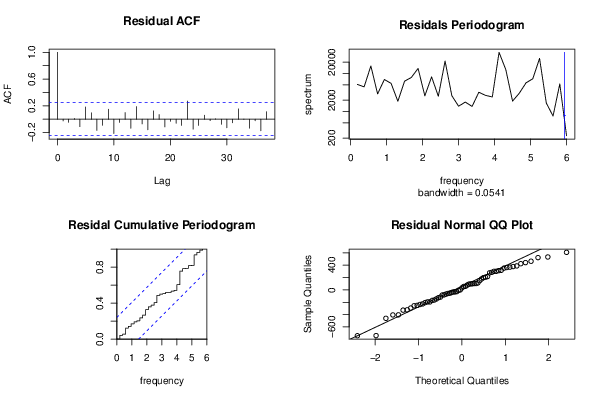
acf(as.numeric(myresid),lag.max = nx/2,main='Residual ACF')
spectrum(myresid,main='Residals Periodogram')
cpgram(myresid,main='Residal Cumulative Periodogram')
qqnorm(myresid,main='Residual Normal QQ Plot')
qqline(myresid)
par(op)
dev.off()
load(file='createtable')
a<-table.start()
a<-table.row.start(a)
a<-table.element(a,'Estimated Parameters of Exponential Smoothing',2,TRUE)
a<-table.row.end(a)
a<-table.row.start(a)
a<-table.element(a,'Parameter',header=TRUE)
a<-table.element(a,'Value',header=TRUE)
a<-table.row.end(a)
a<-table.row.start(a)
a<-table.element(a,'alpha',header=TRUE)
a<-table.element(a,fit$alpha)
a<-table.row.end(a)
a<-table.row.start(a)
a<-table.element(a,'beta',header=TRUE)
a<-table.element(a,fit$beta)
a<-table.row.end(a)
a<-table.row.start(a)
a<-table.element(a,'gamma',header=TRUE)
a<-table.element(a,fit$gamma)
a<-table.row.end(a)
a<-table.end(a)
table.save(a,file='mytable.tab')
a<-table.start()
a<-table.row.start(a)
a<-table.element(a,'Interpolation Forecasts of Exponential Smoothing',4,TRUE)
a<-table.row.end(a)
a<-table.row.start(a)
a<-table.element(a,'t',header=TRUE)
a<-table.element(a,'Observed',header=TRUE)
a<-table.element(a,'Fitted',header=TRUE)
a<-table.element(a,'Residuals',header=TRUE)
a<-table.row.end(a)
for (i in 1:nxmK) {
a<-table.row.start(a)
a<-table.element(a,i+K,header=TRUE)
a<-table.element(a,x[i+K])
a<-table.element(a,fit$fitted[i,'xhat'])
a<-table.element(a,myresid[i])
a<-table.row.end(a)
}
a<-table.end(a)
table.save(a,file='mytable1.tab')
a<-table.start()
a<-table.row.start(a)
a<-table.element(a,'Extrapolation Forecasts of Exponential Smoothing',4,TRUE)
a<-table.row.end(a)
a<-table.row.start(a)
a<-table.element(a,'t',header=TRUE)
a<-table.element(a,'Forecast',header=TRUE)
a<-table.element(a,'95% Lower Bound',header=TRUE)
a<-table.element(a,'95% Upper Bound',header=TRUE)
a<-table.row.end(a)
for (i in 1:np) {
a<-table.row.start(a)
a<-table.element(a,nx+i,header=TRUE)
a<-table.element(a,p[i,'fit'])
a<-table.element(a,p[i,'lwr'])
a<-table.element(a,p[i,'upr'])
a<-table.row.end(a)
}
a<-table.end(a)
table.save(a,file='mytable2.tab')