Free Statistics

of Irreproducible Research!

Author's title

Author*Unverified author*
R Software Modulerwasp_bootstrapplot.wasp
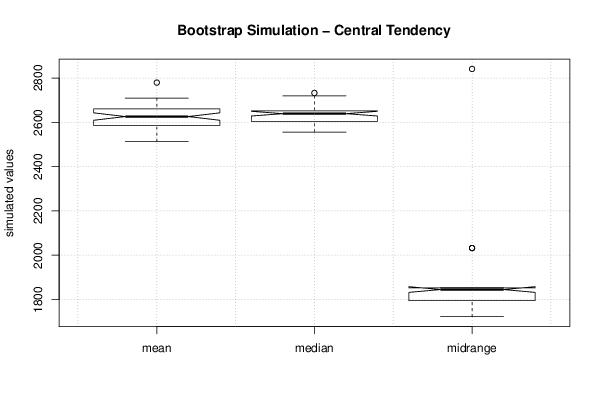
Title produced by softwareBlocked Bootstrap Plot - Central Tendency
Date of computationSun, 16 Nov 2014 22:19:54 +0000
Cite this page as followsStatistical Computations at FreeStatistics.org, Office for Research Development and Education, URL https://freestatistics.org/blog/index.php?v=date/2014/Nov/16/t1416176443bcqzhv6ex1tci29.htm/, Retrieved Sun, 19 May 2024 20:23:33 +0000
Statistical Computations at FreeStatistics.org, Office for Research Development and Education, URL https://freestatistics.org/blog/index.php?pk=255359, Retrieved Sun, 19 May 2024 20:23:33 +0000
QR Codes:

Original text written by user:
IsPrivate?No (this computation is public)
User-defined keywords
Estimated Impact150
Family? (F = Feedback message, R = changed R code, M = changed R Module, P = changed Parameters, D = changed Data)
-       [Blocked Bootstrap Plot - Central Tendency] [] [2014-11-16 22:19:54] [01b6e20344b68835c5ed1ddedf20d531] [Current]
Feedback Forum

Post a new message
Dataseries X:
411
2930
2773
2785
2789
2815
3034
3089
3035
3061
2951
2891
2817
2793
2805
2757
2786
2773
2609
2653
2537
2727
2558
2585
2558
2574
2561
2639
2450
2422
2559
2372
2359
2548
2534
2370
2540
2474
2390
2640
2523
2681
2666
2522
2646
2691
2729
2727
2731
2772
2911
2860
3003
397
2550
3038
3011
3082
3192
3143
3033
3211
3170
3293
3039
3038
3067
2974
3059
2859
2727
2560
2652
2571
2499
2601
2577
2498
2539
2493
2533
2461
2488
2724
2486
2389
2442
2402
2436
2477
2311
2498
2369
2576
2604
2543
2679
2469
2503
2571
2565
2743
2598
2590
2787
2753
772
1992
2816
2739
2708
2708
2853
2794
2750
2713
2762
2769
2660
2691
2705
2591
2608
2610
2527
2616
2618
2555
2505
2492
2428
2439
2477
2650
2560
2803
2641
2483
2520
2406
2454
2629


Summary of computational transaction
Raw Inputview raw input (R code)
Raw Outputview raw output of R engine
Computing time4 seconds
R Server'Sir Ronald Aylmer Fisher' @ fisher.wessa.net

\begin{tabular}{lllllllll}
\hline
Summary of computational transaction \tabularnewline
Raw Input & view raw input (R code)  \tabularnewline
Raw Output & view raw output of R engine  \tabularnewline
Computing time & 4 seconds \tabularnewline
R Server & 'Sir Ronald Aylmer Fisher' @ fisher.wessa.net \tabularnewline
\hline
\end{tabular}
%Source: https://freestatistics.org/blog/index.php?pk=255359&T=0

[TABLE]
[ROW][C]Summary of computational transaction[/C][/ROW]
[ROW][C]Raw Input[/C][C]view raw input (R code) [/C][/ROW]
[ROW][C]Raw Output[/C][C]view raw output of R engine [/C][/ROW]
[ROW][C]Computing time[/C][C]4 seconds[/C][/ROW]
[ROW][C]R Server[/C][C]'Sir Ronald Aylmer Fisher' @ fisher.wessa.net[/C][/ROW]
[/TABLE]
Source: https://freestatistics.org/blog/index.php?pk=255359&T=0

Globally Unique Identifier (entire table): ba.freestatistics.org/blog/index.php?pk=255359&T=0

As an alternative you can also use a QR Code:  

The GUIDs for individual cells are displayed in the table below:

Summary of computational transaction
Raw Inputview raw input (R code)
Raw Outputview raw output of R engine
Computing time4 seconds
R Server'Sir Ronald Aylmer Fisher' @ fisher.wessa.net


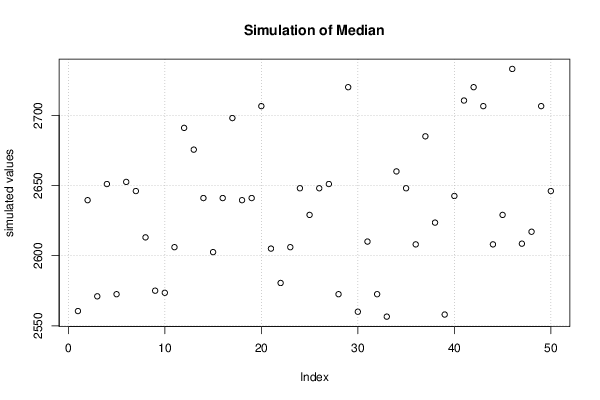
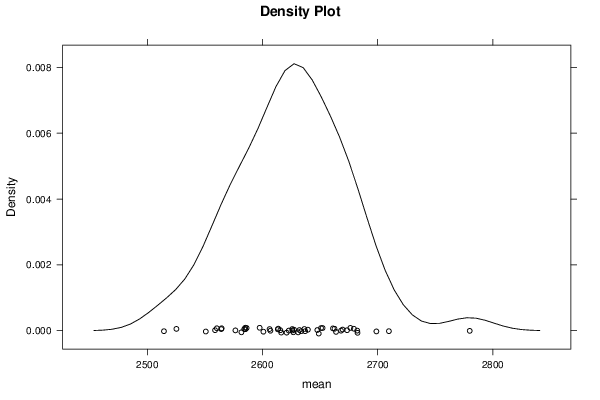
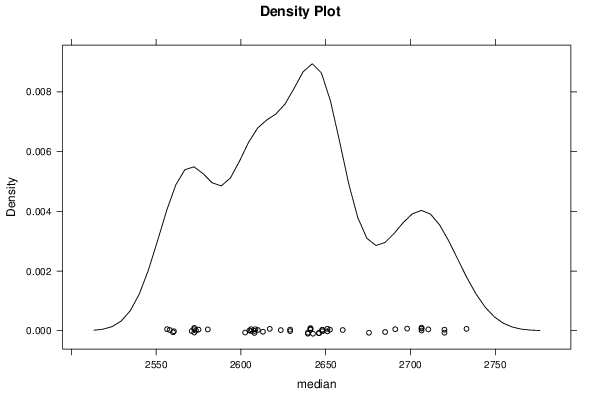
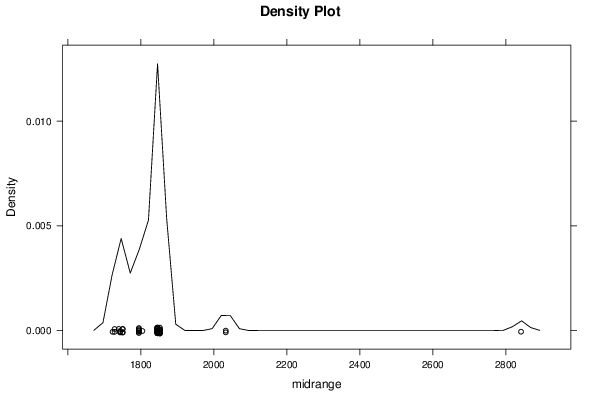
Estimation Results of Blocked Bootstrap
statisticQ1EstimateQ3S.D.IQR
mean2589.042253521132629.084507042252658.9313380281749.278957570828169.8890845070423
median2605.252623.52652.12548.541996334753946.875
midrange1794.518451850.25156.75080834996555.75

\begin{tabular}{lllllllll}
\hline
Estimation Results of Blocked Bootstrap \tabularnewline
statistic & Q1 & Estimate & Q3 & S.D. & IQR \tabularnewline
mean & 2589.04225352113 & 2629.08450704225 & 2658.93133802817 & 49.2789575708281 & 69.8890845070423 \tabularnewline
median & 2605.25 & 2623.5 & 2652.125 & 48.5419963347539 & 46.875 \tabularnewline
midrange & 1794.5 & 1845 & 1850.25 & 156.750808349965 & 55.75 \tabularnewline
\hline
\end{tabular}
%Source: https://freestatistics.org/blog/index.php?pk=255359&T=1

[TABLE]
[ROW][C]Estimation Results of Blocked Bootstrap[/C][/ROW]
[ROW][C]statistic[/C][C]Q1[/C][C]Estimate[/C][C]Q3[/C][C]S.D.[/C][C]IQR[/C][/ROW]
[ROW][C]mean[/C][C]2589.04225352113[/C][C]2629.08450704225[/C][C]2658.93133802817[/C][C]49.2789575708281[/C][C]69.8890845070423[/C][/ROW]
[ROW][C]median[/C][C]2605.25[/C][C]2623.5[/C][C]2652.125[/C][C]48.5419963347539[/C][C]46.875[/C][/ROW]
[ROW][C]midrange[/C][C]1794.5[/C][C]1845[/C][C]1850.25[/C][C]156.750808349965[/C][C]55.75[/C][/ROW]
[/TABLE]
Source: https://freestatistics.org/blog/index.php?pk=255359&T=1

Globally Unique Identifier (entire table): ba.freestatistics.org/blog/index.php?pk=255359&T=1

As an alternative you can also use a QR Code:  

The GUIDs for individual cells are displayed in the table below:

Estimation Results of Blocked Bootstrap
statisticQ1EstimateQ3S.D.IQR
mean2589.042253521132629.084507042252658.9313380281749.278957570828169.8890845070423
median2605.252623.52652.12548.541996334753946.875
midrange1794.518451850.25156.75080834996555.75


Parameters (Session):
par1 = 50 ; par2 = 12 ;
Parameters (R input):
par1 = 50 ; par2 = 12 ;
R code (references can be found in the software module):
par1 <- as.numeric(par1)
par2 <- as.numeric(par2)
if (par1 < 10) par1 = 10
if (par1 > 5000) par1 = 5000
if (par2 < 3) par2 = 3
if (par2 > length(x)) par2 = length(x)
library(lattice)
library(boot)
boot.stat <- function(s)
{
s.mean <- mean(s)
s.median <- median(s)
s.midrange <- (max(s) + min(s)) / 2
c(s.mean, s.median, s.midrange)
}
(r <- tsboot(x, boot.stat, R=par1, l=12, sim='fixed'))
bitmap(file='plot1.png')
plot(r$t[,1],type='p',ylab='simulated values',main='Simulation of Mean')
grid()
dev.off()
bitmap(file='plot2.png')
plot(r$t[,2],type='p',ylab='simulated values',main='Simulation of Median')
grid()
dev.off()
bitmap(file='plot3.png')
plot(r$t[,3],type='p',ylab='simulated values',main='Simulation of Midrange')
grid()
dev.off()
bitmap(file='plot4.png')
densityplot(~r$t[,1],col='black',main='Density Plot',xlab='mean')
dev.off()
bitmap(file='plot5.png')
densityplot(~r$t[,2],col='black',main='Density Plot',xlab='median')
dev.off()
bitmap(file='plot6.png')
densityplot(~r$t[,3],col='black',main='Density Plot',xlab='midrange')
dev.off()
z <- data.frame(cbind(r$t[,1],r$t[,2],r$t[,3]))
colnames(z) <- list('mean','median','midrange')
bitmap(file='plot7.png')
boxplot(z,notch=TRUE,ylab='simulated values',main='Bootstrap Simulation - Central Tendency')
grid()
dev.off()
load(file='createtable')
a<-table.start()
a<-table.row.start(a)
a<-table.element(a,'Estimation Results of Blocked Bootstrap',6,TRUE)
a<-table.row.end(a)
a<-table.row.start(a)
a<-table.element(a,'statistic',header=TRUE)
a<-table.element(a,'Q1',header=TRUE)
a<-table.element(a,'Estimate',header=TRUE)
a<-table.element(a,'Q3',header=TRUE)
a<-table.element(a,'S.D.',header=TRUE)
a<-table.element(a,'IQR',header=TRUE)
a<-table.row.end(a)
a<-table.row.start(a)
a<-table.element(a,'mean',header=TRUE)
q1 <- quantile(r$t[,1],0.25)[[1]]
q3 <- quantile(r$t[,1],0.75)[[1]]
a<-table.element(a,q1)
a<-table.element(a,r$t0[1])
a<-table.element(a,q3)
a<-table.element(a,sqrt(var(r$t[,1])))
a<-table.element(a,q3-q1)
a<-table.row.end(a)
a<-table.row.start(a)
a<-table.element(a,'median',header=TRUE)
q1 <- quantile(r$t[,2],0.25)[[1]]
q3 <- quantile(r$t[,2],0.75)[[1]]
a<-table.element(a,q1)
a<-table.element(a,r$t0[2])
a<-table.element(a,q3)
a<-table.element(a,sqrt(var(r$t[,2])))
a<-table.element(a,q3-q1)
a<-table.row.end(a)
a<-table.row.start(a)
a<-table.element(a,'midrange',header=TRUE)
q1 <- quantile(r$t[,3],0.25)[[1]]
q3 <- quantile(r$t[,3],0.75)[[1]]
a<-table.element(a,q1)
a<-table.element(a,r$t0[3])
a<-table.element(a,q3)
a<-table.element(a,sqrt(var(r$t[,3])))
a<-table.element(a,q3-q1)
a<-table.row.end(a)
a<-table.end(a)
table.save(a,file='mytable.tab')