Free Statistics

of Irreproducible Research!

Author's title

Author*Unverified author*
R Software Modulerwasp_autocorrelation.wasp
Title produced by software(Partial) Autocorrelation Function
Date of computationSat, 15 Nov 2014 14:56:19 +0000
Cite this page as followsStatistical Computations at FreeStatistics.org, Office for Research Development and Education, URL https://freestatistics.org/blog/index.php?v=date/2014/Nov/15/t1416063426akdokj7nl1fpalx.htm/, Retrieved Sun, 19 May 2024 14:39:38 +0000
Statistical Computations at FreeStatistics.org, Office for Research Development and Education, URL https://freestatistics.org/blog/index.php?pk=254983, Retrieved Sun, 19 May 2024 14:39:38 +0000
QR Codes:

Original text written by user:
IsPrivate?No (this computation is public)
User-defined keywords
Estimated Impact65
Family? (F = Feedback message, R = changed R code, M = changed R Module, P = changed Parameters, D = changed Data)
-       [(Partial) Autocorrelation Function] [opdracht 7 oef 2 ...] [2014-11-15 14:56:19] [6100e5aa5cdb51a951984168d031078f] [Current]
Feedback Forum

Post a new message
Dataseries X:
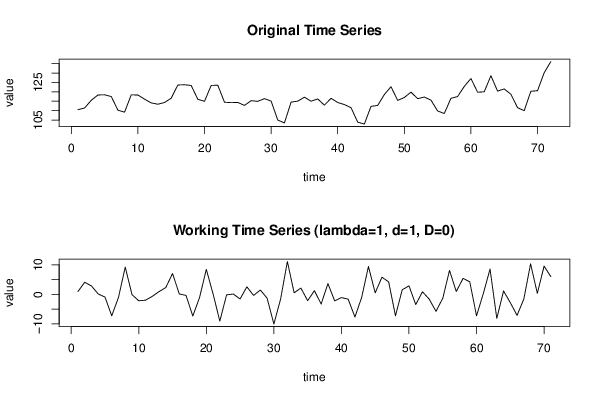
110.48
111.41
115.5
118.32
118.42
117.5
110.23
109.19
118.41
118.3
116.1
114.11
113.41
114.33
116.61
123.64
123.77
123.39
116.03
114.95
123.4
123.53
114.45
114.26
114.35
112.77
115.31
114.93
116.38
115.07
105
103.43
114.52
115.04
117.16
115
116.22
112.92
116.56
114.32
113.22
111.56
103.87
102.85
112.27
112.76
118.55
122.73
115.44
116.97
119.84
116.37
117.23
115.58
109.82
108.46
116.54
117.49
122.87
127.1
119.81
120.03
128.58
120.4
121.54
118.71
111.57
109.97
120.29
120.61
130.15
136.12


Summary of computational transaction
Raw Inputview raw input (R code)
Raw Outputview raw output of R engine
Computing time2 seconds
R Server'Herman Ole Andreas Wold' @ wold.wessa.net

\begin{tabular}{lllllllll}
\hline
Summary of computational transaction \tabularnewline
Raw Input & view raw input (R code)  \tabularnewline
Raw Output & view raw output of R engine  \tabularnewline
Computing time & 2 seconds \tabularnewline
R Server & 'Herman Ole Andreas Wold' @ wold.wessa.net \tabularnewline
\hline
\end{tabular}
%Source: https://freestatistics.org/blog/index.php?pk=254983&T=0

[TABLE]
[ROW][C]Summary of computational transaction[/C][/ROW]
[ROW][C]Raw Input[/C][C]view raw input (R code) [/C][/ROW]
[ROW][C]Raw Output[/C][C]view raw output of R engine [/C][/ROW]
[ROW][C]Computing time[/C][C]2 seconds[/C][/ROW]
[ROW][C]R Server[/C][C]'Herman Ole Andreas Wold' @ wold.wessa.net[/C][/ROW]
[/TABLE]
Source: https://freestatistics.org/blog/index.php?pk=254983&T=0

Globally Unique Identifier (entire table): ba.freestatistics.org/blog/index.php?pk=254983&T=0

As an alternative you can also use a QR Code:  

The GUIDs for individual cells are displayed in the table below:

Summary of computational transaction
Raw Inputview raw input (R code)
Raw Outputview raw output of R engine
Computing time2 seconds
R Server'Herman Ole Andreas Wold' @ wold.wessa.net


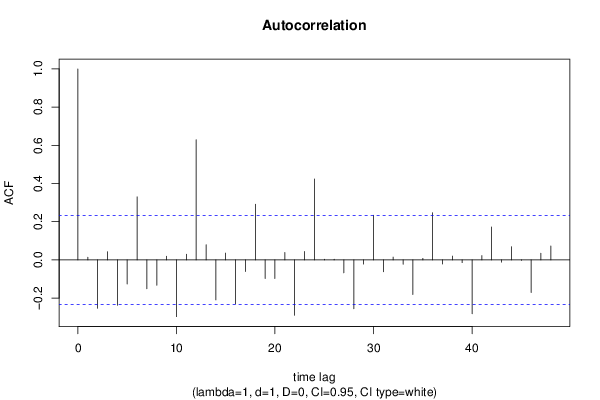
Autocorrelation Function
Time lag kACF(k)T-STATP-value
10.013480.11360.454945
2-0.253131-2.13290.018195
30.0430650.36290.358888
4-0.237864-2.00430.024428
5-0.126282-1.06410.145452
60.3300932.78140.003463
7-0.151064-1.27290.103605
8-0.133031-1.12090.133046
90.0191580.16140.436107
10-0.297353-2.50550.007261
110.0297290.25050.401463
120.6288725.2991e-06
130.0791060.66660.253607
14-0.209534-1.76560.040884
150.035330.29770.383402
16-0.23057-1.94280.028002
17-0.06097-0.51370.304514
180.2914352.45570.008256
19-0.097853-0.82450.206202
20-0.097272-0.81960.207586
210.0383880.32350.373649
22-0.29046-2.44750.008431
230.04430.37330.355027
240.4241313.57380.000319
250.0036950.03110.487624
260.0030980.02610.489624
27-0.067924-0.57230.284452
28-0.256405-2.16050.017055
29-0.022113-0.18630.426359
300.2338951.97080.026321
31-0.061812-0.52080.30205
320.0145160.12230.451498
33-0.02313-0.19490.423016
34-0.181814-1.5320.064984
350.0078360.0660.47377
360.2470672.08180.020482
37-0.0216-0.1820.42805
380.0195640.16480.434766
39-0.01441-0.12140.451851
40-0.28212-2.37720.010071
410.0221890.1870.426109
420.1726531.45480.075066
43-0.011691-0.09850.460903
440.0688030.57970.281961
45-0.002704-0.02280.490944
46-0.17056-1.43720.077532
470.0347780.2930.385172
480.0728830.61410.270547

\begin{tabular}{lllllllll}
\hline
Autocorrelation Function \tabularnewline
Time lag k & ACF(k) & T-STAT & P-value \tabularnewline
1 & 0.01348 & 0.1136 & 0.454945 \tabularnewline
2 & -0.253131 & -2.1329 & 0.018195 \tabularnewline
3 & 0.043065 & 0.3629 & 0.358888 \tabularnewline
4 & -0.237864 & -2.0043 & 0.024428 \tabularnewline
5 & -0.126282 & -1.0641 & 0.145452 \tabularnewline
6 & 0.330093 & 2.7814 & 0.003463 \tabularnewline
7 & -0.151064 & -1.2729 & 0.103605 \tabularnewline
8 & -0.133031 & -1.1209 & 0.133046 \tabularnewline
9 & 0.019158 & 0.1614 & 0.436107 \tabularnewline
10 & -0.297353 & -2.5055 & 0.007261 \tabularnewline
11 & 0.029729 & 0.2505 & 0.401463 \tabularnewline
12 & 0.628872 & 5.299 & 1e-06 \tabularnewline
13 & 0.079106 & 0.6666 & 0.253607 \tabularnewline
14 & -0.209534 & -1.7656 & 0.040884 \tabularnewline
15 & 0.03533 & 0.2977 & 0.383402 \tabularnewline
16 & -0.23057 & -1.9428 & 0.028002 \tabularnewline
17 & -0.06097 & -0.5137 & 0.304514 \tabularnewline
18 & 0.291435 & 2.4557 & 0.008256 \tabularnewline
19 & -0.097853 & -0.8245 & 0.206202 \tabularnewline
20 & -0.097272 & -0.8196 & 0.207586 \tabularnewline
21 & 0.038388 & 0.3235 & 0.373649 \tabularnewline
22 & -0.29046 & -2.4475 & 0.008431 \tabularnewline
23 & 0.0443 & 0.3733 & 0.355027 \tabularnewline
24 & 0.424131 & 3.5738 & 0.000319 \tabularnewline
25 & 0.003695 & 0.0311 & 0.487624 \tabularnewline
26 & 0.003098 & 0.0261 & 0.489624 \tabularnewline
27 & -0.067924 & -0.5723 & 0.284452 \tabularnewline
28 & -0.256405 & -2.1605 & 0.017055 \tabularnewline
29 & -0.022113 & -0.1863 & 0.426359 \tabularnewline
30 & 0.233895 & 1.9708 & 0.026321 \tabularnewline
31 & -0.061812 & -0.5208 & 0.30205 \tabularnewline
32 & 0.014516 & 0.1223 & 0.451498 \tabularnewline
33 & -0.02313 & -0.1949 & 0.423016 \tabularnewline
34 & -0.181814 & -1.532 & 0.064984 \tabularnewline
35 & 0.007836 & 0.066 & 0.47377 \tabularnewline
36 & 0.247067 & 2.0818 & 0.020482 \tabularnewline
37 & -0.0216 & -0.182 & 0.42805 \tabularnewline
38 & 0.019564 & 0.1648 & 0.434766 \tabularnewline
39 & -0.01441 & -0.1214 & 0.451851 \tabularnewline
40 & -0.28212 & -2.3772 & 0.010071 \tabularnewline
41 & 0.022189 & 0.187 & 0.426109 \tabularnewline
42 & 0.172653 & 1.4548 & 0.075066 \tabularnewline
43 & -0.011691 & -0.0985 & 0.460903 \tabularnewline
44 & 0.068803 & 0.5797 & 0.281961 \tabularnewline
45 & -0.002704 & -0.0228 & 0.490944 \tabularnewline
46 & -0.17056 & -1.4372 & 0.077532 \tabularnewline
47 & 0.034778 & 0.293 & 0.385172 \tabularnewline
48 & 0.072883 & 0.6141 & 0.270547 \tabularnewline
\hline
\end{tabular}
%Source: https://freestatistics.org/blog/index.php?pk=254983&T=1

[TABLE]
[ROW][C]Autocorrelation Function[/C][/ROW]
[ROW][C]Time lag k[/C][C]ACF(k)[/C][C]T-STAT[/C][C]P-value[/C][/ROW]
[ROW][C]1[/C][C]0.01348[/C][C]0.1136[/C][C]0.454945[/C][/ROW]
[ROW][C]2[/C][C]-0.253131[/C][C]-2.1329[/C][C]0.018195[/C][/ROW]
[ROW][C]3[/C][C]0.043065[/C][C]0.3629[/C][C]0.358888[/C][/ROW]
[ROW][C]4[/C][C]-0.237864[/C][C]-2.0043[/C][C]0.024428[/C][/ROW]
[ROW][C]5[/C][C]-0.126282[/C][C]-1.0641[/C][C]0.145452[/C][/ROW]
[ROW][C]6[/C][C]0.330093[/C][C]2.7814[/C][C]0.003463[/C][/ROW]
[ROW][C]7[/C][C]-0.151064[/C][C]-1.2729[/C][C]0.103605[/C][/ROW]
[ROW][C]8[/C][C]-0.133031[/C][C]-1.1209[/C][C]0.133046[/C][/ROW]
[ROW][C]9[/C][C]0.019158[/C][C]0.1614[/C][C]0.436107[/C][/ROW]
[ROW][C]10[/C][C]-0.297353[/C][C]-2.5055[/C][C]0.007261[/C][/ROW]
[ROW][C]11[/C][C]0.029729[/C][C]0.2505[/C][C]0.401463[/C][/ROW]
[ROW][C]12[/C][C]0.628872[/C][C]5.299[/C][C]1e-06[/C][/ROW]
[ROW][C]13[/C][C]0.079106[/C][C]0.6666[/C][C]0.253607[/C][/ROW]
[ROW][C]14[/C][C]-0.209534[/C][C]-1.7656[/C][C]0.040884[/C][/ROW]
[ROW][C]15[/C][C]0.03533[/C][C]0.2977[/C][C]0.383402[/C][/ROW]
[ROW][C]16[/C][C]-0.23057[/C][C]-1.9428[/C][C]0.028002[/C][/ROW]
[ROW][C]17[/C][C]-0.06097[/C][C]-0.5137[/C][C]0.304514[/C][/ROW]
[ROW][C]18[/C][C]0.291435[/C][C]2.4557[/C][C]0.008256[/C][/ROW]
[ROW][C]19[/C][C]-0.097853[/C][C]-0.8245[/C][C]0.206202[/C][/ROW]
[ROW][C]20[/C][C]-0.097272[/C][C]-0.8196[/C][C]0.207586[/C][/ROW]
[ROW][C]21[/C][C]0.038388[/C][C]0.3235[/C][C]0.373649[/C][/ROW]
[ROW][C]22[/C][C]-0.29046[/C][C]-2.4475[/C][C]0.008431[/C][/ROW]
[ROW][C]23[/C][C]0.0443[/C][C]0.3733[/C][C]0.355027[/C][/ROW]
[ROW][C]24[/C][C]0.424131[/C][C]3.5738[/C][C]0.000319[/C][/ROW]
[ROW][C]25[/C][C]0.003695[/C][C]0.0311[/C][C]0.487624[/C][/ROW]
[ROW][C]26[/C][C]0.003098[/C][C]0.0261[/C][C]0.489624[/C][/ROW]
[ROW][C]27[/C][C]-0.067924[/C][C]-0.5723[/C][C]0.284452[/C][/ROW]
[ROW][C]28[/C][C]-0.256405[/C][C]-2.1605[/C][C]0.017055[/C][/ROW]
[ROW][C]29[/C][C]-0.022113[/C][C]-0.1863[/C][C]0.426359[/C][/ROW]
[ROW][C]30[/C][C]0.233895[/C][C]1.9708[/C][C]0.026321[/C][/ROW]
[ROW][C]31[/C][C]-0.061812[/C][C]-0.5208[/C][C]0.30205[/C][/ROW]
[ROW][C]32[/C][C]0.014516[/C][C]0.1223[/C][C]0.451498[/C][/ROW]
[ROW][C]33[/C][C]-0.02313[/C][C]-0.1949[/C][C]0.423016[/C][/ROW]
[ROW][C]34[/C][C]-0.181814[/C][C]-1.532[/C][C]0.064984[/C][/ROW]
[ROW][C]35[/C][C]0.007836[/C][C]0.066[/C][C]0.47377[/C][/ROW]
[ROW][C]36[/C][C]0.247067[/C][C]2.0818[/C][C]0.020482[/C][/ROW]
[ROW][C]37[/C][C]-0.0216[/C][C]-0.182[/C][C]0.42805[/C][/ROW]
[ROW][C]38[/C][C]0.019564[/C][C]0.1648[/C][C]0.434766[/C][/ROW]
[ROW][C]39[/C][C]-0.01441[/C][C]-0.1214[/C][C]0.451851[/C][/ROW]
[ROW][C]40[/C][C]-0.28212[/C][C]-2.3772[/C][C]0.010071[/C][/ROW]
[ROW][C]41[/C][C]0.022189[/C][C]0.187[/C][C]0.426109[/C][/ROW]
[ROW][C]42[/C][C]0.172653[/C][C]1.4548[/C][C]0.075066[/C][/ROW]
[ROW][C]43[/C][C]-0.011691[/C][C]-0.0985[/C][C]0.460903[/C][/ROW]
[ROW][C]44[/C][C]0.068803[/C][C]0.5797[/C][C]0.281961[/C][/ROW]
[ROW][C]45[/C][C]-0.002704[/C][C]-0.0228[/C][C]0.490944[/C][/ROW]
[ROW][C]46[/C][C]-0.17056[/C][C]-1.4372[/C][C]0.077532[/C][/ROW]
[ROW][C]47[/C][C]0.034778[/C][C]0.293[/C][C]0.385172[/C][/ROW]
[ROW][C]48[/C][C]0.072883[/C][C]0.6141[/C][C]0.270547[/C][/ROW]
[/TABLE]
Source: https://freestatistics.org/blog/index.php?pk=254983&T=1

Globally Unique Identifier (entire table): ba.freestatistics.org/blog/index.php?pk=254983&T=1

As an alternative you can also use a QR Code:  

The GUIDs for individual cells are displayed in the table below:

Autocorrelation Function
Time lag kACF(k)T-STATP-value
10.013480.11360.454945
2-0.253131-2.13290.018195
30.0430650.36290.358888
4-0.237864-2.00430.024428
5-0.126282-1.06410.145452
60.3300932.78140.003463
7-0.151064-1.27290.103605
8-0.133031-1.12090.133046
90.0191580.16140.436107
10-0.297353-2.50550.007261
110.0297290.25050.401463
120.6288725.2991e-06
130.0791060.66660.253607
14-0.209534-1.76560.040884
150.035330.29770.383402
16-0.23057-1.94280.028002
17-0.06097-0.51370.304514
180.2914352.45570.008256
19-0.097853-0.82450.206202
20-0.097272-0.81960.207586
210.0383880.32350.373649
22-0.29046-2.44750.008431
230.04430.37330.355027
240.4241313.57380.000319
250.0036950.03110.487624
260.0030980.02610.489624
27-0.067924-0.57230.284452
28-0.256405-2.16050.017055
29-0.022113-0.18630.426359
300.2338951.97080.026321
31-0.061812-0.52080.30205
320.0145160.12230.451498
33-0.02313-0.19490.423016
34-0.181814-1.5320.064984
350.0078360.0660.47377
360.2470672.08180.020482
37-0.0216-0.1820.42805
380.0195640.16480.434766
39-0.01441-0.12140.451851
40-0.28212-2.37720.010071
410.0221890.1870.426109
420.1726531.45480.075066
43-0.011691-0.09850.460903
440.0688030.57970.281961
45-0.002704-0.02280.490944
46-0.17056-1.43720.077532
470.0347780.2930.385172
480.0728830.61410.270547


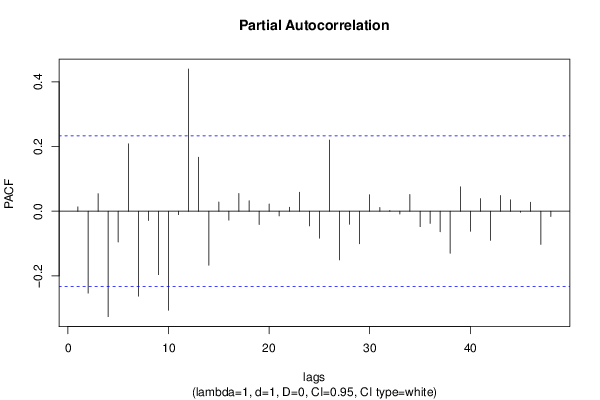
Partial Autocorrelation Function
Time lag kPACF(k)T-STATP-value
10.013480.11360.454945
2-0.253358-2.13480.018114
30.0542490.45710.324494
4-0.32617-2.74840.003794
5-0.09549-0.80460.211865
60.2082521.75480.041807
7-0.262747-2.21390.015023
8-0.02867-0.24160.404902
9-0.196143-1.65270.051401
10-0.306197-2.58010.005974
11-0.01069-0.09010.46424
120.4399343.7070.000206
130.1666451.40420.082313
14-0.167-1.40720.08187
150.0284720.23990.405545
16-0.027591-0.23250.408414
170.0545840.45990.323484
180.0324810.27370.392557
19-0.041412-0.34890.364081
200.0222610.18760.425872
21-0.01463-0.12330.451118
220.0120260.10130.459787
230.0583520.49170.31223
24-0.045545-0.38380.351148
25-0.083305-0.70190.242506
260.2203931.85710.033725
27-0.150512-1.26820.104428
28-0.040339-0.33990.367466
29-0.100473-0.84660.200032
300.0507610.42770.335074
310.0112320.09460.462434
320.0019430.01640.493492
33-0.008864-0.07470.470336
340.0514910.43390.33285
35-0.047763-0.40250.344277
36-0.037691-0.31760.375864
37-0.063413-0.53430.297393
38-0.130234-1.09740.138094
390.0753270.63470.263828
40-0.062027-0.52260.301423
410.038780.32680.372402
42-0.090185-0.75990.224911
430.048690.41030.34142
440.0351370.29610.38402
45-0.003345-0.02820.488798
460.0279020.23510.4074
47-0.102597-0.86450.195114
48-0.016199-0.13650.445909

\begin{tabular}{lllllllll}
\hline
Partial Autocorrelation Function \tabularnewline
Time lag k & PACF(k) & T-STAT & P-value \tabularnewline
1 & 0.01348 & 0.1136 & 0.454945 \tabularnewline
2 & -0.253358 & -2.1348 & 0.018114 \tabularnewline
3 & 0.054249 & 0.4571 & 0.324494 \tabularnewline
4 & -0.32617 & -2.7484 & 0.003794 \tabularnewline
5 & -0.09549 & -0.8046 & 0.211865 \tabularnewline
6 & 0.208252 & 1.7548 & 0.041807 \tabularnewline
7 & -0.262747 & -2.2139 & 0.015023 \tabularnewline
8 & -0.02867 & -0.2416 & 0.404902 \tabularnewline
9 & -0.196143 & -1.6527 & 0.051401 \tabularnewline
10 & -0.306197 & -2.5801 & 0.005974 \tabularnewline
11 & -0.01069 & -0.0901 & 0.46424 \tabularnewline
12 & 0.439934 & 3.707 & 0.000206 \tabularnewline
13 & 0.166645 & 1.4042 & 0.082313 \tabularnewline
14 & -0.167 & -1.4072 & 0.08187 \tabularnewline
15 & 0.028472 & 0.2399 & 0.405545 \tabularnewline
16 & -0.027591 & -0.2325 & 0.408414 \tabularnewline
17 & 0.054584 & 0.4599 & 0.323484 \tabularnewline
18 & 0.032481 & 0.2737 & 0.392557 \tabularnewline
19 & -0.041412 & -0.3489 & 0.364081 \tabularnewline
20 & 0.022261 & 0.1876 & 0.425872 \tabularnewline
21 & -0.01463 & -0.1233 & 0.451118 \tabularnewline
22 & 0.012026 & 0.1013 & 0.459787 \tabularnewline
23 & 0.058352 & 0.4917 & 0.31223 \tabularnewline
24 & -0.045545 & -0.3838 & 0.351148 \tabularnewline
25 & -0.083305 & -0.7019 & 0.242506 \tabularnewline
26 & 0.220393 & 1.8571 & 0.033725 \tabularnewline
27 & -0.150512 & -1.2682 & 0.104428 \tabularnewline
28 & -0.040339 & -0.3399 & 0.367466 \tabularnewline
29 & -0.100473 & -0.8466 & 0.200032 \tabularnewline
30 & 0.050761 & 0.4277 & 0.335074 \tabularnewline
31 & 0.011232 & 0.0946 & 0.462434 \tabularnewline
32 & 0.001943 & 0.0164 & 0.493492 \tabularnewline
33 & -0.008864 & -0.0747 & 0.470336 \tabularnewline
34 & 0.051491 & 0.4339 & 0.33285 \tabularnewline
35 & -0.047763 & -0.4025 & 0.344277 \tabularnewline
36 & -0.037691 & -0.3176 & 0.375864 \tabularnewline
37 & -0.063413 & -0.5343 & 0.297393 \tabularnewline
38 & -0.130234 & -1.0974 & 0.138094 \tabularnewline
39 & 0.075327 & 0.6347 & 0.263828 \tabularnewline
40 & -0.062027 & -0.5226 & 0.301423 \tabularnewline
41 & 0.03878 & 0.3268 & 0.372402 \tabularnewline
42 & -0.090185 & -0.7599 & 0.224911 \tabularnewline
43 & 0.04869 & 0.4103 & 0.34142 \tabularnewline
44 & 0.035137 & 0.2961 & 0.38402 \tabularnewline
45 & -0.003345 & -0.0282 & 0.488798 \tabularnewline
46 & 0.027902 & 0.2351 & 0.4074 \tabularnewline
47 & -0.102597 & -0.8645 & 0.195114 \tabularnewline
48 & -0.016199 & -0.1365 & 0.445909 \tabularnewline
\hline
\end{tabular}
%Source: https://freestatistics.org/blog/index.php?pk=254983&T=2

[TABLE]
[ROW][C]Partial Autocorrelation Function[/C][/ROW]
[ROW][C]Time lag k[/C][C]PACF(k)[/C][C]T-STAT[/C][C]P-value[/C][/ROW]
[ROW][C]1[/C][C]0.01348[/C][C]0.1136[/C][C]0.454945[/C][/ROW]
[ROW][C]2[/C][C]-0.253358[/C][C]-2.1348[/C][C]0.018114[/C][/ROW]
[ROW][C]3[/C][C]0.054249[/C][C]0.4571[/C][C]0.324494[/C][/ROW]
[ROW][C]4[/C][C]-0.32617[/C][C]-2.7484[/C][C]0.003794[/C][/ROW]
[ROW][C]5[/C][C]-0.09549[/C][C]-0.8046[/C][C]0.211865[/C][/ROW]
[ROW][C]6[/C][C]0.208252[/C][C]1.7548[/C][C]0.041807[/C][/ROW]
[ROW][C]7[/C][C]-0.262747[/C][C]-2.2139[/C][C]0.015023[/C][/ROW]
[ROW][C]8[/C][C]-0.02867[/C][C]-0.2416[/C][C]0.404902[/C][/ROW]
[ROW][C]9[/C][C]-0.196143[/C][C]-1.6527[/C][C]0.051401[/C][/ROW]
[ROW][C]10[/C][C]-0.306197[/C][C]-2.5801[/C][C]0.005974[/C][/ROW]
[ROW][C]11[/C][C]-0.01069[/C][C]-0.0901[/C][C]0.46424[/C][/ROW]
[ROW][C]12[/C][C]0.439934[/C][C]3.707[/C][C]0.000206[/C][/ROW]
[ROW][C]13[/C][C]0.166645[/C][C]1.4042[/C][C]0.082313[/C][/ROW]
[ROW][C]14[/C][C]-0.167[/C][C]-1.4072[/C][C]0.08187[/C][/ROW]
[ROW][C]15[/C][C]0.028472[/C][C]0.2399[/C][C]0.405545[/C][/ROW]
[ROW][C]16[/C][C]-0.027591[/C][C]-0.2325[/C][C]0.408414[/C][/ROW]
[ROW][C]17[/C][C]0.054584[/C][C]0.4599[/C][C]0.323484[/C][/ROW]
[ROW][C]18[/C][C]0.032481[/C][C]0.2737[/C][C]0.392557[/C][/ROW]
[ROW][C]19[/C][C]-0.041412[/C][C]-0.3489[/C][C]0.364081[/C][/ROW]
[ROW][C]20[/C][C]0.022261[/C][C]0.1876[/C][C]0.425872[/C][/ROW]
[ROW][C]21[/C][C]-0.01463[/C][C]-0.1233[/C][C]0.451118[/C][/ROW]
[ROW][C]22[/C][C]0.012026[/C][C]0.1013[/C][C]0.459787[/C][/ROW]
[ROW][C]23[/C][C]0.058352[/C][C]0.4917[/C][C]0.31223[/C][/ROW]
[ROW][C]24[/C][C]-0.045545[/C][C]-0.3838[/C][C]0.351148[/C][/ROW]
[ROW][C]25[/C][C]-0.083305[/C][C]-0.7019[/C][C]0.242506[/C][/ROW]
[ROW][C]26[/C][C]0.220393[/C][C]1.8571[/C][C]0.033725[/C][/ROW]
[ROW][C]27[/C][C]-0.150512[/C][C]-1.2682[/C][C]0.104428[/C][/ROW]
[ROW][C]28[/C][C]-0.040339[/C][C]-0.3399[/C][C]0.367466[/C][/ROW]
[ROW][C]29[/C][C]-0.100473[/C][C]-0.8466[/C][C]0.200032[/C][/ROW]
[ROW][C]30[/C][C]0.050761[/C][C]0.4277[/C][C]0.335074[/C][/ROW]
[ROW][C]31[/C][C]0.011232[/C][C]0.0946[/C][C]0.462434[/C][/ROW]
[ROW][C]32[/C][C]0.001943[/C][C]0.0164[/C][C]0.493492[/C][/ROW]
[ROW][C]33[/C][C]-0.008864[/C][C]-0.0747[/C][C]0.470336[/C][/ROW]
[ROW][C]34[/C][C]0.051491[/C][C]0.4339[/C][C]0.33285[/C][/ROW]
[ROW][C]35[/C][C]-0.047763[/C][C]-0.4025[/C][C]0.344277[/C][/ROW]
[ROW][C]36[/C][C]-0.037691[/C][C]-0.3176[/C][C]0.375864[/C][/ROW]
[ROW][C]37[/C][C]-0.063413[/C][C]-0.5343[/C][C]0.297393[/C][/ROW]
[ROW][C]38[/C][C]-0.130234[/C][C]-1.0974[/C][C]0.138094[/C][/ROW]
[ROW][C]39[/C][C]0.075327[/C][C]0.6347[/C][C]0.263828[/C][/ROW]
[ROW][C]40[/C][C]-0.062027[/C][C]-0.5226[/C][C]0.301423[/C][/ROW]
[ROW][C]41[/C][C]0.03878[/C][C]0.3268[/C][C]0.372402[/C][/ROW]
[ROW][C]42[/C][C]-0.090185[/C][C]-0.7599[/C][C]0.224911[/C][/ROW]
[ROW][C]43[/C][C]0.04869[/C][C]0.4103[/C][C]0.34142[/C][/ROW]
[ROW][C]44[/C][C]0.035137[/C][C]0.2961[/C][C]0.38402[/C][/ROW]
[ROW][C]45[/C][C]-0.003345[/C][C]-0.0282[/C][C]0.488798[/C][/ROW]
[ROW][C]46[/C][C]0.027902[/C][C]0.2351[/C][C]0.4074[/C][/ROW]
[ROW][C]47[/C][C]-0.102597[/C][C]-0.8645[/C][C]0.195114[/C][/ROW]
[ROW][C]48[/C][C]-0.016199[/C][C]-0.1365[/C][C]0.445909[/C][/ROW]
[/TABLE]
Source: https://freestatistics.org/blog/index.php?pk=254983&T=2

Globally Unique Identifier (entire table): ba.freestatistics.org/blog/index.php?pk=254983&T=2

As an alternative you can also use a QR Code:  

The GUIDs for individual cells are displayed in the table below:

Partial Autocorrelation Function
Time lag kPACF(k)T-STATP-value
10.013480.11360.454945
2-0.253358-2.13480.018114
30.0542490.45710.324494
4-0.32617-2.74840.003794
5-0.09549-0.80460.211865
60.2082521.75480.041807
7-0.262747-2.21390.015023
8-0.02867-0.24160.404902
9-0.196143-1.65270.051401
10-0.306197-2.58010.005974
11-0.01069-0.09010.46424
120.4399343.7070.000206
130.1666451.40420.082313
14-0.167-1.40720.08187
150.0284720.23990.405545
16-0.027591-0.23250.408414
170.0545840.45990.323484
180.0324810.27370.392557
19-0.041412-0.34890.364081
200.0222610.18760.425872
21-0.01463-0.12330.451118
220.0120260.10130.459787
230.0583520.49170.31223
24-0.045545-0.38380.351148
25-0.083305-0.70190.242506
260.2203931.85710.033725
27-0.150512-1.26820.104428
28-0.040339-0.33990.367466
29-0.100473-0.84660.200032
300.0507610.42770.335074
310.0112320.09460.462434
320.0019430.01640.493492
33-0.008864-0.07470.470336
340.0514910.43390.33285
35-0.047763-0.40250.344277
36-0.037691-0.31760.375864
37-0.063413-0.53430.297393
38-0.130234-1.09740.138094
390.0753270.63470.263828
40-0.062027-0.52260.301423
410.038780.32680.372402
42-0.090185-0.75990.224911
430.048690.41030.34142
440.0351370.29610.38402
45-0.003345-0.02820.488798
460.0279020.23510.4074
47-0.102597-0.86450.195114
48-0.016199-0.13650.445909


Parameters (Session):
par1 = 48 ; par2 = 1 ; par3 = 1 ; par4 = 0 ; par5 = 12 ; par6 = White Noise ; par7 = 0.95 ;
Parameters (R input):
par1 = 48 ; par2 = 1 ; par3 = 1 ; par4 = 0 ; par5 = 12 ; par6 = White Noise ; par7 = 0.95 ; par8 = ;
R code (references can be found in the software module):
par8 <- ''
par7 <- '0.95'
par6 <- 'White Noise'
par5 <- '12'
par4 <- '0'
par3 <- '1'
par2 <- '1'
par1 <- '48'
if (par1 == 'Default') {
par1 = 10*log10(length(x))
} else {
par1 <- as.numeric(par1)
}
par2 <- as.numeric(par2)
par3 <- as.numeric(par3)
par4 <- as.numeric(par4)
par5 <- as.numeric(par5)
if (par6 == 'White Noise') par6 <- 'white' else par6 <- 'ma'
par7 <- as.numeric(par7)
if (par8 != '') par8 <- as.numeric(par8)
ox <- x
if (par8 == '') {
if (par2 == 0) {
x <- log(x)
} else {
x <- (x ^ par2 - 1) / par2
}
} else {
x <- log(x,base=par8)
}
if (par3 > 0) x <- diff(x,lag=1,difference=par3)
if (par4 > 0) x <- diff(x,lag=par5,difference=par4)
bitmap(file='picts.png')
op <- par(mfrow=c(2,1))
plot(ox,type='l',main='Original Time Series',xlab='time',ylab='value')
if (par8=='') {
mytitle <- paste('Working Time Series (lambda=',par2,', d=',par3,', D=',par4,')',sep='')
mysub <- paste('(lambda=',par2,', d=',par3,', D=',par4,', CI=', par7, ', CI type=',par6,')',sep='')
} else {
mytitle <- paste('Working Time Series (base=',par8,', d=',par3,', D=',par4,')',sep='')
mysub <- paste('(base=',par8,', d=',par3,', D=',par4,', CI=', par7, ', CI type=',par6,')',sep='')
}
plot(x,type='l', main=mytitle,xlab='time',ylab='value')
par(op)
dev.off()
bitmap(file='pic1.png')
racf <- acf(x, par1, main='Autocorrelation', xlab='time lag', ylab='ACF', ci.type=par6, ci=par7, sub=mysub)
dev.off()
bitmap(file='pic2.png')
rpacf <- pacf(x,par1,main='Partial Autocorrelation',xlab='lags',ylab='PACF',sub=mysub)
dev.off()
(myacf <- c(racf$acf))
(mypacf <- c(rpacf$acf))
lengthx <- length(x)
sqrtn <- sqrt(lengthx)
load(file='createtable')
a<-table.start()
a<-table.row.start(a)
a<-table.element(a,'Autocorrelation Function',4,TRUE)
a<-table.row.end(a)
a<-table.row.start(a)
a<-table.element(a,'Time lag k',header=TRUE)
a<-table.element(a,hyperlink('basics.htm','ACF(k)','click here for more information about the Autocorrelation Function'),header=TRUE)
a<-table.element(a,'T-STAT',header=TRUE)
a<-table.element(a,'P-value',header=TRUE)
a<-table.row.end(a)
for (i in 2:(par1+1)) {
a<-table.row.start(a)
a<-table.element(a,i-1,header=TRUE)
a<-table.element(a,round(myacf[i],6))
mytstat <- myacf[i]*sqrtn
a<-table.element(a,round(mytstat,4))
a<-table.element(a,round(1-pt(abs(mytstat),lengthx),6))
a<-table.row.end(a)
}
a<-table.end(a)
table.save(a,file='mytable.tab')
a<-table.start()
a<-table.row.start(a)
a<-table.element(a,'Partial Autocorrelation Function',4,TRUE)
a<-table.row.end(a)
a<-table.row.start(a)
a<-table.element(a,'Time lag k',header=TRUE)
a<-table.element(a,hyperlink('basics.htm','PACF(k)','click here for more information about the Partial Autocorrelation Function'),header=TRUE)
a<-table.element(a,'T-STAT',header=TRUE)
a<-table.element(a,'P-value',header=TRUE)
a<-table.row.end(a)
for (i in 1:par1) {
a<-table.row.start(a)
a<-table.element(a,i,header=TRUE)
a<-table.element(a,round(mypacf[i],6))
mytstat <- mypacf[i]*sqrtn
a<-table.element(a,round(mytstat,4))
a<-table.element(a,round(1-pt(abs(mytstat),lengthx),6))
a<-table.row.end(a)
}
a<-table.end(a)
table.save(a,file='mytable1.tab')