Free Statistics

of Irreproducible Research!

Author's title

Author*Unverified author*
R Software Modulerwasp_autocorrelation.wasp
Title produced by software(Partial) Autocorrelation Function
Date of computationSat, 15 Nov 2014 14:52:11 +0000
Cite this page as followsStatistical Computations at FreeStatistics.org, Office for Research Development and Education, URL https://freestatistics.org/blog/index.php?v=date/2014/Nov/15/t1416063219pr6p6asv99htgrx.htm/, Retrieved Sun, 19 May 2024 13:58:29 +0000
Statistical Computations at FreeStatistics.org, Office for Research Development and Education, URL https://freestatistics.org/blog/index.php?pk=254981, Retrieved Sun, 19 May 2024 13:58:29 +0000
QR Codes:

Original text written by user:
IsPrivate?No (this computation is public)
User-defined keywords
Estimated Impact65
Family? (F = Feedback message, R = changed R code, M = changed R Module, P = changed Parameters, D = changed Data)
-       [(Partial) Autocorrelation Function] [opdracht 7 oef 4 ...] [2014-11-15 14:52:11] [6100e5aa5cdb51a951984168d031078f] [Current]
Feedback Forum

Post a new message
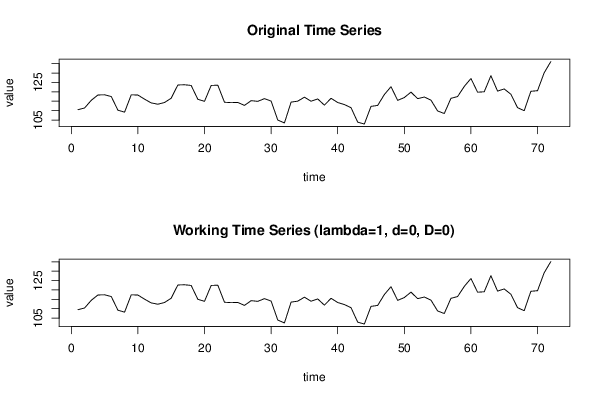
Dataseries X:
110,48
111,41
115,5
118,32
118,42
117,5
110,23
109,19
118,41
118,3
116,1
114,11
113,41
114,33
116,61
123,64
123,77
123,39
116,03
114,95
123,4
123,53
114,45
114,26
114,35
112,77
115,31
114,93
116,38
115,07
105
103,43
114,52
115,04
117,16
115
116,22
112,92
116,56
114,32
113,22
111,56
103,87
102,85
112,27
112,76
118,55
122,73
115,44
116,97
119,84
116,37
117,23
115,58
109,82
108,46
116,54
117,49
122,87
127,1
119,81
120,03
128,58
120,4
121,54
118,71
111,57
109,97
120,29
120,61
130,15
136,12


Summary of computational transaction
Raw Inputview raw input (R code)
Raw Outputview raw output of R engine
Computing time2 seconds
R Server'Sir Ronald Aylmer Fisher' @ fisher.wessa.net

\begin{tabular}{lllllllll}
\hline
Summary of computational transaction \tabularnewline
Raw Input & view raw input (R code)  \tabularnewline
Raw Output & view raw output of R engine  \tabularnewline
Computing time & 2 seconds \tabularnewline
R Server & 'Sir Ronald Aylmer Fisher' @ fisher.wessa.net \tabularnewline
\hline
\end{tabular}
%Source: https://freestatistics.org/blog/index.php?pk=254981&T=0

[TABLE]
[ROW][C]Summary of computational transaction[/C][/ROW]
[ROW][C]Raw Input[/C][C]view raw input (R code) [/C][/ROW]
[ROW][C]Raw Output[/C][C]view raw output of R engine [/C][/ROW]
[ROW][C]Computing time[/C][C]2 seconds[/C][/ROW]
[ROW][C]R Server[/C][C]'Sir Ronald Aylmer Fisher' @ fisher.wessa.net[/C][/ROW]
[/TABLE]
Source: https://freestatistics.org/blog/index.php?pk=254981&T=0

Globally Unique Identifier (entire table): ba.freestatistics.org/blog/index.php?pk=254981&T=0

As an alternative you can also use a QR Code:  

The GUIDs for individual cells are displayed in the table below:

Summary of computational transaction
Raw Inputview raw input (R code)
Raw Outputview raw output of R engine
Computing time2 seconds
R Server'Sir Ronald Aylmer Fisher' @ fisher.wessa.net


Autocorrelation Function
Time lag kACF(k)T-STATP-value
10.57354.86633e-06
20.1860551.57870.059391
30.0560510.47560.317895
4-0.093955-0.79720.213969
50.0017850.01510.493977
60.1679141.42480.079268
70.034160.28990.386379
8-0.025676-0.21790.414075
90.0350760.29760.38342
100.0138760.11770.453298
110.2562932.17470.016469
120.4742024.02377e-05
130.2045991.73610.043413
14-0.083507-0.70860.240436
15-0.181903-1.54350.063547
16-0.279016-2.36750.010298
17-0.153128-1.29930.098988
180.0029170.02480.49016
19-0.103149-0.87530.192174
20-0.160753-1.3640.088402
21-0.125314-1.06330.145594
22-0.144319-1.22460.112361
230.0321410.27270.392922
240.1893711.60690.056231
25-0.000927-0.00790.496873
26-0.165646-1.40560.082078
27-0.280046-2.37630.010075
28-0.346673-2.94160.002195
29-0.159665-1.35480.089859
300.0308410.26170.397152
31-0.026032-0.22090.412902
32-0.061759-0.5240.300929
33-0.090995-0.77210.221287
34-0.123672-1.04940.148754
35-0.000215-0.00180.499274
360.0837150.71030.239893
370.0123780.1050.458322
38-0.07268-0.61670.269684
39-0.146592-1.24390.10879
40-0.214126-1.81690.036696
41-0.004472-0.03790.484918
420.1721591.46080.074208
430.1276841.08340.141115
440.073580.62440.267185
450.0050810.04310.482864
46-0.066312-0.56270.287702
470.0103690.0880.465067
480.0596010.50570.307296

\begin{tabular}{lllllllll}
\hline
Autocorrelation Function \tabularnewline
Time lag k & ACF(k) & T-STAT & P-value \tabularnewline
1 & 0.5735 & 4.8663 & 3e-06 \tabularnewline
2 & 0.186055 & 1.5787 & 0.059391 \tabularnewline
3 & 0.056051 & 0.4756 & 0.317895 \tabularnewline
4 & -0.093955 & -0.7972 & 0.213969 \tabularnewline
5 & 0.001785 & 0.0151 & 0.493977 \tabularnewline
6 & 0.167914 & 1.4248 & 0.079268 \tabularnewline
7 & 0.03416 & 0.2899 & 0.386379 \tabularnewline
8 & -0.025676 & -0.2179 & 0.414075 \tabularnewline
9 & 0.035076 & 0.2976 & 0.38342 \tabularnewline
10 & 0.013876 & 0.1177 & 0.453298 \tabularnewline
11 & 0.256293 & 2.1747 & 0.016469 \tabularnewline
12 & 0.474202 & 4.0237 & 7e-05 \tabularnewline
13 & 0.204599 & 1.7361 & 0.043413 \tabularnewline
14 & -0.083507 & -0.7086 & 0.240436 \tabularnewline
15 & -0.181903 & -1.5435 & 0.063547 \tabularnewline
16 & -0.279016 & -2.3675 & 0.010298 \tabularnewline
17 & -0.153128 & -1.2993 & 0.098988 \tabularnewline
18 & 0.002917 & 0.0248 & 0.49016 \tabularnewline
19 & -0.103149 & -0.8753 & 0.192174 \tabularnewline
20 & -0.160753 & -1.364 & 0.088402 \tabularnewline
21 & -0.125314 & -1.0633 & 0.145594 \tabularnewline
22 & -0.144319 & -1.2246 & 0.112361 \tabularnewline
23 & 0.032141 & 0.2727 & 0.392922 \tabularnewline
24 & 0.189371 & 1.6069 & 0.056231 \tabularnewline
25 & -0.000927 & -0.0079 & 0.496873 \tabularnewline
26 & -0.165646 & -1.4056 & 0.082078 \tabularnewline
27 & -0.280046 & -2.3763 & 0.010075 \tabularnewline
28 & -0.346673 & -2.9416 & 0.002195 \tabularnewline
29 & -0.159665 & -1.3548 & 0.089859 \tabularnewline
30 & 0.030841 & 0.2617 & 0.397152 \tabularnewline
31 & -0.026032 & -0.2209 & 0.412902 \tabularnewline
32 & -0.061759 & -0.524 & 0.300929 \tabularnewline
33 & -0.090995 & -0.7721 & 0.221287 \tabularnewline
34 & -0.123672 & -1.0494 & 0.148754 \tabularnewline
35 & -0.000215 & -0.0018 & 0.499274 \tabularnewline
36 & 0.083715 & 0.7103 & 0.239893 \tabularnewline
37 & 0.012378 & 0.105 & 0.458322 \tabularnewline
38 & -0.07268 & -0.6167 & 0.269684 \tabularnewline
39 & -0.146592 & -1.2439 & 0.10879 \tabularnewline
40 & -0.214126 & -1.8169 & 0.036696 \tabularnewline
41 & -0.004472 & -0.0379 & 0.484918 \tabularnewline
42 & 0.172159 & 1.4608 & 0.074208 \tabularnewline
43 & 0.127684 & 1.0834 & 0.141115 \tabularnewline
44 & 0.07358 & 0.6244 & 0.267185 \tabularnewline
45 & 0.005081 & 0.0431 & 0.482864 \tabularnewline
46 & -0.066312 & -0.5627 & 0.287702 \tabularnewline
47 & 0.010369 & 0.088 & 0.465067 \tabularnewline
48 & 0.059601 & 0.5057 & 0.307296 \tabularnewline
\hline
\end{tabular}
%Source: https://freestatistics.org/blog/index.php?pk=254981&T=1

[TABLE]
[ROW][C]Autocorrelation Function[/C][/ROW]
[ROW][C]Time lag k[/C][C]ACF(k)[/C][C]T-STAT[/C][C]P-value[/C][/ROW]
[ROW][C]1[/C][C]0.5735[/C][C]4.8663[/C][C]3e-06[/C][/ROW]
[ROW][C]2[/C][C]0.186055[/C][C]1.5787[/C][C]0.059391[/C][/ROW]
[ROW][C]3[/C][C]0.056051[/C][C]0.4756[/C][C]0.317895[/C][/ROW]
[ROW][C]4[/C][C]-0.093955[/C][C]-0.7972[/C][C]0.213969[/C][/ROW]
[ROW][C]5[/C][C]0.001785[/C][C]0.0151[/C][C]0.493977[/C][/ROW]
[ROW][C]6[/C][C]0.167914[/C][C]1.4248[/C][C]0.079268[/C][/ROW]
[ROW][C]7[/C][C]0.03416[/C][C]0.2899[/C][C]0.386379[/C][/ROW]
[ROW][C]8[/C][C]-0.025676[/C][C]-0.2179[/C][C]0.414075[/C][/ROW]
[ROW][C]9[/C][C]0.035076[/C][C]0.2976[/C][C]0.38342[/C][/ROW]
[ROW][C]10[/C][C]0.013876[/C][C]0.1177[/C][C]0.453298[/C][/ROW]
[ROW][C]11[/C][C]0.256293[/C][C]2.1747[/C][C]0.016469[/C][/ROW]
[ROW][C]12[/C][C]0.474202[/C][C]4.0237[/C][C]7e-05[/C][/ROW]
[ROW][C]13[/C][C]0.204599[/C][C]1.7361[/C][C]0.043413[/C][/ROW]
[ROW][C]14[/C][C]-0.083507[/C][C]-0.7086[/C][C]0.240436[/C][/ROW]
[ROW][C]15[/C][C]-0.181903[/C][C]-1.5435[/C][C]0.063547[/C][/ROW]
[ROW][C]16[/C][C]-0.279016[/C][C]-2.3675[/C][C]0.010298[/C][/ROW]
[ROW][C]17[/C][C]-0.153128[/C][C]-1.2993[/C][C]0.098988[/C][/ROW]
[ROW][C]18[/C][C]0.002917[/C][C]0.0248[/C][C]0.49016[/C][/ROW]
[ROW][C]19[/C][C]-0.103149[/C][C]-0.8753[/C][C]0.192174[/C][/ROW]
[ROW][C]20[/C][C]-0.160753[/C][C]-1.364[/C][C]0.088402[/C][/ROW]
[ROW][C]21[/C][C]-0.125314[/C][C]-1.0633[/C][C]0.145594[/C][/ROW]
[ROW][C]22[/C][C]-0.144319[/C][C]-1.2246[/C][C]0.112361[/C][/ROW]
[ROW][C]23[/C][C]0.032141[/C][C]0.2727[/C][C]0.392922[/C][/ROW]
[ROW][C]24[/C][C]0.189371[/C][C]1.6069[/C][C]0.056231[/C][/ROW]
[ROW][C]25[/C][C]-0.000927[/C][C]-0.0079[/C][C]0.496873[/C][/ROW]
[ROW][C]26[/C][C]-0.165646[/C][C]-1.4056[/C][C]0.082078[/C][/ROW]
[ROW][C]27[/C][C]-0.280046[/C][C]-2.3763[/C][C]0.010075[/C][/ROW]
[ROW][C]28[/C][C]-0.346673[/C][C]-2.9416[/C][C]0.002195[/C][/ROW]
[ROW][C]29[/C][C]-0.159665[/C][C]-1.3548[/C][C]0.089859[/C][/ROW]
[ROW][C]30[/C][C]0.030841[/C][C]0.2617[/C][C]0.397152[/C][/ROW]
[ROW][C]31[/C][C]-0.026032[/C][C]-0.2209[/C][C]0.412902[/C][/ROW]
[ROW][C]32[/C][C]-0.061759[/C][C]-0.524[/C][C]0.300929[/C][/ROW]
[ROW][C]33[/C][C]-0.090995[/C][C]-0.7721[/C][C]0.221287[/C][/ROW]
[ROW][C]34[/C][C]-0.123672[/C][C]-1.0494[/C][C]0.148754[/C][/ROW]
[ROW][C]35[/C][C]-0.000215[/C][C]-0.0018[/C][C]0.499274[/C][/ROW]
[ROW][C]36[/C][C]0.083715[/C][C]0.7103[/C][C]0.239893[/C][/ROW]
[ROW][C]37[/C][C]0.012378[/C][C]0.105[/C][C]0.458322[/C][/ROW]
[ROW][C]38[/C][C]-0.07268[/C][C]-0.6167[/C][C]0.269684[/C][/ROW]
[ROW][C]39[/C][C]-0.146592[/C][C]-1.2439[/C][C]0.10879[/C][/ROW]
[ROW][C]40[/C][C]-0.214126[/C][C]-1.8169[/C][C]0.036696[/C][/ROW]
[ROW][C]41[/C][C]-0.004472[/C][C]-0.0379[/C][C]0.484918[/C][/ROW]
[ROW][C]42[/C][C]0.172159[/C][C]1.4608[/C][C]0.074208[/C][/ROW]
[ROW][C]43[/C][C]0.127684[/C][C]1.0834[/C][C]0.141115[/C][/ROW]
[ROW][C]44[/C][C]0.07358[/C][C]0.6244[/C][C]0.267185[/C][/ROW]
[ROW][C]45[/C][C]0.005081[/C][C]0.0431[/C][C]0.482864[/C][/ROW]
[ROW][C]46[/C][C]-0.066312[/C][C]-0.5627[/C][C]0.287702[/C][/ROW]
[ROW][C]47[/C][C]0.010369[/C][C]0.088[/C][C]0.465067[/C][/ROW]
[ROW][C]48[/C][C]0.059601[/C][C]0.5057[/C][C]0.307296[/C][/ROW]
[/TABLE]
Source: https://freestatistics.org/blog/index.php?pk=254981&T=1

Globally Unique Identifier (entire table): ba.freestatistics.org/blog/index.php?pk=254981&T=1

As an alternative you can also use a QR Code:  

The GUIDs for individual cells are displayed in the table below:

Autocorrelation Function
Time lag kACF(k)T-STATP-value
10.57354.86633e-06
20.1860551.57870.059391
30.0560510.47560.317895
4-0.093955-0.79720.213969
50.0017850.01510.493977
60.1679141.42480.079268
70.034160.28990.386379
8-0.025676-0.21790.414075
90.0350760.29760.38342
100.0138760.11770.453298
110.2562932.17470.016469
120.4742024.02377e-05
130.2045991.73610.043413
14-0.083507-0.70860.240436
15-0.181903-1.54350.063547
16-0.279016-2.36750.010298
17-0.153128-1.29930.098988
180.0029170.02480.49016
19-0.103149-0.87530.192174
20-0.160753-1.3640.088402
21-0.125314-1.06330.145594
22-0.144319-1.22460.112361
230.0321410.27270.392922
240.1893711.60690.056231
25-0.000927-0.00790.496873
26-0.165646-1.40560.082078
27-0.280046-2.37630.010075
28-0.346673-2.94160.002195
29-0.159665-1.35480.089859
300.0308410.26170.397152
31-0.026032-0.22090.412902
32-0.061759-0.5240.300929
33-0.090995-0.77210.221287
34-0.123672-1.04940.148754
35-0.000215-0.00180.499274
360.0837150.71030.239893
370.0123780.1050.458322
38-0.07268-0.61670.269684
39-0.146592-1.24390.10879
40-0.214126-1.81690.036696
41-0.004472-0.03790.484918
420.1721591.46080.074208
430.1276841.08340.141115
440.073580.62440.267185
450.0050810.04310.482864
46-0.066312-0.56270.287702
470.0103690.0880.465067
480.0596010.50570.307296


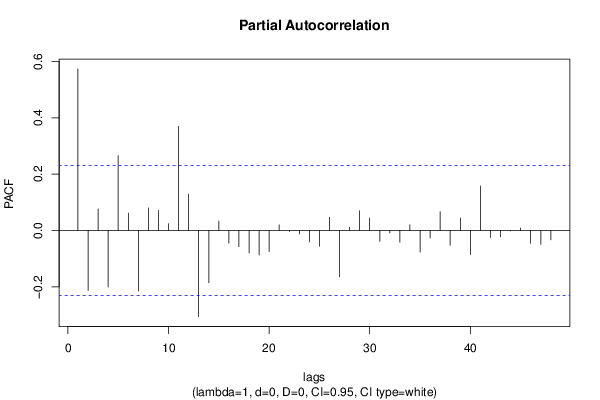
Partial Autocorrelation Function
Time lag kPACF(k)T-STATP-value
10.57354.86633e-06
2-0.212857-1.80620.037537
30.0760280.64510.260451
4-0.200961-1.70520.046233
50.2658032.25540.013574
60.0615010.52190.301687
7-0.215074-1.8250.036077
80.0798770.67780.250041
90.0708360.60110.274842
100.0241610.2050.41907
110.3697523.13740.001235
120.1289281.0940.138803
13-0.306047-2.59690.005699
14-0.185499-1.5740.059934
150.033440.28370.388709
16-0.045011-0.38190.351819
17-0.057428-0.48730.313765
18-0.080212-0.68060.249146
19-0.087038-0.73850.231293
20-0.074712-0.6340.264061
210.0198950.16880.433207
22-0.003734-0.03170.487407
23-0.012183-0.10340.458977
24-0.040703-0.34540.365408
25-0.055817-0.47360.318601
260.0465970.39540.346863
27-0.164163-1.3930.083958
280.0114190.09690.461541
290.0697490.59180.277905
300.0442310.37530.354266
31-0.038891-0.330.371178
32-0.008753-0.07430.470501
33-0.04156-0.35260.362692
340.0202760.17210.43194
35-0.076377-0.64810.259498
36-0.027028-0.22930.409629
370.0664120.56350.287414
38-0.052789-0.44790.327773
390.0443730.37650.353821
40-0.08548-0.72530.235304
410.157781.33880.092423
42-0.025201-0.21380.41564
43-0.022667-0.19230.424011
44-0.001587-0.01350.494646
450.008830.07490.47024
46-0.045346-0.38480.350769
47-0.048897-0.41490.339723
48-0.033351-0.2830.388996

\begin{tabular}{lllllllll}
\hline
Partial Autocorrelation Function \tabularnewline
Time lag k & PACF(k) & T-STAT & P-value \tabularnewline
1 & 0.5735 & 4.8663 & 3e-06 \tabularnewline
2 & -0.212857 & -1.8062 & 0.037537 \tabularnewline
3 & 0.076028 & 0.6451 & 0.260451 \tabularnewline
4 & -0.200961 & -1.7052 & 0.046233 \tabularnewline
5 & 0.265803 & 2.2554 & 0.013574 \tabularnewline
6 & 0.061501 & 0.5219 & 0.301687 \tabularnewline
7 & -0.215074 & -1.825 & 0.036077 \tabularnewline
8 & 0.079877 & 0.6778 & 0.250041 \tabularnewline
9 & 0.070836 & 0.6011 & 0.274842 \tabularnewline
10 & 0.024161 & 0.205 & 0.41907 \tabularnewline
11 & 0.369752 & 3.1374 & 0.001235 \tabularnewline
12 & 0.128928 & 1.094 & 0.138803 \tabularnewline
13 & -0.306047 & -2.5969 & 0.005699 \tabularnewline
14 & -0.185499 & -1.574 & 0.059934 \tabularnewline
15 & 0.03344 & 0.2837 & 0.388709 \tabularnewline
16 & -0.045011 & -0.3819 & 0.351819 \tabularnewline
17 & -0.057428 & -0.4873 & 0.313765 \tabularnewline
18 & -0.080212 & -0.6806 & 0.249146 \tabularnewline
19 & -0.087038 & -0.7385 & 0.231293 \tabularnewline
20 & -0.074712 & -0.634 & 0.264061 \tabularnewline
21 & 0.019895 & 0.1688 & 0.433207 \tabularnewline
22 & -0.003734 & -0.0317 & 0.487407 \tabularnewline
23 & -0.012183 & -0.1034 & 0.458977 \tabularnewline
24 & -0.040703 & -0.3454 & 0.365408 \tabularnewline
25 & -0.055817 & -0.4736 & 0.318601 \tabularnewline
26 & 0.046597 & 0.3954 & 0.346863 \tabularnewline
27 & -0.164163 & -1.393 & 0.083958 \tabularnewline
28 & 0.011419 & 0.0969 & 0.461541 \tabularnewline
29 & 0.069749 & 0.5918 & 0.277905 \tabularnewline
30 & 0.044231 & 0.3753 & 0.354266 \tabularnewline
31 & -0.038891 & -0.33 & 0.371178 \tabularnewline
32 & -0.008753 & -0.0743 & 0.470501 \tabularnewline
33 & -0.04156 & -0.3526 & 0.362692 \tabularnewline
34 & 0.020276 & 0.1721 & 0.43194 \tabularnewline
35 & -0.076377 & -0.6481 & 0.259498 \tabularnewline
36 & -0.027028 & -0.2293 & 0.409629 \tabularnewline
37 & 0.066412 & 0.5635 & 0.287414 \tabularnewline
38 & -0.052789 & -0.4479 & 0.327773 \tabularnewline
39 & 0.044373 & 0.3765 & 0.353821 \tabularnewline
40 & -0.08548 & -0.7253 & 0.235304 \tabularnewline
41 & 0.15778 & 1.3388 & 0.092423 \tabularnewline
42 & -0.025201 & -0.2138 & 0.41564 \tabularnewline
43 & -0.022667 & -0.1923 & 0.424011 \tabularnewline
44 & -0.001587 & -0.0135 & 0.494646 \tabularnewline
45 & 0.00883 & 0.0749 & 0.47024 \tabularnewline
46 & -0.045346 & -0.3848 & 0.350769 \tabularnewline
47 & -0.048897 & -0.4149 & 0.339723 \tabularnewline
48 & -0.033351 & -0.283 & 0.388996 \tabularnewline
\hline
\end{tabular}
%Source: https://freestatistics.org/blog/index.php?pk=254981&T=2

[TABLE]
[ROW][C]Partial Autocorrelation Function[/C][/ROW]
[ROW][C]Time lag k[/C][C]PACF(k)[/C][C]T-STAT[/C][C]P-value[/C][/ROW]
[ROW][C]1[/C][C]0.5735[/C][C]4.8663[/C][C]3e-06[/C][/ROW]
[ROW][C]2[/C][C]-0.212857[/C][C]-1.8062[/C][C]0.037537[/C][/ROW]
[ROW][C]3[/C][C]0.076028[/C][C]0.6451[/C][C]0.260451[/C][/ROW]
[ROW][C]4[/C][C]-0.200961[/C][C]-1.7052[/C][C]0.046233[/C][/ROW]
[ROW][C]5[/C][C]0.265803[/C][C]2.2554[/C][C]0.013574[/C][/ROW]
[ROW][C]6[/C][C]0.061501[/C][C]0.5219[/C][C]0.301687[/C][/ROW]
[ROW][C]7[/C][C]-0.215074[/C][C]-1.825[/C][C]0.036077[/C][/ROW]
[ROW][C]8[/C][C]0.079877[/C][C]0.6778[/C][C]0.250041[/C][/ROW]
[ROW][C]9[/C][C]0.070836[/C][C]0.6011[/C][C]0.274842[/C][/ROW]
[ROW][C]10[/C][C]0.024161[/C][C]0.205[/C][C]0.41907[/C][/ROW]
[ROW][C]11[/C][C]0.369752[/C][C]3.1374[/C][C]0.001235[/C][/ROW]
[ROW][C]12[/C][C]0.128928[/C][C]1.094[/C][C]0.138803[/C][/ROW]
[ROW][C]13[/C][C]-0.306047[/C][C]-2.5969[/C][C]0.005699[/C][/ROW]
[ROW][C]14[/C][C]-0.185499[/C][C]-1.574[/C][C]0.059934[/C][/ROW]
[ROW][C]15[/C][C]0.03344[/C][C]0.2837[/C][C]0.388709[/C][/ROW]
[ROW][C]16[/C][C]-0.045011[/C][C]-0.3819[/C][C]0.351819[/C][/ROW]
[ROW][C]17[/C][C]-0.057428[/C][C]-0.4873[/C][C]0.313765[/C][/ROW]
[ROW][C]18[/C][C]-0.080212[/C][C]-0.6806[/C][C]0.249146[/C][/ROW]
[ROW][C]19[/C][C]-0.087038[/C][C]-0.7385[/C][C]0.231293[/C][/ROW]
[ROW][C]20[/C][C]-0.074712[/C][C]-0.634[/C][C]0.264061[/C][/ROW]
[ROW][C]21[/C][C]0.019895[/C][C]0.1688[/C][C]0.433207[/C][/ROW]
[ROW][C]22[/C][C]-0.003734[/C][C]-0.0317[/C][C]0.487407[/C][/ROW]
[ROW][C]23[/C][C]-0.012183[/C][C]-0.1034[/C][C]0.458977[/C][/ROW]
[ROW][C]24[/C][C]-0.040703[/C][C]-0.3454[/C][C]0.365408[/C][/ROW]
[ROW][C]25[/C][C]-0.055817[/C][C]-0.4736[/C][C]0.318601[/C][/ROW]
[ROW][C]26[/C][C]0.046597[/C][C]0.3954[/C][C]0.346863[/C][/ROW]
[ROW][C]27[/C][C]-0.164163[/C][C]-1.393[/C][C]0.083958[/C][/ROW]
[ROW][C]28[/C][C]0.011419[/C][C]0.0969[/C][C]0.461541[/C][/ROW]
[ROW][C]29[/C][C]0.069749[/C][C]0.5918[/C][C]0.277905[/C][/ROW]
[ROW][C]30[/C][C]0.044231[/C][C]0.3753[/C][C]0.354266[/C][/ROW]
[ROW][C]31[/C][C]-0.038891[/C][C]-0.33[/C][C]0.371178[/C][/ROW]
[ROW][C]32[/C][C]-0.008753[/C][C]-0.0743[/C][C]0.470501[/C][/ROW]
[ROW][C]33[/C][C]-0.04156[/C][C]-0.3526[/C][C]0.362692[/C][/ROW]
[ROW][C]34[/C][C]0.020276[/C][C]0.1721[/C][C]0.43194[/C][/ROW]
[ROW][C]35[/C][C]-0.076377[/C][C]-0.6481[/C][C]0.259498[/C][/ROW]
[ROW][C]36[/C][C]-0.027028[/C][C]-0.2293[/C][C]0.409629[/C][/ROW]
[ROW][C]37[/C][C]0.066412[/C][C]0.5635[/C][C]0.287414[/C][/ROW]
[ROW][C]38[/C][C]-0.052789[/C][C]-0.4479[/C][C]0.327773[/C][/ROW]
[ROW][C]39[/C][C]0.044373[/C][C]0.3765[/C][C]0.353821[/C][/ROW]
[ROW][C]40[/C][C]-0.08548[/C][C]-0.7253[/C][C]0.235304[/C][/ROW]
[ROW][C]41[/C][C]0.15778[/C][C]1.3388[/C][C]0.092423[/C][/ROW]
[ROW][C]42[/C][C]-0.025201[/C][C]-0.2138[/C][C]0.41564[/C][/ROW]
[ROW][C]43[/C][C]-0.022667[/C][C]-0.1923[/C][C]0.424011[/C][/ROW]
[ROW][C]44[/C][C]-0.001587[/C][C]-0.0135[/C][C]0.494646[/C][/ROW]
[ROW][C]45[/C][C]0.00883[/C][C]0.0749[/C][C]0.47024[/C][/ROW]
[ROW][C]46[/C][C]-0.045346[/C][C]-0.3848[/C][C]0.350769[/C][/ROW]
[ROW][C]47[/C][C]-0.048897[/C][C]-0.4149[/C][C]0.339723[/C][/ROW]
[ROW][C]48[/C][C]-0.033351[/C][C]-0.283[/C][C]0.388996[/C][/ROW]
[/TABLE]
Source: https://freestatistics.org/blog/index.php?pk=254981&T=2

Globally Unique Identifier (entire table): ba.freestatistics.org/blog/index.php?pk=254981&T=2

As an alternative you can also use a QR Code:  

The GUIDs for individual cells are displayed in the table below:

Partial Autocorrelation Function
Time lag kPACF(k)T-STATP-value
10.57354.86633e-06
2-0.212857-1.80620.037537
30.0760280.64510.260451
4-0.200961-1.70520.046233
50.2658032.25540.013574
60.0615010.52190.301687
7-0.215074-1.8250.036077
80.0798770.67780.250041
90.0708360.60110.274842
100.0241610.2050.41907
110.3697523.13740.001235
120.1289281.0940.138803
13-0.306047-2.59690.005699
14-0.185499-1.5740.059934
150.033440.28370.388709
16-0.045011-0.38190.351819
17-0.057428-0.48730.313765
18-0.080212-0.68060.249146
19-0.087038-0.73850.231293
20-0.074712-0.6340.264061
210.0198950.16880.433207
22-0.003734-0.03170.487407
23-0.012183-0.10340.458977
24-0.040703-0.34540.365408
25-0.055817-0.47360.318601
260.0465970.39540.346863
27-0.164163-1.3930.083958
280.0114190.09690.461541
290.0697490.59180.277905
300.0442310.37530.354266
31-0.038891-0.330.371178
32-0.008753-0.07430.470501
33-0.04156-0.35260.362692
340.0202760.17210.43194
35-0.076377-0.64810.259498
36-0.027028-0.22930.409629
370.0664120.56350.287414
38-0.052789-0.44790.327773
390.0443730.37650.353821
40-0.08548-0.72530.235304
410.157781.33880.092423
42-0.025201-0.21380.41564
43-0.022667-0.19230.424011
44-0.001587-0.01350.494646
450.008830.07490.47024
46-0.045346-0.38480.350769
47-0.048897-0.41490.339723
48-0.033351-0.2830.388996


Parameters (Session):
par1 = 48 ; par2 = 1 ; par3 = 0 ; par4 = 0 ; par5 = 12 ; par6 = White Noise ; par7 = 0.95 ;
Parameters (R input):
par1 = 48 ; par2 = 1 ; par3 = 0 ; par4 = 0 ; par5 = 12 ; par6 = White Noise ; par7 = 0.95 ; par8 = ;
R code (references can be found in the software module):
if (par1 == 'Default') {
par1 = 10*log10(length(x))
} else {
par1 <- as.numeric(par1)
}
par2 <- as.numeric(par2)
par3 <- as.numeric(par3)
par4 <- as.numeric(par4)
par5 <- as.numeric(par5)
if (par6 == 'White Noise') par6 <- 'white' else par6 <- 'ma'
par7 <- as.numeric(par7)
if (par8 != '') par8 <- as.numeric(par8)
ox <- x
if (par8 == '') {
if (par2 == 0) {
x <- log(x)
} else {
x <- (x ^ par2 - 1) / par2
}
} else {
x <- log(x,base=par8)
}
if (par3 > 0) x <- diff(x,lag=1,difference=par3)
if (par4 > 0) x <- diff(x,lag=par5,difference=par4)
bitmap(file='picts.png')
op <- par(mfrow=c(2,1))
plot(ox,type='l',main='Original Time Series',xlab='time',ylab='value')
if (par8=='') {
mytitle <- paste('Working Time Series (lambda=',par2,', d=',par3,', D=',par4,')',sep='')
mysub <- paste('(lambda=',par2,', d=',par3,', D=',par4,', CI=', par7, ', CI type=',par6,')',sep='')
} else {
mytitle <- paste('Working Time Series (base=',par8,', d=',par3,', D=',par4,')',sep='')
mysub <- paste('(base=',par8,', d=',par3,', D=',par4,', CI=', par7, ', CI type=',par6,')',sep='')
}
plot(x,type='l', main=mytitle,xlab='time',ylab='value')
par(op)
dev.off()
bitmap(file='pic1.png')
racf <- acf(x, par1, main='Autocorrelation', xlab='time lag', ylab='ACF', ci.type=par6, ci=par7, sub=mysub)
dev.off()
bitmap(file='pic2.png')
rpacf <- pacf(x,par1,main='Partial Autocorrelation',xlab='lags',ylab='PACF',sub=mysub)
dev.off()
(myacf <- c(racf$acf))
(mypacf <- c(rpacf$acf))
lengthx <- length(x)
sqrtn <- sqrt(lengthx)
load(file='createtable')
a<-table.start()
a<-table.row.start(a)
a<-table.element(a,'Autocorrelation Function',4,TRUE)
a<-table.row.end(a)
a<-table.row.start(a)
a<-table.element(a,'Time lag k',header=TRUE)
a<-table.element(a,hyperlink('basics.htm','ACF(k)','click here for more information about the Autocorrelation Function'),header=TRUE)
a<-table.element(a,'T-STAT',header=TRUE)
a<-table.element(a,'P-value',header=TRUE)
a<-table.row.end(a)
for (i in 2:(par1+1)) {
a<-table.row.start(a)
a<-table.element(a,i-1,header=TRUE)
a<-table.element(a,round(myacf[i],6))
mytstat <- myacf[i]*sqrtn
a<-table.element(a,round(mytstat,4))
a<-table.element(a,round(1-pt(abs(mytstat),lengthx),6))
a<-table.row.end(a)
}
a<-table.end(a)
table.save(a,file='mytable.tab')
a<-table.start()
a<-table.row.start(a)
a<-table.element(a,'Partial Autocorrelation Function',4,TRUE)
a<-table.row.end(a)
a<-table.row.start(a)
a<-table.element(a,'Time lag k',header=TRUE)
a<-table.element(a,hyperlink('basics.htm','PACF(k)','click here for more information about the Partial Autocorrelation Function'),header=TRUE)
a<-table.element(a,'T-STAT',header=TRUE)
a<-table.element(a,'P-value',header=TRUE)
a<-table.row.end(a)
for (i in 1:par1) {
a<-table.row.start(a)
a<-table.element(a,i,header=TRUE)
a<-table.element(a,round(mypacf[i],6))
mytstat <- mypacf[i]*sqrtn
a<-table.element(a,round(mytstat,4))
a<-table.element(a,round(1-pt(abs(mytstat),lengthx),6))
a<-table.row.end(a)
}
a<-table.end(a)
table.save(a,file='mytable1.tab')