Free Statistics

of Irreproducible Research!

Author's title

Author*The author of this computation has been verified*
R Software Modulerwasp_multipleregression.wasp
Title produced by softwareMultiple Regression
Date of computationThu, 13 Nov 2014 19:46:46 +0000
Cite this page as followsStatistical Computations at FreeStatistics.org, Office for Research Development and Education, URL https://freestatistics.org/blog/index.php?v=date/2014/Nov/13/t141590805276na072ootvssdd.htm/, Retrieved Sun, 19 May 2024 10:20:09 +0000
Statistical Computations at FreeStatistics.org, Office for Research Development and Education, URL https://freestatistics.org/blog/index.php?pk=254616, Retrieved Sun, 19 May 2024 10:20:09 +0000
QR Codes:

Original text written by user:
IsPrivate?No (this computation is public)
User-defined keywords
Estimated Impact91
Family? (F = Feedback message, R = changed R code, M = changed R Module, P = changed Parameters, D = changed Data)
-     [Multiple Regression] [] [2013-11-04 07:18:26] [0307e7a6407eb638caabc417e3a6b260]
- RMPD  [Multiple Regression] [] [2014-11-13 18:59:36] [95c11abf048d3a1e472aeccb09199113]
-    D      [Multiple Regression] [] [2014-11-13 19:46:46] [d100ddac424efc880e37824ffef4fe9f] [Current]
-    D        [Multiple Regression] [] [2014-12-15 10:41:33] [2fea329c6e322b1612c5dc504f90c0ef]
- R PD          [Multiple Regression] [] [2014-12-15 11:11:17] [2fea329c6e322b1612c5dc504f90c0ef]
- R PD          [Multiple Regression] [] [2014-12-15 11:15:41] [2fea329c6e322b1612c5dc504f90c0ef]
- R PD          [Multiple Regression] [] [2014-12-15 11:20:26] [2fea329c6e322b1612c5dc504f90c0ef]
- R PD          [Multiple Regression] [] [2014-12-15 11:21:52] [2fea329c6e322b1612c5dc504f90c0ef]
Feedback Forum

Post a new message
Dataseries X:
1	1	0	5	0
1	0	0	1	0
1	1	0	5	0
1	0	0	3	1
1	1	0	3	1
1	0	0	2	0
1	1	0	4	0
0	0	0	1	1
1	1	0	6	0
0	0	0	3	1
1	1	0	4	1
1	0	1	2	1
1	1	0	1	1
1	0	1	3	0
0	1	0	2	0
1	0	1	4	0
1	1	0	2	1
0	0	1	0	0
1	1	0	3	0
1	0	0	2	1
0	1	0	1	0
1	0	0	7	1
1	1	0	3	1
1	0	0	5	1
1	1	0	5	1
1	0	0	4	1
0	1	0	2	0
1	1	0	3	1
1	0	0	3	1
1	1	1	1	1
1	1	0	5	1
1	0	1	2	1
0	1	0	1	1
1	0	1	4	1
1	1	1	3	1
1	0	0	3	1
0	1	1	2	1
1	0	0	3	1
1	1	0	1	1
0	0	0	4	0
0	1	0	1	1
1	0	0	5	1
1	1	1	4	1
1	0	0	4	1
1	0	1	4	1
0	0	0	2	0
0	1	0	1	1
0	1	1	2	0
1	0	0	3	1
1	0	0	2	1
0	1	1	4	1
0	1	0	2	0
1	0	0	8	1
1	0	0	5	1
1	0	0	2	1
1	0	1	5	1
1	0	0	5	1
1	0	0	3	0
1	0	0	4	1
1	0	0	5	1


Summary of computational transaction
Raw Inputview raw input (R code)
Raw Outputview raw output of R engine
Computing time4 seconds
R Server'Gwilym Jenkins' @ jenkins.wessa.net

\begin{tabular}{lllllllll}
\hline
Summary of computational transaction \tabularnewline
Raw Input & view raw input (R code)  \tabularnewline
Raw Output & view raw output of R engine  \tabularnewline
Computing time & 4 seconds \tabularnewline
R Server & 'Gwilym Jenkins' @ jenkins.wessa.net \tabularnewline
\hline
\end{tabular}
%Source: https://freestatistics.org/blog/index.php?pk=254616&T=0

[TABLE]
[ROW][C]Summary of computational transaction[/C][/ROW]
[ROW][C]Raw Input[/C][C]view raw input (R code) [/C][/ROW]
[ROW][C]Raw Output[/C][C]view raw output of R engine [/C][/ROW]
[ROW][C]Computing time[/C][C]4 seconds[/C][/ROW]
[ROW][C]R Server[/C][C]'Gwilym Jenkins' @ jenkins.wessa.net[/C][/ROW]
[/TABLE]
Source: https://freestatistics.org/blog/index.php?pk=254616&T=0

Globally Unique Identifier (entire table): ba.freestatistics.org/blog/index.php?pk=254616&T=0

As an alternative you can also use a QR Code:  

The GUIDs for individual cells are displayed in the table below:

Summary of computational transaction
Raw Inputview raw input (R code)
Raw Outputview raw output of R engine
Computing time4 seconds
R Server'Gwilym Jenkins' @ jenkins.wessa.net


Multiple Linear Regression - Estimated Regression Equation
Winst[t] = + 0.326332 -0.12707Plaats[t] -0.0132397Dag[t] + 0.106857Doelpunten[t] + 0.210487Voorsprong[t] + e[t]

\begin{tabular}{lllllllll}
\hline
Multiple Linear Regression - Estimated Regression Equation \tabularnewline
Winst[t] =  +  0.326332 -0.12707Plaats[t] -0.0132397Dag[t] +  0.106857Doelpunten[t] +  0.210487Voorsprong[t]  + e[t] \tabularnewline
\hline
\end{tabular}
%Source: https://freestatistics.org/blog/index.php?pk=254616&T=1

[TABLE]
[ROW][C]Multiple Linear Regression - Estimated Regression Equation[/C][/ROW]
[ROW][C]Winst[t] =  +  0.326332 -0.12707Plaats[t] -0.0132397Dag[t] +  0.106857Doelpunten[t] +  0.210487Voorsprong[t]  + e[t][/C][/ROW]
[/TABLE]
Source: https://freestatistics.org/blog/index.php?pk=254616&T=1

Globally Unique Identifier (entire table): ba.freestatistics.org/blog/index.php?pk=254616&T=1

As an alternative you can also use a QR Code:  

The GUIDs for individual cells are displayed in the table below:

Multiple Linear Regression - Estimated Regression Equation
Winst[t] = + 0.326332 -0.12707Plaats[t] -0.0132397Dag[t] + 0.106857Doelpunten[t] + 0.210487Voorsprong[t] + e[t]


Multiple Linear Regression - Ordinary Least Squares
VariableParameterS.D.T-STATH0: parameter = 02-tail p-value1-tail p-value
(Intercept)0.3263320.1492172.1870.03301620.0165081
Plaats-0.127070.101771-1.2490.2171020.108551
Dag-0.01323970.117411-0.11280.9106280.455314
Doelpunten0.1068570.03134673.4090.001227580.000613788
Voorsprong0.2104870.109381.9240.059490.029745

\begin{tabular}{lllllllll}
\hline
Multiple Linear Regression - Ordinary Least Squares \tabularnewline
Variable & Parameter & S.D. & T-STATH0: parameter = 0 & 2-tail p-value & 1-tail p-value \tabularnewline
(Intercept) & 0.326332 & 0.149217 & 2.187 & 0.0330162 & 0.0165081 \tabularnewline
Plaats & -0.12707 & 0.101771 & -1.249 & 0.217102 & 0.108551 \tabularnewline
Dag & -0.0132397 & 0.117411 & -0.1128 & 0.910628 & 0.455314 \tabularnewline
Doelpunten & 0.106857 & 0.0313467 & 3.409 & 0.00122758 & 0.000613788 \tabularnewline
Voorsprong & 0.210487 & 0.10938 & 1.924 & 0.05949 & 0.029745 \tabularnewline
\hline
\end{tabular}
%Source: https://freestatistics.org/blog/index.php?pk=254616&T=2

[TABLE]
[ROW][C]Multiple Linear Regression - Ordinary Least Squares[/C][/ROW]
[ROW][C]Variable[/C][C]Parameter[/C][C]S.D.[/C][C]T-STATH0: parameter = 0[/C][C]2-tail p-value[/C][C]1-tail p-value[/C][/ROW]
[ROW][C](Intercept)[/C][C]0.326332[/C][C]0.149217[/C][C]2.187[/C][C]0.0330162[/C][C]0.0165081[/C][/ROW]
[ROW][C]Plaats[/C][C]-0.12707[/C][C]0.101771[/C][C]-1.249[/C][C]0.217102[/C][C]0.108551[/C][/ROW]
[ROW][C]Dag[/C][C]-0.0132397[/C][C]0.117411[/C][C]-0.1128[/C][C]0.910628[/C][C]0.455314[/C][/ROW]
[ROW][C]Doelpunten[/C][C]0.106857[/C][C]0.0313467[/C][C]3.409[/C][C]0.00122758[/C][C]0.000613788[/C][/ROW]
[ROW][C]Voorsprong[/C][C]0.210487[/C][C]0.10938[/C][C]1.924[/C][C]0.05949[/C][C]0.029745[/C][/ROW]
[/TABLE]
Source: https://freestatistics.org/blog/index.php?pk=254616&T=2

Globally Unique Identifier (entire table): ba.freestatistics.org/blog/index.php?pk=254616&T=2

As an alternative you can also use a QR Code:  

The GUIDs for individual cells are displayed in the table below:

Multiple Linear Regression - Ordinary Least Squares
VariableParameterS.D.T-STATH0: parameter = 02-tail p-value1-tail p-value
(Intercept)0.3263320.1492172.1870.03301620.0165081
Plaats-0.127070.101771-1.2490.2171020.108551
Dag-0.01323970.117411-0.11280.9106280.455314
Doelpunten0.1068570.03134673.4090.001227580.000613788
Voorsprong0.2104870.109381.9240.059490.029745


Multiple Linear Regression - Regression Statistics
Multiple R0.53444
R-squared0.285626
Adjusted R-squared0.233672
F-TEST (value)5.49762
F-TEST (DF numerator)4
F-TEST (DF denominator)55
p-value0.000851391
Multiple Linear Regression - Residual Statistics
Residual Standard Deviation0.382259
Sum Squared Residuals8.03671

\begin{tabular}{lllllllll}
\hline
Multiple Linear Regression - Regression Statistics \tabularnewline
Multiple R & 0.53444 \tabularnewline
R-squared & 0.285626 \tabularnewline
Adjusted R-squared & 0.233672 \tabularnewline
F-TEST (value) & 5.49762 \tabularnewline
F-TEST (DF numerator) & 4 \tabularnewline
F-TEST (DF denominator) & 55 \tabularnewline
p-value & 0.000851391 \tabularnewline
Multiple Linear Regression - Residual Statistics \tabularnewline
Residual Standard Deviation & 0.382259 \tabularnewline
Sum Squared Residuals & 8.03671 \tabularnewline
\hline
\end{tabular}
%Source: https://freestatistics.org/blog/index.php?pk=254616&T=3

[TABLE]
[ROW][C]Multiple Linear Regression - Regression Statistics[/C][/ROW]
[ROW][C]Multiple R[/C][C]0.53444[/C][/ROW]
[ROW][C]R-squared[/C][C]0.285626[/C][/ROW]
[ROW][C]Adjusted R-squared[/C][C]0.233672[/C][/ROW]
[ROW][C]F-TEST (value)[/C][C]5.49762[/C][/ROW]
[ROW][C]F-TEST (DF numerator)[/C][C]4[/C][/ROW]
[ROW][C]F-TEST (DF denominator)[/C][C]55[/C][/ROW]
[ROW][C]p-value[/C][C]0.000851391[/C][/ROW]
[ROW][C]Multiple Linear Regression - Residual Statistics[/C][/ROW]
[ROW][C]Residual Standard Deviation[/C][C]0.382259[/C][/ROW]
[ROW][C]Sum Squared Residuals[/C][C]8.03671[/C][/ROW]
[/TABLE]
Source: https://freestatistics.org/blog/index.php?pk=254616&T=3

Globally Unique Identifier (entire table): ba.freestatistics.org/blog/index.php?pk=254616&T=3

As an alternative you can also use a QR Code:  

The GUIDs for individual cells are displayed in the table below:

Multiple Linear Regression - Regression Statistics
Multiple R0.53444
R-squared0.285626
Adjusted R-squared0.233672
F-TEST (value)5.49762
F-TEST (DF numerator)4
F-TEST (DF denominator)55
p-value0.000851391
Multiple Linear Regression - Residual Statistics
Residual Standard Deviation0.382259
Sum Squared Residuals8.03671


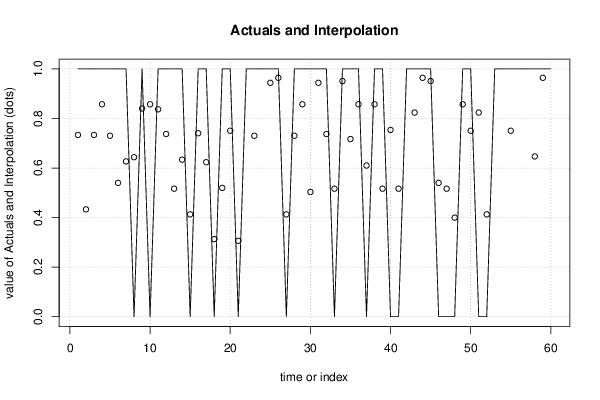
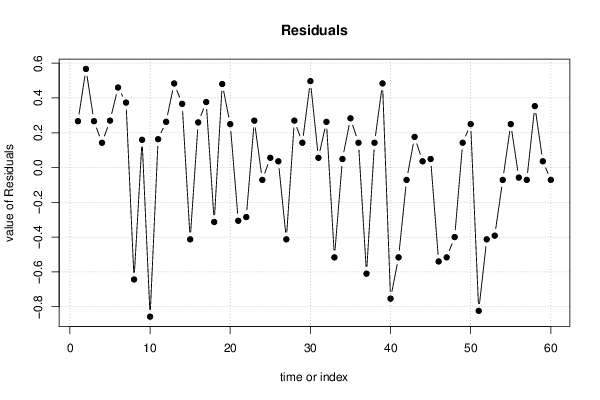
Multiple Linear Regression - Actuals, Interpolation, and Residuals
Time or IndexActualsInterpolationForecastResidualsPrediction Error
110.7335450.266455
210.4331880.566812
310.7335450.266455
410.8573880.142612
510.7303180.269682
610.5400450.459955
710.6266880.373312
800.643675-0.643675
910.8404020.159598
1000.857388-0.857388
1110.8371750.162825
1210.7372920.262708
1310.5166050.483395
1410.6336620.366338
1500.412975-0.412975
1610.7405190.259481
1710.6234610.376539
1800.313092-0.313092
1910.5198310.480169
2010.7505320.249468
2100.306118-0.306118
2211.28482-0.284815
2310.7303180.269682
2411.0711-0.0711018
2510.9440310.0559686
2610.9642450.0357549
2700.412975-0.412975
2810.7303180.269682
2910.8573880.142612
3010.5033650.496635
3110.9440310.0559686
3210.7372920.262708
3300.516605-0.516605
3410.9510050.0489946
3510.7170780.282922
3610.8573880.142612
3700.610222-0.610222
3810.8573880.142612
3910.5166050.483395
4000.753758-0.753758
4100.516605-0.516605
4211.0711-0.0711018
4310.8239350.176065
4410.9642450.0357549
4510.9510050.0489946
4600.540045-0.540045
4700.516605-0.516605
4800.399735-0.399735
4910.8573880.142612
5010.7505320.249468
5100.823935-0.823935
5200.412975-0.412975
5311.39167-0.391672
5411.0711-0.0711018
5510.7505320.249468
5611.05786-0.0578621
5711.0711-0.0711018
5810.6469020.353098
5910.9642450.0357549
6011.0711-0.0711018

\begin{tabular}{lllllllll}
\hline
Multiple Linear Regression - Actuals, Interpolation, and Residuals \tabularnewline
Time or Index & Actuals & InterpolationForecast & ResidualsPrediction Error \tabularnewline
1 & 1 & 0.733545 & 0.266455 \tabularnewline
2 & 1 & 0.433188 & 0.566812 \tabularnewline
3 & 1 & 0.733545 & 0.266455 \tabularnewline
4 & 1 & 0.857388 & 0.142612 \tabularnewline
5 & 1 & 0.730318 & 0.269682 \tabularnewline
6 & 1 & 0.540045 & 0.459955 \tabularnewline
7 & 1 & 0.626688 & 0.373312 \tabularnewline
8 & 0 & 0.643675 & -0.643675 \tabularnewline
9 & 1 & 0.840402 & 0.159598 \tabularnewline
10 & 0 & 0.857388 & -0.857388 \tabularnewline
11 & 1 & 0.837175 & 0.162825 \tabularnewline
12 & 1 & 0.737292 & 0.262708 \tabularnewline
13 & 1 & 0.516605 & 0.483395 \tabularnewline
14 & 1 & 0.633662 & 0.366338 \tabularnewline
15 & 0 & 0.412975 & -0.412975 \tabularnewline
16 & 1 & 0.740519 & 0.259481 \tabularnewline
17 & 1 & 0.623461 & 0.376539 \tabularnewline
18 & 0 & 0.313092 & -0.313092 \tabularnewline
19 & 1 & 0.519831 & 0.480169 \tabularnewline
20 & 1 & 0.750532 & 0.249468 \tabularnewline
21 & 0 & 0.306118 & -0.306118 \tabularnewline
22 & 1 & 1.28482 & -0.284815 \tabularnewline
23 & 1 & 0.730318 & 0.269682 \tabularnewline
24 & 1 & 1.0711 & -0.0711018 \tabularnewline
25 & 1 & 0.944031 & 0.0559686 \tabularnewline
26 & 1 & 0.964245 & 0.0357549 \tabularnewline
27 & 0 & 0.412975 & -0.412975 \tabularnewline
28 & 1 & 0.730318 & 0.269682 \tabularnewline
29 & 1 & 0.857388 & 0.142612 \tabularnewline
30 & 1 & 0.503365 & 0.496635 \tabularnewline
31 & 1 & 0.944031 & 0.0559686 \tabularnewline
32 & 1 & 0.737292 & 0.262708 \tabularnewline
33 & 0 & 0.516605 & -0.516605 \tabularnewline
34 & 1 & 0.951005 & 0.0489946 \tabularnewline
35 & 1 & 0.717078 & 0.282922 \tabularnewline
36 & 1 & 0.857388 & 0.142612 \tabularnewline
37 & 0 & 0.610222 & -0.610222 \tabularnewline
38 & 1 & 0.857388 & 0.142612 \tabularnewline
39 & 1 & 0.516605 & 0.483395 \tabularnewline
40 & 0 & 0.753758 & -0.753758 \tabularnewline
41 & 0 & 0.516605 & -0.516605 \tabularnewline
42 & 1 & 1.0711 & -0.0711018 \tabularnewline
43 & 1 & 0.823935 & 0.176065 \tabularnewline
44 & 1 & 0.964245 & 0.0357549 \tabularnewline
45 & 1 & 0.951005 & 0.0489946 \tabularnewline
46 & 0 & 0.540045 & -0.540045 \tabularnewline
47 & 0 & 0.516605 & -0.516605 \tabularnewline
48 & 0 & 0.399735 & -0.399735 \tabularnewline
49 & 1 & 0.857388 & 0.142612 \tabularnewline
50 & 1 & 0.750532 & 0.249468 \tabularnewline
51 & 0 & 0.823935 & -0.823935 \tabularnewline
52 & 0 & 0.412975 & -0.412975 \tabularnewline
53 & 1 & 1.39167 & -0.391672 \tabularnewline
54 & 1 & 1.0711 & -0.0711018 \tabularnewline
55 & 1 & 0.750532 & 0.249468 \tabularnewline
56 & 1 & 1.05786 & -0.0578621 \tabularnewline
57 & 1 & 1.0711 & -0.0711018 \tabularnewline
58 & 1 & 0.646902 & 0.353098 \tabularnewline
59 & 1 & 0.964245 & 0.0357549 \tabularnewline
60 & 1 & 1.0711 & -0.0711018 \tabularnewline
\hline
\end{tabular}
%Source: https://freestatistics.org/blog/index.php?pk=254616&T=4

[TABLE]
[ROW][C]Multiple Linear Regression - Actuals, Interpolation, and Residuals[/C][/ROW]
[ROW][C]Time or Index[/C][C]Actuals[/C][C]InterpolationForecast[/C][C]ResidualsPrediction Error[/C][/ROW]
[ROW][C]1[/C][C]1[/C][C]0.733545[/C][C]0.266455[/C][/ROW]
[ROW][C]2[/C][C]1[/C][C]0.433188[/C][C]0.566812[/C][/ROW]
[ROW][C]3[/C][C]1[/C][C]0.733545[/C][C]0.266455[/C][/ROW]
[ROW][C]4[/C][C]1[/C][C]0.857388[/C][C]0.142612[/C][/ROW]
[ROW][C]5[/C][C]1[/C][C]0.730318[/C][C]0.269682[/C][/ROW]
[ROW][C]6[/C][C]1[/C][C]0.540045[/C][C]0.459955[/C][/ROW]
[ROW][C]7[/C][C]1[/C][C]0.626688[/C][C]0.373312[/C][/ROW]
[ROW][C]8[/C][C]0[/C][C]0.643675[/C][C]-0.643675[/C][/ROW]
[ROW][C]9[/C][C]1[/C][C]0.840402[/C][C]0.159598[/C][/ROW]
[ROW][C]10[/C][C]0[/C][C]0.857388[/C][C]-0.857388[/C][/ROW]
[ROW][C]11[/C][C]1[/C][C]0.837175[/C][C]0.162825[/C][/ROW]
[ROW][C]12[/C][C]1[/C][C]0.737292[/C][C]0.262708[/C][/ROW]
[ROW][C]13[/C][C]1[/C][C]0.516605[/C][C]0.483395[/C][/ROW]
[ROW][C]14[/C][C]1[/C][C]0.633662[/C][C]0.366338[/C][/ROW]
[ROW][C]15[/C][C]0[/C][C]0.412975[/C][C]-0.412975[/C][/ROW]
[ROW][C]16[/C][C]1[/C][C]0.740519[/C][C]0.259481[/C][/ROW]
[ROW][C]17[/C][C]1[/C][C]0.623461[/C][C]0.376539[/C][/ROW]
[ROW][C]18[/C][C]0[/C][C]0.313092[/C][C]-0.313092[/C][/ROW]
[ROW][C]19[/C][C]1[/C][C]0.519831[/C][C]0.480169[/C][/ROW]
[ROW][C]20[/C][C]1[/C][C]0.750532[/C][C]0.249468[/C][/ROW]
[ROW][C]21[/C][C]0[/C][C]0.306118[/C][C]-0.306118[/C][/ROW]
[ROW][C]22[/C][C]1[/C][C]1.28482[/C][C]-0.284815[/C][/ROW]
[ROW][C]23[/C][C]1[/C][C]0.730318[/C][C]0.269682[/C][/ROW]
[ROW][C]24[/C][C]1[/C][C]1.0711[/C][C]-0.0711018[/C][/ROW]
[ROW][C]25[/C][C]1[/C][C]0.944031[/C][C]0.0559686[/C][/ROW]
[ROW][C]26[/C][C]1[/C][C]0.964245[/C][C]0.0357549[/C][/ROW]
[ROW][C]27[/C][C]0[/C][C]0.412975[/C][C]-0.412975[/C][/ROW]
[ROW][C]28[/C][C]1[/C][C]0.730318[/C][C]0.269682[/C][/ROW]
[ROW][C]29[/C][C]1[/C][C]0.857388[/C][C]0.142612[/C][/ROW]
[ROW][C]30[/C][C]1[/C][C]0.503365[/C][C]0.496635[/C][/ROW]
[ROW][C]31[/C][C]1[/C][C]0.944031[/C][C]0.0559686[/C][/ROW]
[ROW][C]32[/C][C]1[/C][C]0.737292[/C][C]0.262708[/C][/ROW]
[ROW][C]33[/C][C]0[/C][C]0.516605[/C][C]-0.516605[/C][/ROW]
[ROW][C]34[/C][C]1[/C][C]0.951005[/C][C]0.0489946[/C][/ROW]
[ROW][C]35[/C][C]1[/C][C]0.717078[/C][C]0.282922[/C][/ROW]
[ROW][C]36[/C][C]1[/C][C]0.857388[/C][C]0.142612[/C][/ROW]
[ROW][C]37[/C][C]0[/C][C]0.610222[/C][C]-0.610222[/C][/ROW]
[ROW][C]38[/C][C]1[/C][C]0.857388[/C][C]0.142612[/C][/ROW]
[ROW][C]39[/C][C]1[/C][C]0.516605[/C][C]0.483395[/C][/ROW]
[ROW][C]40[/C][C]0[/C][C]0.753758[/C][C]-0.753758[/C][/ROW]
[ROW][C]41[/C][C]0[/C][C]0.516605[/C][C]-0.516605[/C][/ROW]
[ROW][C]42[/C][C]1[/C][C]1.0711[/C][C]-0.0711018[/C][/ROW]
[ROW][C]43[/C][C]1[/C][C]0.823935[/C][C]0.176065[/C][/ROW]
[ROW][C]44[/C][C]1[/C][C]0.964245[/C][C]0.0357549[/C][/ROW]
[ROW][C]45[/C][C]1[/C][C]0.951005[/C][C]0.0489946[/C][/ROW]
[ROW][C]46[/C][C]0[/C][C]0.540045[/C][C]-0.540045[/C][/ROW]
[ROW][C]47[/C][C]0[/C][C]0.516605[/C][C]-0.516605[/C][/ROW]
[ROW][C]48[/C][C]0[/C][C]0.399735[/C][C]-0.399735[/C][/ROW]
[ROW][C]49[/C][C]1[/C][C]0.857388[/C][C]0.142612[/C][/ROW]
[ROW][C]50[/C][C]1[/C][C]0.750532[/C][C]0.249468[/C][/ROW]
[ROW][C]51[/C][C]0[/C][C]0.823935[/C][C]-0.823935[/C][/ROW]
[ROW][C]52[/C][C]0[/C][C]0.412975[/C][C]-0.412975[/C][/ROW]
[ROW][C]53[/C][C]1[/C][C]1.39167[/C][C]-0.391672[/C][/ROW]
[ROW][C]54[/C][C]1[/C][C]1.0711[/C][C]-0.0711018[/C][/ROW]
[ROW][C]55[/C][C]1[/C][C]0.750532[/C][C]0.249468[/C][/ROW]
[ROW][C]56[/C][C]1[/C][C]1.05786[/C][C]-0.0578621[/C][/ROW]
[ROW][C]57[/C][C]1[/C][C]1.0711[/C][C]-0.0711018[/C][/ROW]
[ROW][C]58[/C][C]1[/C][C]0.646902[/C][C]0.353098[/C][/ROW]
[ROW][C]59[/C][C]1[/C][C]0.964245[/C][C]0.0357549[/C][/ROW]
[ROW][C]60[/C][C]1[/C][C]1.0711[/C][C]-0.0711018[/C][/ROW]
[/TABLE]
Source: https://freestatistics.org/blog/index.php?pk=254616&T=4

Globally Unique Identifier (entire table): ba.freestatistics.org/blog/index.php?pk=254616&T=4

As an alternative you can also use a QR Code:  

The GUIDs for individual cells are displayed in the table below:

Multiple Linear Regression - Actuals, Interpolation, and Residuals
Time or IndexActualsInterpolationForecastResidualsPrediction Error
110.7335450.266455
210.4331880.566812
310.7335450.266455
410.8573880.142612
510.7303180.269682
610.5400450.459955
710.6266880.373312
800.643675-0.643675
910.8404020.159598
1000.857388-0.857388
1110.8371750.162825
1210.7372920.262708
1310.5166050.483395
1410.6336620.366338
1500.412975-0.412975
1610.7405190.259481
1710.6234610.376539
1800.313092-0.313092
1910.5198310.480169
2010.7505320.249468
2100.306118-0.306118
2211.28482-0.284815
2310.7303180.269682
2411.0711-0.0711018
2510.9440310.0559686
2610.9642450.0357549
2700.412975-0.412975
2810.7303180.269682
2910.8573880.142612
3010.5033650.496635
3110.9440310.0559686
3210.7372920.262708
3300.516605-0.516605
3410.9510050.0489946
3510.7170780.282922
3610.8573880.142612
3700.610222-0.610222
3810.8573880.142612
3910.5166050.483395
4000.753758-0.753758
4100.516605-0.516605
4211.0711-0.0711018
4310.8239350.176065
4410.9642450.0357549
4510.9510050.0489946
4600.540045-0.540045
4700.516605-0.516605
4800.399735-0.399735
4910.8573880.142612
5010.7505320.249468
5100.823935-0.823935
5200.412975-0.412975
5311.39167-0.391672
5411.0711-0.0711018
5510.7505320.249468
5611.05786-0.0578621
5711.0711-0.0711018
5810.6469020.353098
5910.9642450.0357549
6011.0711-0.0711018


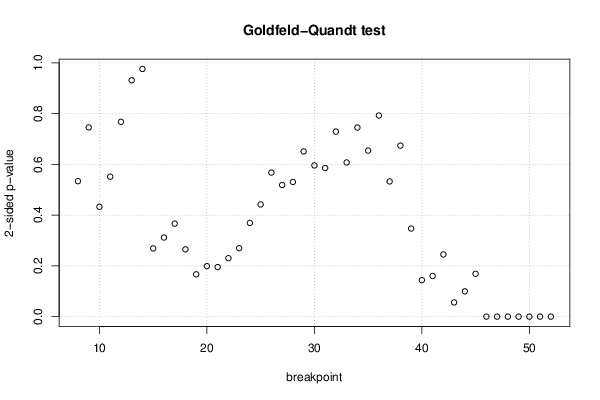
Goldfeld-Quandt test for Heteroskedasticity
p-valuesAlternative Hypothesis
breakpoint indexgreater2-sidedless
80.7330670.5338660.266933
90.6272150.7455710.372785
100.7835770.4328460.216423
110.7242950.551410.275705
120.6162050.767590.383795
130.5343770.9312470.465623
140.4879450.9758910.512055
150.8655910.2688180.134409
160.8441350.3117290.155865
170.8168050.366390.183195
180.8674720.2650550.132528
190.9165820.1668350.0834177
200.9004420.1991170.0995584
210.9023870.1952260.0976129
220.8848290.2303430.115171
230.8651530.2696930.134847
240.8154170.3691660.184583
250.7789510.4420990.221049
260.7161910.5676170.283809
270.7406190.5187630.259381
280.7346810.5306380.265319
290.6745620.6508760.325438
300.7021310.5957380.297869
310.7072620.5854760.292738
320.6354420.7291170.364558
330.6962880.6074250.303712
340.6275570.7448870.372443
350.6728070.6543870.327193
360.6037680.7924640.396232
370.733610.532780.26639
380.6630770.6738460.336923
390.8264290.3471430.173571
400.9280080.1439840.0719918
410.9198320.1603360.080168
420.8774670.2450660.122533
430.9719530.05609360.0280468
440.9501350.09972960.0498648
450.9155650.168870.0844348
4615.63414e-1412.81707e-141
4716.30263e-1213.15132e-121
4816.19208e-1043.09604e-104
4911.20179e-906.00894e-91
5015.76898e-772.88449e-77
5115.47169e-642.73585e-64
5213.39642e-461.69821e-46

\begin{tabular}{lllllllll}
\hline
Goldfeld-Quandt test for Heteroskedasticity \tabularnewline
p-values & Alternative Hypothesis \tabularnewline
breakpoint index & greater & 2-sided & less \tabularnewline
8 & 0.733067 & 0.533866 & 0.266933 \tabularnewline
9 & 0.627215 & 0.745571 & 0.372785 \tabularnewline
10 & 0.783577 & 0.432846 & 0.216423 \tabularnewline
11 & 0.724295 & 0.55141 & 0.275705 \tabularnewline
12 & 0.616205 & 0.76759 & 0.383795 \tabularnewline
13 & 0.534377 & 0.931247 & 0.465623 \tabularnewline
14 & 0.487945 & 0.975891 & 0.512055 \tabularnewline
15 & 0.865591 & 0.268818 & 0.134409 \tabularnewline
16 & 0.844135 & 0.311729 & 0.155865 \tabularnewline
17 & 0.816805 & 0.36639 & 0.183195 \tabularnewline
18 & 0.867472 & 0.265055 & 0.132528 \tabularnewline
19 & 0.916582 & 0.166835 & 0.0834177 \tabularnewline
20 & 0.900442 & 0.199117 & 0.0995584 \tabularnewline
21 & 0.902387 & 0.195226 & 0.0976129 \tabularnewline
22 & 0.884829 & 0.230343 & 0.115171 \tabularnewline
23 & 0.865153 & 0.269693 & 0.134847 \tabularnewline
24 & 0.815417 & 0.369166 & 0.184583 \tabularnewline
25 & 0.778951 & 0.442099 & 0.221049 \tabularnewline
26 & 0.716191 & 0.567617 & 0.283809 \tabularnewline
27 & 0.740619 & 0.518763 & 0.259381 \tabularnewline
28 & 0.734681 & 0.530638 & 0.265319 \tabularnewline
29 & 0.674562 & 0.650876 & 0.325438 \tabularnewline
30 & 0.702131 & 0.595738 & 0.297869 \tabularnewline
31 & 0.707262 & 0.585476 & 0.292738 \tabularnewline
32 & 0.635442 & 0.729117 & 0.364558 \tabularnewline
33 & 0.696288 & 0.607425 & 0.303712 \tabularnewline
34 & 0.627557 & 0.744887 & 0.372443 \tabularnewline
35 & 0.672807 & 0.654387 & 0.327193 \tabularnewline
36 & 0.603768 & 0.792464 & 0.396232 \tabularnewline
37 & 0.73361 & 0.53278 & 0.26639 \tabularnewline
38 & 0.663077 & 0.673846 & 0.336923 \tabularnewline
39 & 0.826429 & 0.347143 & 0.173571 \tabularnewline
40 & 0.928008 & 0.143984 & 0.0719918 \tabularnewline
41 & 0.919832 & 0.160336 & 0.080168 \tabularnewline
42 & 0.877467 & 0.245066 & 0.122533 \tabularnewline
43 & 0.971953 & 0.0560936 & 0.0280468 \tabularnewline
44 & 0.950135 & 0.0997296 & 0.0498648 \tabularnewline
45 & 0.915565 & 0.16887 & 0.0844348 \tabularnewline
46 & 1 & 5.63414e-141 & 2.81707e-141 \tabularnewline
47 & 1 & 6.30263e-121 & 3.15132e-121 \tabularnewline
48 & 1 & 6.19208e-104 & 3.09604e-104 \tabularnewline
49 & 1 & 1.20179e-90 & 6.00894e-91 \tabularnewline
50 & 1 & 5.76898e-77 & 2.88449e-77 \tabularnewline
51 & 1 & 5.47169e-64 & 2.73585e-64 \tabularnewline
52 & 1 & 3.39642e-46 & 1.69821e-46 \tabularnewline
\hline
\end{tabular}
%Source: https://freestatistics.org/blog/index.php?pk=254616&T=5

[TABLE]
[ROW][C]Goldfeld-Quandt test for Heteroskedasticity[/C][/ROW]
[ROW][C]p-values[/C][C]Alternative Hypothesis[/C][/ROW]
[ROW][C]breakpoint index[/C][C]greater[/C][C]2-sided[/C][C]less[/C][/ROW]
[ROW][C]8[/C][C]0.733067[/C][C]0.533866[/C][C]0.266933[/C][/ROW]
[ROW][C]9[/C][C]0.627215[/C][C]0.745571[/C][C]0.372785[/C][/ROW]
[ROW][C]10[/C][C]0.783577[/C][C]0.432846[/C][C]0.216423[/C][/ROW]
[ROW][C]11[/C][C]0.724295[/C][C]0.55141[/C][C]0.275705[/C][/ROW]
[ROW][C]12[/C][C]0.616205[/C][C]0.76759[/C][C]0.383795[/C][/ROW]
[ROW][C]13[/C][C]0.534377[/C][C]0.931247[/C][C]0.465623[/C][/ROW]
[ROW][C]14[/C][C]0.487945[/C][C]0.975891[/C][C]0.512055[/C][/ROW]
[ROW][C]15[/C][C]0.865591[/C][C]0.268818[/C][C]0.134409[/C][/ROW]
[ROW][C]16[/C][C]0.844135[/C][C]0.311729[/C][C]0.155865[/C][/ROW]
[ROW][C]17[/C][C]0.816805[/C][C]0.36639[/C][C]0.183195[/C][/ROW]
[ROW][C]18[/C][C]0.867472[/C][C]0.265055[/C][C]0.132528[/C][/ROW]
[ROW][C]19[/C][C]0.916582[/C][C]0.166835[/C][C]0.0834177[/C][/ROW]
[ROW][C]20[/C][C]0.900442[/C][C]0.199117[/C][C]0.0995584[/C][/ROW]
[ROW][C]21[/C][C]0.902387[/C][C]0.195226[/C][C]0.0976129[/C][/ROW]
[ROW][C]22[/C][C]0.884829[/C][C]0.230343[/C][C]0.115171[/C][/ROW]
[ROW][C]23[/C][C]0.865153[/C][C]0.269693[/C][C]0.134847[/C][/ROW]
[ROW][C]24[/C][C]0.815417[/C][C]0.369166[/C][C]0.184583[/C][/ROW]
[ROW][C]25[/C][C]0.778951[/C][C]0.442099[/C][C]0.221049[/C][/ROW]
[ROW][C]26[/C][C]0.716191[/C][C]0.567617[/C][C]0.283809[/C][/ROW]
[ROW][C]27[/C][C]0.740619[/C][C]0.518763[/C][C]0.259381[/C][/ROW]
[ROW][C]28[/C][C]0.734681[/C][C]0.530638[/C][C]0.265319[/C][/ROW]
[ROW][C]29[/C][C]0.674562[/C][C]0.650876[/C][C]0.325438[/C][/ROW]
[ROW][C]30[/C][C]0.702131[/C][C]0.595738[/C][C]0.297869[/C][/ROW]
[ROW][C]31[/C][C]0.707262[/C][C]0.585476[/C][C]0.292738[/C][/ROW]
[ROW][C]32[/C][C]0.635442[/C][C]0.729117[/C][C]0.364558[/C][/ROW]
[ROW][C]33[/C][C]0.696288[/C][C]0.607425[/C][C]0.303712[/C][/ROW]
[ROW][C]34[/C][C]0.627557[/C][C]0.744887[/C][C]0.372443[/C][/ROW]
[ROW][C]35[/C][C]0.672807[/C][C]0.654387[/C][C]0.327193[/C][/ROW]
[ROW][C]36[/C][C]0.603768[/C][C]0.792464[/C][C]0.396232[/C][/ROW]
[ROW][C]37[/C][C]0.73361[/C][C]0.53278[/C][C]0.26639[/C][/ROW]
[ROW][C]38[/C][C]0.663077[/C][C]0.673846[/C][C]0.336923[/C][/ROW]
[ROW][C]39[/C][C]0.826429[/C][C]0.347143[/C][C]0.173571[/C][/ROW]
[ROW][C]40[/C][C]0.928008[/C][C]0.143984[/C][C]0.0719918[/C][/ROW]
[ROW][C]41[/C][C]0.919832[/C][C]0.160336[/C][C]0.080168[/C][/ROW]
[ROW][C]42[/C][C]0.877467[/C][C]0.245066[/C][C]0.122533[/C][/ROW]
[ROW][C]43[/C][C]0.971953[/C][C]0.0560936[/C][C]0.0280468[/C][/ROW]
[ROW][C]44[/C][C]0.950135[/C][C]0.0997296[/C][C]0.0498648[/C][/ROW]
[ROW][C]45[/C][C]0.915565[/C][C]0.16887[/C][C]0.0844348[/C][/ROW]
[ROW][C]46[/C][C]1[/C][C]5.63414e-141[/C][C]2.81707e-141[/C][/ROW]
[ROW][C]47[/C][C]1[/C][C]6.30263e-121[/C][C]3.15132e-121[/C][/ROW]
[ROW][C]48[/C][C]1[/C][C]6.19208e-104[/C][C]3.09604e-104[/C][/ROW]
[ROW][C]49[/C][C]1[/C][C]1.20179e-90[/C][C]6.00894e-91[/C][/ROW]
[ROW][C]50[/C][C]1[/C][C]5.76898e-77[/C][C]2.88449e-77[/C][/ROW]
[ROW][C]51[/C][C]1[/C][C]5.47169e-64[/C][C]2.73585e-64[/C][/ROW]
[ROW][C]52[/C][C]1[/C][C]3.39642e-46[/C][C]1.69821e-46[/C][/ROW]
[/TABLE]
Source: https://freestatistics.org/blog/index.php?pk=254616&T=5

Globally Unique Identifier (entire table): ba.freestatistics.org/blog/index.php?pk=254616&T=5

As an alternative you can also use a QR Code:  

The GUIDs for individual cells are displayed in the table below:

Goldfeld-Quandt test for Heteroskedasticity
p-valuesAlternative Hypothesis
breakpoint indexgreater2-sidedless
80.7330670.5338660.266933
90.6272150.7455710.372785
100.7835770.4328460.216423
110.7242950.551410.275705
120.6162050.767590.383795
130.5343770.9312470.465623
140.4879450.9758910.512055
150.8655910.2688180.134409
160.8441350.3117290.155865
170.8168050.366390.183195
180.8674720.2650550.132528
190.9165820.1668350.0834177
200.9004420.1991170.0995584
210.9023870.1952260.0976129
220.8848290.2303430.115171
230.8651530.2696930.134847
240.8154170.3691660.184583
250.7789510.4420990.221049
260.7161910.5676170.283809
270.7406190.5187630.259381
280.7346810.5306380.265319
290.6745620.6508760.325438
300.7021310.5957380.297869
310.7072620.5854760.292738
320.6354420.7291170.364558
330.6962880.6074250.303712
340.6275570.7448870.372443
350.6728070.6543870.327193
360.6037680.7924640.396232
370.733610.532780.26639
380.6630770.6738460.336923
390.8264290.3471430.173571
400.9280080.1439840.0719918
410.9198320.1603360.080168
420.8774670.2450660.122533
430.9719530.05609360.0280468
440.9501350.09972960.0498648
450.9155650.168870.0844348
4615.63414e-1412.81707e-141
4716.30263e-1213.15132e-121
4816.19208e-1043.09604e-104
4911.20179e-906.00894e-91
5015.76898e-772.88449e-77
5115.47169e-642.73585e-64
5213.39642e-461.69821e-46


Meta Analysis of Goldfeld-Quandt test for Heteroskedasticity
Description# significant tests% significant testsOK/NOK
1% type I error level70.155556NOK
5% type I error level70.155556NOK
10% type I error level90.2NOK

\begin{tabular}{lllllllll}
\hline
Meta Analysis of Goldfeld-Quandt test for Heteroskedasticity \tabularnewline
Description & # significant tests & % significant tests & OK/NOK \tabularnewline
1% type I error level & 7 & 0.155556 & NOK \tabularnewline
5% type I error level & 7 & 0.155556 & NOK \tabularnewline
10% type I error level & 9 & 0.2 & NOK \tabularnewline
\hline
\end{tabular}
%Source: https://freestatistics.org/blog/index.php?pk=254616&T=6

[TABLE]
[ROW][C]Meta Analysis of Goldfeld-Quandt test for Heteroskedasticity[/C][/ROW]
[ROW][C]Description[/C][C]# significant tests[/C][C]% significant tests[/C][C]OK/NOK[/C][/ROW]
[ROW][C]1% type I error level[/C][C]7[/C][C]0.155556[/C][C]NOK[/C][/ROW]
[ROW][C]5% type I error level[/C][C]7[/C][C]0.155556[/C][C]NOK[/C][/ROW]
[ROW][C]10% type I error level[/C][C]9[/C][C]0.2[/C][C]NOK[/C][/ROW]
[/TABLE]
Source: https://freestatistics.org/blog/index.php?pk=254616&T=6

Globally Unique Identifier (entire table): ba.freestatistics.org/blog/index.php?pk=254616&T=6

As an alternative you can also use a QR Code:  

The GUIDs for individual cells are displayed in the table below:

Meta Analysis of Goldfeld-Quandt test for Heteroskedasticity
Description# significant tests% significant testsOK/NOK
1% type I error level70.155556NOK
5% type I error level70.155556NOK
10% type I error level90.2NOK


Parameters (Session):
par1 = 1 ; par2 = Do not include Seasonal Dummies ; par3 = No Linear Trend ;
Parameters (R input):
par1 = 1 ; par2 = Do not include Seasonal Dummies ; par3 = No Linear Trend ;
R code (references can be found in the software module):
library(lattice)
library(lmtest)
n25 <- 25 #minimum number of obs. for Goldfeld-Quandt test
par1 <- as.numeric(par1)
x <- t(y)
k <- length(x[1,])
n <- length(x[,1])
x1 <- cbind(x[,par1], x[,1:k!=par1])
mycolnames <- c(colnames(x)[par1], colnames(x)[1:k!=par1])
colnames(x1) <- mycolnames #colnames(x)[par1]
x <- x1
if (par3 == 'First Differences'){
x2 <- array(0, dim=c(n-1,k), dimnames=list(1:(n-1), paste('(1-B)',colnames(x),sep='')))
for (i in 1:n-1) {
for (j in 1:k) {
x2[i,j] <- x[i+1,j] - x[i,j]
}
}
x <- x2
}
if (par2 == 'Include Monthly Dummies'){
x2 <- array(0, dim=c(n,11), dimnames=list(1:n, paste('M', seq(1:11), sep ='')))
for (i in 1:11){
x2[seq(i,n,12),i] <- 1
}
x <- cbind(x, x2)
}
if (par2 == 'Include Quarterly Dummies'){
x2 <- array(0, dim=c(n,3), dimnames=list(1:n, paste('Q', seq(1:3), sep ='')))
for (i in 1:3){
x2[seq(i,n,4),i] <- 1
}
x <- cbind(x, x2)
}
k <- length(x[1,])
if (par3 == 'Linear Trend'){
x <- cbind(x, c(1:n))
colnames(x)[k+1] <- 't'
}
x
k <- length(x[1,])
df <- as.data.frame(x)
(mylm <- lm(df))
(mysum <- summary(mylm))
if (n > n25) {
kp3 <- k + 3
nmkm3 <- n - k - 3
gqarr <- array(NA, dim=c(nmkm3-kp3+1,3))
numgqtests <- 0
numsignificant1 <- 0
numsignificant5 <- 0
numsignificant10 <- 0
for (mypoint in kp3:nmkm3) {
j <- 0
numgqtests <- numgqtests + 1
for (myalt in c('greater', 'two.sided', 'less')) {
j <- j + 1
gqarr[mypoint-kp3+1,j] <- gqtest(mylm, point=mypoint, alternative=myalt)$p.value
}
if (gqarr[mypoint-kp3+1,2] < 0.01) numsignificant1 <- numsignificant1 + 1
if (gqarr[mypoint-kp3+1,2] < 0.05) numsignificant5 <- numsignificant5 + 1
if (gqarr[mypoint-kp3+1,2] < 0.10) numsignificant10 <- numsignificant10 + 1
}
gqarr
}
bitmap(file='test0.png')
plot(x[,1], type='l', main='Actuals and Interpolation', ylab='value of Actuals and Interpolation (dots)', xlab='time or index')
points(x[,1]-mysum$resid)
grid()
dev.off()
bitmap(file='test1.png')
plot(mysum$resid, type='b', pch=19, main='Residuals', ylab='value of Residuals', xlab='time or index')
grid()
dev.off()
bitmap(file='test2.png')
hist(mysum$resid, main='Residual Histogram', xlab='values of Residuals')
grid()
dev.off()
bitmap(file='test3.png')
densityplot(~mysum$resid,col='black',main='Residual Density Plot', xlab='values of Residuals')
dev.off()
bitmap(file='test4.png')
qqnorm(mysum$resid, main='Residual Normal Q-Q Plot')
qqline(mysum$resid)
grid()
dev.off()
(myerror <- as.ts(mysum$resid))
bitmap(file='test5.png')
dum <- cbind(lag(myerror,k=1),myerror)
dum
dum1 <- dum[2:length(myerror),]
dum1
z <- as.data.frame(dum1)
z
plot(z,main=paste('Residual Lag plot, lowess, and regression line'), ylab='values of Residuals', xlab='lagged values of Residuals')
lines(lowess(z))
abline(lm(z))
grid()
dev.off()
bitmap(file='test6.png')
acf(mysum$resid, lag.max=length(mysum$resid)/2, main='Residual Autocorrelation Function')
grid()
dev.off()
bitmap(file='test7.png')
pacf(mysum$resid, lag.max=length(mysum$resid)/2, main='Residual Partial Autocorrelation Function')
grid()
dev.off()
bitmap(file='test8.png')
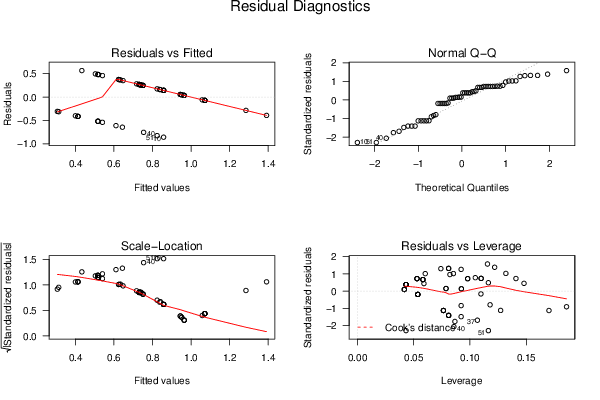
opar <- par(mfrow = c(2,2), oma = c(0, 0, 1.1, 0))
plot(mylm, las = 1, sub='Residual Diagnostics')
par(opar)
dev.off()
if (n > n25) {
bitmap(file='test9.png')
plot(kp3:nmkm3,gqarr[,2], main='Goldfeld-Quandt test',ylab='2-sided p-value',xlab='breakpoint')
grid()
dev.off()
}
load(file='createtable')
a<-table.start()
a<-table.row.start(a)
a<-table.element(a, 'Multiple Linear Regression - Estimated Regression Equation', 1, TRUE)
a<-table.row.end(a)
myeq <- colnames(x)[1]
myeq <- paste(myeq, '[t] = ', sep='')
for (i in 1:k){
if (mysum$coefficients[i,1] > 0) myeq <- paste(myeq, '+', '')
myeq <- paste(myeq, signif(mysum$coefficients[i,1],6), sep=' ')
if (rownames(mysum$coefficients)[i] != '(Intercept)') {
myeq <- paste(myeq, rownames(mysum$coefficients)[i], sep='')
if (rownames(mysum$coefficients)[i] != 't') myeq <- paste(myeq, '[t]', sep='')
}
}
myeq <- paste(myeq, ' + e[t]')
a<-table.row.start(a)
a<-table.element(a, myeq)
a<-table.row.end(a)
a<-table.end(a)
table.save(a,file='mytable1.tab')
a<-table.start()
a<-table.row.start(a)
a<-table.element(a,hyperlink('ols1.htm','Multiple Linear Regression - Ordinary Least Squares',''), 6, TRUE)
a<-table.row.end(a)
a<-table.row.start(a)
a<-table.element(a,'Variable',header=TRUE)
a<-table.element(a,'Parameter',header=TRUE)
a<-table.element(a,'S.D.',header=TRUE)
a<-table.element(a,'T-STAT
H0: parameter = 0',header=TRUE)
a<-table.element(a,'2-tail p-value',header=TRUE)
a<-table.element(a,'1-tail p-value',header=TRUE)
a<-table.row.end(a)
for (i in 1:k){
a<-table.row.start(a)
a<-table.element(a,rownames(mysum$coefficients)[i],header=TRUE)
a<-table.element(a,signif(mysum$coefficients[i,1],6))
a<-table.element(a, signif(mysum$coefficients[i,2],6))
a<-table.element(a, signif(mysum$coefficients[i,3],4))
a<-table.element(a, signif(mysum$coefficients[i,4],6))
a<-table.element(a, signif(mysum$coefficients[i,4]/2,6))
a<-table.row.end(a)
}
a<-table.end(a)
table.save(a,file='mytable2.tab')
a<-table.start()
a<-table.row.start(a)
a<-table.element(a, 'Multiple Linear Regression - Regression Statistics', 2, TRUE)
a<-table.row.end(a)
a<-table.row.start(a)
a<-table.element(a, 'Multiple R',1,TRUE)
a<-table.element(a, signif(sqrt(mysum$r.squared),6))
a<-table.row.end(a)
a<-table.row.start(a)
a<-table.element(a, 'R-squared',1,TRUE)
a<-table.element(a, signif(mysum$r.squared,6))
a<-table.row.end(a)
a<-table.row.start(a)
a<-table.element(a, 'Adjusted R-squared',1,TRUE)
a<-table.element(a, signif(mysum$adj.r.squared,6))
a<-table.row.end(a)
a<-table.row.start(a)
a<-table.element(a, 'F-TEST (value)',1,TRUE)
a<-table.element(a, signif(mysum$fstatistic[1],6))
a<-table.row.end(a)
a<-table.row.start(a)
a<-table.element(a, 'F-TEST (DF numerator)',1,TRUE)
a<-table.element(a, signif(mysum$fstatistic[2],6))
a<-table.row.end(a)
a<-table.row.start(a)
a<-table.element(a, 'F-TEST (DF denominator)',1,TRUE)
a<-table.element(a, signif(mysum$fstatistic[3],6))
a<-table.row.end(a)
a<-table.row.start(a)
a<-table.element(a, 'p-value',1,TRUE)
a<-table.element(a, signif(1-pf(mysum$fstatistic[1],mysum$fstatistic[2],mysum$fstatistic[3]),6))
a<-table.row.end(a)
a<-table.row.start(a)
a<-table.element(a, 'Multiple Linear Regression - Residual Statistics', 2, TRUE)
a<-table.row.end(a)
a<-table.row.start(a)
a<-table.element(a, 'Residual Standard Deviation',1,TRUE)
a<-table.element(a, signif(mysum$sigma,6))
a<-table.row.end(a)
a<-table.row.start(a)
a<-table.element(a, 'Sum Squared Residuals',1,TRUE)
a<-table.element(a, signif(sum(myerror*myerror),6))
a<-table.row.end(a)
a<-table.end(a)
table.save(a,file='mytable3.tab')
a<-table.start()
a<-table.row.start(a)
a<-table.element(a, 'Multiple Linear Regression - Actuals, Interpolation, and Residuals', 4, TRUE)
a<-table.row.end(a)
a<-table.row.start(a)
a<-table.element(a, 'Time or Index', 1, TRUE)
a<-table.element(a, 'Actuals', 1, TRUE)
a<-table.element(a, 'Interpolation
Forecast', 1, TRUE)
a<-table.element(a, 'Residuals
Prediction Error', 1, TRUE)
a<-table.row.end(a)
for (i in 1:n) {
a<-table.row.start(a)
a<-table.element(a,i, 1, TRUE)
a<-table.element(a,signif(x[i],6))
a<-table.element(a,signif(x[i]-mysum$resid[i],6))
a<-table.element(a,signif(mysum$resid[i],6))
a<-table.row.end(a)
}
a<-table.end(a)
table.save(a,file='mytable4.tab')
if (n > n25) {
a<-table.start()
a<-table.row.start(a)
a<-table.element(a,'Goldfeld-Quandt test for Heteroskedasticity',4,TRUE)
a<-table.row.end(a)
a<-table.row.start(a)
a<-table.element(a,'p-values',header=TRUE)
a<-table.element(a,'Alternative Hypothesis',3,header=TRUE)
a<-table.row.end(a)
a<-table.row.start(a)
a<-table.element(a,'breakpoint index',header=TRUE)
a<-table.element(a,'greater',header=TRUE)
a<-table.element(a,'2-sided',header=TRUE)
a<-table.element(a,'less',header=TRUE)
a<-table.row.end(a)
for (mypoint in kp3:nmkm3) {
a<-table.row.start(a)
a<-table.element(a,mypoint,header=TRUE)
a<-table.element(a,signif(gqarr[mypoint-kp3+1,1],6))
a<-table.element(a,signif(gqarr[mypoint-kp3+1,2],6))
a<-table.element(a,signif(gqarr[mypoint-kp3+1,3],6))
a<-table.row.end(a)
}
a<-table.end(a)
table.save(a,file='mytable5.tab')
a<-table.start()
a<-table.row.start(a)
a<-table.element(a,'Meta Analysis of Goldfeld-Quandt test for Heteroskedasticity',4,TRUE)
a<-table.row.end(a)
a<-table.row.start(a)
a<-table.element(a,'Description',header=TRUE)
a<-table.element(a,'# significant tests',header=TRUE)
a<-table.element(a,'% significant tests',header=TRUE)
a<-table.element(a,'OK/NOK',header=TRUE)
a<-table.row.end(a)
a<-table.row.start(a)
a<-table.element(a,'1% type I error level',header=TRUE)
a<-table.element(a,signif(numsignificant1,6))
a<-table.element(a,signif(numsignificant1/numgqtests,6))
if (numsignificant1/numgqtests < 0.01) dum <- 'OK' else dum <- 'NOK'
a<-table.element(a,dum)
a<-table.row.end(a)
a<-table.row.start(a)
a<-table.element(a,'5% type I error level',header=TRUE)
a<-table.element(a,signif(numsignificant5,6))
a<-table.element(a,signif(numsignificant5/numgqtests,6))
if (numsignificant5/numgqtests < 0.05) dum <- 'OK' else dum <- 'NOK'
a<-table.element(a,dum)
a<-table.row.end(a)
a<-table.row.start(a)
a<-table.element(a,'10% type I error level',header=TRUE)
a<-table.element(a,signif(numsignificant10,6))
a<-table.element(a,signif(numsignificant10/numgqtests,6))
if (numsignificant10/numgqtests < 0.1) dum <- 'OK' else dum <- 'NOK'
a<-table.element(a,dum)
a<-table.row.end(a)
a<-table.end(a)
table.save(a,file='mytable6.tab')
}