Free Statistics

of Irreproducible Research!

Author's title

Author*The author of this computation has been verified*
R Software Modulerwasp_multipleregression.wasp
Title produced by softwareMultiple Regression
Date of computationThu, 13 Nov 2014 18:59:36 +0000
Cite this page as followsStatistical Computations at FreeStatistics.org, Office for Research Development and Education, URL https://freestatistics.org/blog/index.php?v=date/2014/Nov/13/t14159052307yamfp1cwcwf3zz.htm/, Retrieved Sun, 19 May 2024 11:10:34 +0000
Statistical Computations at FreeStatistics.org, Office for Research Development and Education, URL https://freestatistics.org/blog/index.php?pk=254563, Retrieved Sun, 19 May 2024 11:10:34 +0000
QR Codes:

Original text written by user:
IsPrivate?No (this computation is public)
User-defined keywords
Estimated Impact86
Family? (F = Feedback message, R = changed R code, M = changed R Module, P = changed Parameters, D = changed Data)
-     [Multiple Regression] [] [2013-11-04 07:18:26] [0307e7a6407eb638caabc417e3a6b260]
- RMPD    [Multiple Regression] [] [2014-11-13 18:59:36] [d100ddac424efc880e37824ffef4fe9f] [Current]
-    D      [Multiple Regression] [] [2014-11-13 19:46:46] [95c11abf048d3a1e472aeccb09199113]
-    D        [Multiple Regression] [] [2014-12-15 10:41:33] [2fea329c6e322b1612c5dc504f90c0ef]
- R PD          [Multiple Regression] [] [2014-12-15 11:11:17] [2fea329c6e322b1612c5dc504f90c0ef]
- R PD          [Multiple Regression] [] [2014-12-15 11:15:41] [2fea329c6e322b1612c5dc504f90c0ef]
- R PD          [Multiple Regression] [] [2014-12-15 11:20:26] [2fea329c6e322b1612c5dc504f90c0ef]
- R PD          [Multiple Regression] [] [2014-12-15 11:21:52] [2fea329c6e322b1612c5dc504f90c0ef]
Feedback Forum

Post a new message
Dataseries X:
0	1	21	57	2
0	0	41	39	1
0	1	33	48	3
0	1	26	45	1
0	0	24	11	2
1	1	55	15	3
0	1	75	83	2
0	1	35	85	3
0	1	22	19	1
1	1	65	71	2
1	0	49	83	1
0	1	72	80	1
0	0	43	29	3
0	1	72	95	2
0	0	59	97	3
1	1	72	84	1
1	0	57	1	2
1	0	78	46	1
1	0	51	34	2
1	1	59	100	3
1	0	66	40	1
1	1	75	86	1
1	1	21	13	2
1	0	34	48	1
0	0	49	55	1
0	0	46	72	3
1	1	55	98	3
1	1	49	0	1
0	0	58	29	1
1	0	29	64	3
1	1	64	83	3
1	0	71	53	2
1	1	80	33	1
0	1	33	57	1
0	1	44	8	1
1	0	55	63	1
0	0	36	66	2
1	0	23	54	2
0	0	33	10	2
1	0	67	55	1
0	0	75	18	3
1	1	69	57	1
0	0	80	56	3
0	0	43	10	3
0	1	62	72	3
0	1	69	35	1
0	0	60	83	3
0	1	49	54	2
0	0	37	12	1
1	0	78	60	2
0	0	18	70	3
1	1	50	64	3
0	0	48	63	2
1	1	66	43	1
1	0	49	60	3
1	1	49	21	2
0	1	35	19	3
1	0	75	36	2
0	1	65	43	1
1	1	37	84	1


Summary of computational transaction
Raw Inputview raw input (R code)
Raw Outputview raw output of R engine
Computing time5 seconds
R Server'Gwilym Jenkins' @ jenkins.wessa.net

\begin{tabular}{lllllllll}
\hline
Summary of computational transaction \tabularnewline
Raw Input & view raw input (R code)  \tabularnewline
Raw Output & view raw output of R engine  \tabularnewline
Computing time & 5 seconds \tabularnewline
R Server & 'Gwilym Jenkins' @ jenkins.wessa.net \tabularnewline
\hline
\end{tabular}
%Source: https://freestatistics.org/blog/index.php?pk=254563&T=0

[TABLE]
[ROW][C]Summary of computational transaction[/C][/ROW]
[ROW][C]Raw Input[/C][C]view raw input (R code) [/C][/ROW]
[ROW][C]Raw Output[/C][C]view raw output of R engine [/C][/ROW]
[ROW][C]Computing time[/C][C]5 seconds[/C][/ROW]
[ROW][C]R Server[/C][C]'Gwilym Jenkins' @ jenkins.wessa.net[/C][/ROW]
[/TABLE]
Source: https://freestatistics.org/blog/index.php?pk=254563&T=0

Globally Unique Identifier (entire table): ba.freestatistics.org/blog/index.php?pk=254563&T=0

As an alternative you can also use a QR Code:  

The GUIDs for individual cells are displayed in the table below:

Summary of computational transaction
Raw Inputview raw input (R code)
Raw Outputview raw output of R engine
Computing time5 seconds
R Server'Gwilym Jenkins' @ jenkins.wessa.net


Multiple Linear Regression - Estimated Regression Equation
Abonnement[t] = + 0.211745 + 0.00442289Auto[t] + 0.0070769Leeftijd[t] + 0.000760496Afstand[t] -0.0711965Inkomen[t] + e[t]

\begin{tabular}{lllllllll}
\hline
Multiple Linear Regression - Estimated Regression Equation \tabularnewline
Abonnement[t] =  +  0.211745 +  0.00442289Auto[t] +  0.0070769Leeftijd[t] +  0.000760496Afstand[t] -0.0711965Inkomen[t]  + e[t] \tabularnewline
\hline
\end{tabular}
%Source: https://freestatistics.org/blog/index.php?pk=254563&T=1

[TABLE]
[ROW][C]Multiple Linear Regression - Estimated Regression Equation[/C][/ROW]
[ROW][C]Abonnement[t] =  +  0.211745 +  0.00442289Auto[t] +  0.0070769Leeftijd[t] +  0.000760496Afstand[t] -0.0711965Inkomen[t]  + e[t][/C][/ROW]
[/TABLE]
Source: https://freestatistics.org/blog/index.php?pk=254563&T=1

Globally Unique Identifier (entire table): ba.freestatistics.org/blog/index.php?pk=254563&T=1

As an alternative you can also use a QR Code:  

The GUIDs for individual cells are displayed in the table below:

Multiple Linear Regression - Estimated Regression Equation
Abonnement[t] = + 0.211745 + 0.00442289Auto[t] + 0.0070769Leeftijd[t] + 0.000760496Afstand[t] -0.0711965Inkomen[t] + e[t]


Multiple Linear Regression - Ordinary Least Squares
VariableParameterS.D.T-STATH0: parameter = 02-tail p-value1-tail p-value
(Intercept)0.2117450.2736520.77380.4423760.221188
Auto0.004422890.1311440.033730.9732180.486609
Leeftijd0.00707690.003831.8480.07001820.0350091
Afstand0.0007604960.002558030.29730.7673590.38368
Inkomen-0.07119650.0795601-0.89490.3747520.187376

\begin{tabular}{lllllllll}
\hline
Multiple Linear Regression - Ordinary Least Squares \tabularnewline
Variable & Parameter & S.D. & T-STATH0: parameter = 0 & 2-tail p-value & 1-tail p-value \tabularnewline
(Intercept) & 0.211745 & 0.273652 & 0.7738 & 0.442376 & 0.221188 \tabularnewline
Auto & 0.00442289 & 0.131144 & 0.03373 & 0.973218 & 0.486609 \tabularnewline
Leeftijd & 0.0070769 & 0.00383 & 1.848 & 0.0700182 & 0.0350091 \tabularnewline
Afstand & 0.000760496 & 0.00255803 & 0.2973 & 0.767359 & 0.38368 \tabularnewline
Inkomen & -0.0711965 & 0.0795601 & -0.8949 & 0.374752 & 0.187376 \tabularnewline
\hline
\end{tabular}
%Source: https://freestatistics.org/blog/index.php?pk=254563&T=2

[TABLE]
[ROW][C]Multiple Linear Regression - Ordinary Least Squares[/C][/ROW]
[ROW][C]Variable[/C][C]Parameter[/C][C]S.D.[/C][C]T-STATH0: parameter = 0[/C][C]2-tail p-value[/C][C]1-tail p-value[/C][/ROW]
[ROW][C](Intercept)[/C][C]0.211745[/C][C]0.273652[/C][C]0.7738[/C][C]0.442376[/C][C]0.221188[/C][/ROW]
[ROW][C]Auto[/C][C]0.00442289[/C][C]0.131144[/C][C]0.03373[/C][C]0.973218[/C][C]0.486609[/C][/ROW]
[ROW][C]Leeftijd[/C][C]0.0070769[/C][C]0.00383[/C][C]1.848[/C][C]0.0700182[/C][C]0.0350091[/C][/ROW]
[ROW][C]Afstand[/C][C]0.000760496[/C][C]0.00255803[/C][C]0.2973[/C][C]0.767359[/C][C]0.38368[/C][/ROW]
[ROW][C]Inkomen[/C][C]-0.0711965[/C][C]0.0795601[/C][C]-0.8949[/C][C]0.374752[/C][C]0.187376[/C][/ROW]
[/TABLE]
Source: https://freestatistics.org/blog/index.php?pk=254563&T=2

Globally Unique Identifier (entire table): ba.freestatistics.org/blog/index.php?pk=254563&T=2

As an alternative you can also use a QR Code:  

The GUIDs for individual cells are displayed in the table below:

Multiple Linear Regression - Ordinary Least Squares
VariableParameterS.D.T-STATH0: parameter = 02-tail p-value1-tail p-value
(Intercept)0.2117450.2736520.77380.4423760.221188
Auto0.004422890.1311440.033730.9732180.486609
Leeftijd0.00707690.003831.8480.07001820.0350091
Afstand0.0007604960.002558030.29730.7673590.38368
Inkomen-0.07119650.0795601-0.89490.3747520.187376


Multiple Linear Regression - Regression Statistics
Multiple R0.297802
R-squared0.0886858
Adjusted R-squared0.0224084
F-TEST (value)1.3381
F-TEST (DF numerator)4
F-TEST (DF denominator)55
p-value0.267478
Multiple Linear Regression - Residual Statistics
Residual Standard Deviation0.498261
Sum Squared Residuals13.6545

\begin{tabular}{lllllllll}
\hline
Multiple Linear Regression - Regression Statistics \tabularnewline
Multiple R & 0.297802 \tabularnewline
R-squared & 0.0886858 \tabularnewline
Adjusted R-squared & 0.0224084 \tabularnewline
F-TEST (value) & 1.3381 \tabularnewline
F-TEST (DF numerator) & 4 \tabularnewline
F-TEST (DF denominator) & 55 \tabularnewline
p-value & 0.267478 \tabularnewline
Multiple Linear Regression - Residual Statistics \tabularnewline
Residual Standard Deviation & 0.498261 \tabularnewline
Sum Squared Residuals & 13.6545 \tabularnewline
\hline
\end{tabular}
%Source: https://freestatistics.org/blog/index.php?pk=254563&T=3

[TABLE]
[ROW][C]Multiple Linear Regression - Regression Statistics[/C][/ROW]
[ROW][C]Multiple R[/C][C]0.297802[/C][/ROW]
[ROW][C]R-squared[/C][C]0.0886858[/C][/ROW]
[ROW][C]Adjusted R-squared[/C][C]0.0224084[/C][/ROW]
[ROW][C]F-TEST (value)[/C][C]1.3381[/C][/ROW]
[ROW][C]F-TEST (DF numerator)[/C][C]4[/C][/ROW]
[ROW][C]F-TEST (DF denominator)[/C][C]55[/C][/ROW]
[ROW][C]p-value[/C][C]0.267478[/C][/ROW]
[ROW][C]Multiple Linear Regression - Residual Statistics[/C][/ROW]
[ROW][C]Residual Standard Deviation[/C][C]0.498261[/C][/ROW]
[ROW][C]Sum Squared Residuals[/C][C]13.6545[/C][/ROW]
[/TABLE]
Source: https://freestatistics.org/blog/index.php?pk=254563&T=3

Globally Unique Identifier (entire table): ba.freestatistics.org/blog/index.php?pk=254563&T=3

As an alternative you can also use a QR Code:  

The GUIDs for individual cells are displayed in the table below:

Multiple Linear Regression - Regression Statistics
Multiple R0.297802
R-squared0.0886858
Adjusted R-squared0.0224084
F-TEST (value)1.3381
F-TEST (DF numerator)4
F-TEST (DF denominator)55
p-value0.267478
Multiple Linear Regression - Residual Statistics
Residual Standard Deviation0.498261
Sum Squared Residuals13.6545


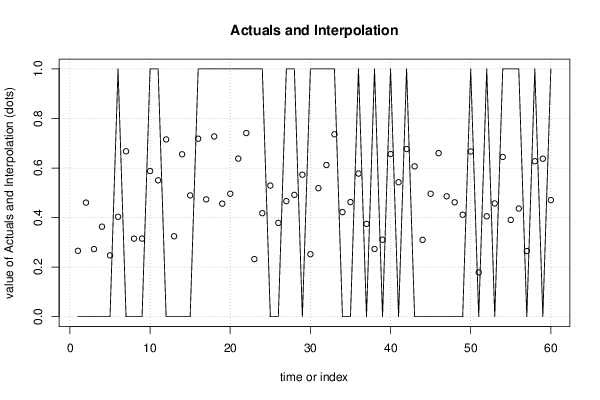
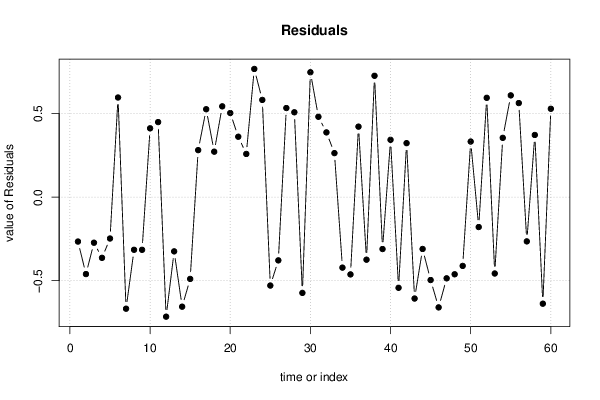
Multiple Linear Regression - Actuals, Interpolation, and Residuals
Time or IndexActualsInterpolationForecastResidualsPrediction Error
100.265738-0.265738
200.460361-0.460361
300.27262-0.27262
400.363193-0.363193
500.247563-0.247563
610.4032160.596784
700.667664-0.667664
800.314912-0.314912
900.315113-0.315113
1010.5877690.412231
1110.5504380.449562
1200.715348-0.715348
1300.324517-0.324517
1400.655559-0.655559
1500.489461-0.489461
1610.718390.28161
1710.4734960.526504
1810.727530.27247
1910.4561310.543869
2010.4961650.503835
2110.6380440.361956
2210.7411420.258858
2310.2322770.767723
2410.4176670.582333
2500.529144-0.529144
2600.378449-0.378449
2710.4663370.533663
2810.491740.50826
2900.573063-0.573063
3010.2520580.747942
3110.5186210.481379
3210.6121180.387882
3310.736220.26378
3400.421858-0.421858
3500.462439-0.462439
3610.5776890.422311
3700.374313-0.374313
3810.2731880.726812
3900.310495-0.310495
4010.6565280.343472
4100.542612-0.542612
4210.6766260.323374
4300.606895-0.606895
4400.310067-0.310067
4500.496102-0.496102
4600.659895-0.659895
4700.485891-0.485891
4800.46161-0.46161
4900.41152-0.41152
5010.666980.33302
5100.178775-0.178775
5210.4050950.594905
5300.456955-0.456955
5410.6447480.355252
5510.3905540.609446
5610.4365140.563486
5700.26472-0.26472
5810.6274970.372503
5900.637671-0.637671
6010.4706990.529301

\begin{tabular}{lllllllll}
\hline
Multiple Linear Regression - Actuals, Interpolation, and Residuals \tabularnewline
Time or Index & Actuals & InterpolationForecast & ResidualsPrediction Error \tabularnewline
1 & 0 & 0.265738 & -0.265738 \tabularnewline
2 & 0 & 0.460361 & -0.460361 \tabularnewline
3 & 0 & 0.27262 & -0.27262 \tabularnewline
4 & 0 & 0.363193 & -0.363193 \tabularnewline
5 & 0 & 0.247563 & -0.247563 \tabularnewline
6 & 1 & 0.403216 & 0.596784 \tabularnewline
7 & 0 & 0.667664 & -0.667664 \tabularnewline
8 & 0 & 0.314912 & -0.314912 \tabularnewline
9 & 0 & 0.315113 & -0.315113 \tabularnewline
10 & 1 & 0.587769 & 0.412231 \tabularnewline
11 & 1 & 0.550438 & 0.449562 \tabularnewline
12 & 0 & 0.715348 & -0.715348 \tabularnewline
13 & 0 & 0.324517 & -0.324517 \tabularnewline
14 & 0 & 0.655559 & -0.655559 \tabularnewline
15 & 0 & 0.489461 & -0.489461 \tabularnewline
16 & 1 & 0.71839 & 0.28161 \tabularnewline
17 & 1 & 0.473496 & 0.526504 \tabularnewline
18 & 1 & 0.72753 & 0.27247 \tabularnewline
19 & 1 & 0.456131 & 0.543869 \tabularnewline
20 & 1 & 0.496165 & 0.503835 \tabularnewline
21 & 1 & 0.638044 & 0.361956 \tabularnewline
22 & 1 & 0.741142 & 0.258858 \tabularnewline
23 & 1 & 0.232277 & 0.767723 \tabularnewline
24 & 1 & 0.417667 & 0.582333 \tabularnewline
25 & 0 & 0.529144 & -0.529144 \tabularnewline
26 & 0 & 0.378449 & -0.378449 \tabularnewline
27 & 1 & 0.466337 & 0.533663 \tabularnewline
28 & 1 & 0.49174 & 0.50826 \tabularnewline
29 & 0 & 0.573063 & -0.573063 \tabularnewline
30 & 1 & 0.252058 & 0.747942 \tabularnewline
31 & 1 & 0.518621 & 0.481379 \tabularnewline
32 & 1 & 0.612118 & 0.387882 \tabularnewline
33 & 1 & 0.73622 & 0.26378 \tabularnewline
34 & 0 & 0.421858 & -0.421858 \tabularnewline
35 & 0 & 0.462439 & -0.462439 \tabularnewline
36 & 1 & 0.577689 & 0.422311 \tabularnewline
37 & 0 & 0.374313 & -0.374313 \tabularnewline
38 & 1 & 0.273188 & 0.726812 \tabularnewline
39 & 0 & 0.310495 & -0.310495 \tabularnewline
40 & 1 & 0.656528 & 0.343472 \tabularnewline
41 & 0 & 0.542612 & -0.542612 \tabularnewline
42 & 1 & 0.676626 & 0.323374 \tabularnewline
43 & 0 & 0.606895 & -0.606895 \tabularnewline
44 & 0 & 0.310067 & -0.310067 \tabularnewline
45 & 0 & 0.496102 & -0.496102 \tabularnewline
46 & 0 & 0.659895 & -0.659895 \tabularnewline
47 & 0 & 0.485891 & -0.485891 \tabularnewline
48 & 0 & 0.46161 & -0.46161 \tabularnewline
49 & 0 & 0.41152 & -0.41152 \tabularnewline
50 & 1 & 0.66698 & 0.33302 \tabularnewline
51 & 0 & 0.178775 & -0.178775 \tabularnewline
52 & 1 & 0.405095 & 0.594905 \tabularnewline
53 & 0 & 0.456955 & -0.456955 \tabularnewline
54 & 1 & 0.644748 & 0.355252 \tabularnewline
55 & 1 & 0.390554 & 0.609446 \tabularnewline
56 & 1 & 0.436514 & 0.563486 \tabularnewline
57 & 0 & 0.26472 & -0.26472 \tabularnewline
58 & 1 & 0.627497 & 0.372503 \tabularnewline
59 & 0 & 0.637671 & -0.637671 \tabularnewline
60 & 1 & 0.470699 & 0.529301 \tabularnewline
\hline
\end{tabular}
%Source: https://freestatistics.org/blog/index.php?pk=254563&T=4

[TABLE]
[ROW][C]Multiple Linear Regression - Actuals, Interpolation, and Residuals[/C][/ROW]
[ROW][C]Time or Index[/C][C]Actuals[/C][C]InterpolationForecast[/C][C]ResidualsPrediction Error[/C][/ROW]
[ROW][C]1[/C][C]0[/C][C]0.265738[/C][C]-0.265738[/C][/ROW]
[ROW][C]2[/C][C]0[/C][C]0.460361[/C][C]-0.460361[/C][/ROW]
[ROW][C]3[/C][C]0[/C][C]0.27262[/C][C]-0.27262[/C][/ROW]
[ROW][C]4[/C][C]0[/C][C]0.363193[/C][C]-0.363193[/C][/ROW]
[ROW][C]5[/C][C]0[/C][C]0.247563[/C][C]-0.247563[/C][/ROW]
[ROW][C]6[/C][C]1[/C][C]0.403216[/C][C]0.596784[/C][/ROW]
[ROW][C]7[/C][C]0[/C][C]0.667664[/C][C]-0.667664[/C][/ROW]
[ROW][C]8[/C][C]0[/C][C]0.314912[/C][C]-0.314912[/C][/ROW]
[ROW][C]9[/C][C]0[/C][C]0.315113[/C][C]-0.315113[/C][/ROW]
[ROW][C]10[/C][C]1[/C][C]0.587769[/C][C]0.412231[/C][/ROW]
[ROW][C]11[/C][C]1[/C][C]0.550438[/C][C]0.449562[/C][/ROW]
[ROW][C]12[/C][C]0[/C][C]0.715348[/C][C]-0.715348[/C][/ROW]
[ROW][C]13[/C][C]0[/C][C]0.324517[/C][C]-0.324517[/C][/ROW]
[ROW][C]14[/C][C]0[/C][C]0.655559[/C][C]-0.655559[/C][/ROW]
[ROW][C]15[/C][C]0[/C][C]0.489461[/C][C]-0.489461[/C][/ROW]
[ROW][C]16[/C][C]1[/C][C]0.71839[/C][C]0.28161[/C][/ROW]
[ROW][C]17[/C][C]1[/C][C]0.473496[/C][C]0.526504[/C][/ROW]
[ROW][C]18[/C][C]1[/C][C]0.72753[/C][C]0.27247[/C][/ROW]
[ROW][C]19[/C][C]1[/C][C]0.456131[/C][C]0.543869[/C][/ROW]
[ROW][C]20[/C][C]1[/C][C]0.496165[/C][C]0.503835[/C][/ROW]
[ROW][C]21[/C][C]1[/C][C]0.638044[/C][C]0.361956[/C][/ROW]
[ROW][C]22[/C][C]1[/C][C]0.741142[/C][C]0.258858[/C][/ROW]
[ROW][C]23[/C][C]1[/C][C]0.232277[/C][C]0.767723[/C][/ROW]
[ROW][C]24[/C][C]1[/C][C]0.417667[/C][C]0.582333[/C][/ROW]
[ROW][C]25[/C][C]0[/C][C]0.529144[/C][C]-0.529144[/C][/ROW]
[ROW][C]26[/C][C]0[/C][C]0.378449[/C][C]-0.378449[/C][/ROW]
[ROW][C]27[/C][C]1[/C][C]0.466337[/C][C]0.533663[/C][/ROW]
[ROW][C]28[/C][C]1[/C][C]0.49174[/C][C]0.50826[/C][/ROW]
[ROW][C]29[/C][C]0[/C][C]0.573063[/C][C]-0.573063[/C][/ROW]
[ROW][C]30[/C][C]1[/C][C]0.252058[/C][C]0.747942[/C][/ROW]
[ROW][C]31[/C][C]1[/C][C]0.518621[/C][C]0.481379[/C][/ROW]
[ROW][C]32[/C][C]1[/C][C]0.612118[/C][C]0.387882[/C][/ROW]
[ROW][C]33[/C][C]1[/C][C]0.73622[/C][C]0.26378[/C][/ROW]
[ROW][C]34[/C][C]0[/C][C]0.421858[/C][C]-0.421858[/C][/ROW]
[ROW][C]35[/C][C]0[/C][C]0.462439[/C][C]-0.462439[/C][/ROW]
[ROW][C]36[/C][C]1[/C][C]0.577689[/C][C]0.422311[/C][/ROW]
[ROW][C]37[/C][C]0[/C][C]0.374313[/C][C]-0.374313[/C][/ROW]
[ROW][C]38[/C][C]1[/C][C]0.273188[/C][C]0.726812[/C][/ROW]
[ROW][C]39[/C][C]0[/C][C]0.310495[/C][C]-0.310495[/C][/ROW]
[ROW][C]40[/C][C]1[/C][C]0.656528[/C][C]0.343472[/C][/ROW]
[ROW][C]41[/C][C]0[/C][C]0.542612[/C][C]-0.542612[/C][/ROW]
[ROW][C]42[/C][C]1[/C][C]0.676626[/C][C]0.323374[/C][/ROW]
[ROW][C]43[/C][C]0[/C][C]0.606895[/C][C]-0.606895[/C][/ROW]
[ROW][C]44[/C][C]0[/C][C]0.310067[/C][C]-0.310067[/C][/ROW]
[ROW][C]45[/C][C]0[/C][C]0.496102[/C][C]-0.496102[/C][/ROW]
[ROW][C]46[/C][C]0[/C][C]0.659895[/C][C]-0.659895[/C][/ROW]
[ROW][C]47[/C][C]0[/C][C]0.485891[/C][C]-0.485891[/C][/ROW]
[ROW][C]48[/C][C]0[/C][C]0.46161[/C][C]-0.46161[/C][/ROW]
[ROW][C]49[/C][C]0[/C][C]0.41152[/C][C]-0.41152[/C][/ROW]
[ROW][C]50[/C][C]1[/C][C]0.66698[/C][C]0.33302[/C][/ROW]
[ROW][C]51[/C][C]0[/C][C]0.178775[/C][C]-0.178775[/C][/ROW]
[ROW][C]52[/C][C]1[/C][C]0.405095[/C][C]0.594905[/C][/ROW]
[ROW][C]53[/C][C]0[/C][C]0.456955[/C][C]-0.456955[/C][/ROW]
[ROW][C]54[/C][C]1[/C][C]0.644748[/C][C]0.355252[/C][/ROW]
[ROW][C]55[/C][C]1[/C][C]0.390554[/C][C]0.609446[/C][/ROW]
[ROW][C]56[/C][C]1[/C][C]0.436514[/C][C]0.563486[/C][/ROW]
[ROW][C]57[/C][C]0[/C][C]0.26472[/C][C]-0.26472[/C][/ROW]
[ROW][C]58[/C][C]1[/C][C]0.627497[/C][C]0.372503[/C][/ROW]
[ROW][C]59[/C][C]0[/C][C]0.637671[/C][C]-0.637671[/C][/ROW]
[ROW][C]60[/C][C]1[/C][C]0.470699[/C][C]0.529301[/C][/ROW]
[/TABLE]
Source: https://freestatistics.org/blog/index.php?pk=254563&T=4

Globally Unique Identifier (entire table): ba.freestatistics.org/blog/index.php?pk=254563&T=4

As an alternative you can also use a QR Code:  

The GUIDs for individual cells are displayed in the table below:

Multiple Linear Regression - Actuals, Interpolation, and Residuals
Time or IndexActualsInterpolationForecastResidualsPrediction Error
100.265738-0.265738
200.460361-0.460361
300.27262-0.27262
400.363193-0.363193
500.247563-0.247563
610.4032160.596784
700.667664-0.667664
800.314912-0.314912
900.315113-0.315113
1010.5877690.412231
1110.5504380.449562
1200.715348-0.715348
1300.324517-0.324517
1400.655559-0.655559
1500.489461-0.489461
1610.718390.28161
1710.4734960.526504
1810.727530.27247
1910.4561310.543869
2010.4961650.503835
2110.6380440.361956
2210.7411420.258858
2310.2322770.767723
2410.4176670.582333
2500.529144-0.529144
2600.378449-0.378449
2710.4663370.533663
2810.491740.50826
2900.573063-0.573063
3010.2520580.747942
3110.5186210.481379
3210.6121180.387882
3310.736220.26378
3400.421858-0.421858
3500.462439-0.462439
3610.5776890.422311
3700.374313-0.374313
3810.2731880.726812
3900.310495-0.310495
4010.6565280.343472
4100.542612-0.542612
4210.6766260.323374
4300.606895-0.606895
4400.310067-0.310067
4500.496102-0.496102
4600.659895-0.659895
4700.485891-0.485891
4800.46161-0.46161
4900.41152-0.41152
5010.666980.33302
5100.178775-0.178775
5210.4050950.594905
5300.456955-0.456955
5410.6447480.355252
5510.3905540.609446
5610.4365140.563486
5700.26472-0.26472
5810.6274970.372503
5900.637671-0.637671
6010.4706990.529301


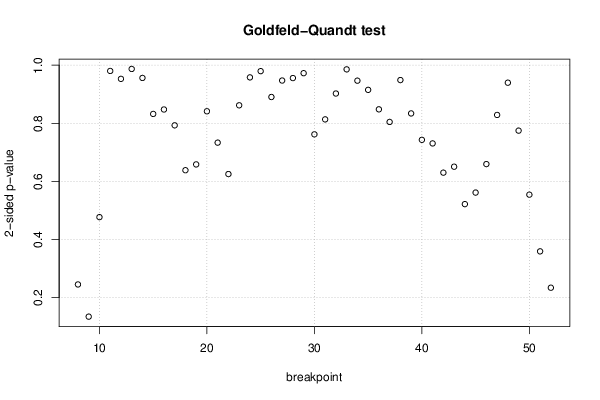
Goldfeld-Quandt test for Heteroskedasticity
p-valuesAlternative Hypothesis
breakpoint indexgreater2-sidedless
80.1224060.2448120.877594
90.0669590.1339180.933041
100.2383550.476710.761645
110.5098720.9802560.490128
120.5234860.9530280.476514
130.4935920.9871840.506408
140.4781120.9562240.521888
150.4161020.8322040.583898
160.4237660.8475310.576234
170.3965030.7930050.603497
180.3191520.6383030.680848
190.3291630.6583250.670837
200.4207180.8414360.579282
210.3666740.7333480.633326
220.3125450.625090.687455
230.4309810.8619620.569019
240.4790780.9581560.520922
250.4898020.9796040.510198
260.445270.8905410.55473
270.4736560.9473120.526344
280.4778970.9557950.522103
290.5136970.9726070.486303
300.6190340.7619330.380966
310.5932740.8134520.406726
320.5487330.9025340.451267
330.4928830.9857660.507117
340.4733930.9467850.526607
350.457580.915160.54242
360.4240280.8480550.575972
370.4023510.8047020.597649
380.4744280.9488560.525572
390.4169770.8339550.583023
400.3714790.7429580.628521
410.3653560.7307120.634644
420.3149830.6299660.685017
430.3252320.6504640.674768
440.2607710.5215430.739229
450.2806510.5613020.719349
460.3297110.6594230.670289
470.4143620.8287240.585638
480.4699070.9398140.530093
490.3873430.7746870.612657
500.277080.554160.72292
510.1794380.3588750.820562
520.1167780.2335560.883222

\begin{tabular}{lllllllll}
\hline
Goldfeld-Quandt test for Heteroskedasticity \tabularnewline
p-values & Alternative Hypothesis \tabularnewline
breakpoint index & greater & 2-sided & less \tabularnewline
8 & 0.122406 & 0.244812 & 0.877594 \tabularnewline
9 & 0.066959 & 0.133918 & 0.933041 \tabularnewline
10 & 0.238355 & 0.47671 & 0.761645 \tabularnewline
11 & 0.509872 & 0.980256 & 0.490128 \tabularnewline
12 & 0.523486 & 0.953028 & 0.476514 \tabularnewline
13 & 0.493592 & 0.987184 & 0.506408 \tabularnewline
14 & 0.478112 & 0.956224 & 0.521888 \tabularnewline
15 & 0.416102 & 0.832204 & 0.583898 \tabularnewline
16 & 0.423766 & 0.847531 & 0.576234 \tabularnewline
17 & 0.396503 & 0.793005 & 0.603497 \tabularnewline
18 & 0.319152 & 0.638303 & 0.680848 \tabularnewline
19 & 0.329163 & 0.658325 & 0.670837 \tabularnewline
20 & 0.420718 & 0.841436 & 0.579282 \tabularnewline
21 & 0.366674 & 0.733348 & 0.633326 \tabularnewline
22 & 0.312545 & 0.62509 & 0.687455 \tabularnewline
23 & 0.430981 & 0.861962 & 0.569019 \tabularnewline
24 & 0.479078 & 0.958156 & 0.520922 \tabularnewline
25 & 0.489802 & 0.979604 & 0.510198 \tabularnewline
26 & 0.44527 & 0.890541 & 0.55473 \tabularnewline
27 & 0.473656 & 0.947312 & 0.526344 \tabularnewline
28 & 0.477897 & 0.955795 & 0.522103 \tabularnewline
29 & 0.513697 & 0.972607 & 0.486303 \tabularnewline
30 & 0.619034 & 0.761933 & 0.380966 \tabularnewline
31 & 0.593274 & 0.813452 & 0.406726 \tabularnewline
32 & 0.548733 & 0.902534 & 0.451267 \tabularnewline
33 & 0.492883 & 0.985766 & 0.507117 \tabularnewline
34 & 0.473393 & 0.946785 & 0.526607 \tabularnewline
35 & 0.45758 & 0.91516 & 0.54242 \tabularnewline
36 & 0.424028 & 0.848055 & 0.575972 \tabularnewline
37 & 0.402351 & 0.804702 & 0.597649 \tabularnewline
38 & 0.474428 & 0.948856 & 0.525572 \tabularnewline
39 & 0.416977 & 0.833955 & 0.583023 \tabularnewline
40 & 0.371479 & 0.742958 & 0.628521 \tabularnewline
41 & 0.365356 & 0.730712 & 0.634644 \tabularnewline
42 & 0.314983 & 0.629966 & 0.685017 \tabularnewline
43 & 0.325232 & 0.650464 & 0.674768 \tabularnewline
44 & 0.260771 & 0.521543 & 0.739229 \tabularnewline
45 & 0.280651 & 0.561302 & 0.719349 \tabularnewline
46 & 0.329711 & 0.659423 & 0.670289 \tabularnewline
47 & 0.414362 & 0.828724 & 0.585638 \tabularnewline
48 & 0.469907 & 0.939814 & 0.530093 \tabularnewline
49 & 0.387343 & 0.774687 & 0.612657 \tabularnewline
50 & 0.27708 & 0.55416 & 0.72292 \tabularnewline
51 & 0.179438 & 0.358875 & 0.820562 \tabularnewline
52 & 0.116778 & 0.233556 & 0.883222 \tabularnewline
\hline
\end{tabular}
%Source: https://freestatistics.org/blog/index.php?pk=254563&T=5

[TABLE]
[ROW][C]Goldfeld-Quandt test for Heteroskedasticity[/C][/ROW]
[ROW][C]p-values[/C][C]Alternative Hypothesis[/C][/ROW]
[ROW][C]breakpoint index[/C][C]greater[/C][C]2-sided[/C][C]less[/C][/ROW]
[ROW][C]8[/C][C]0.122406[/C][C]0.244812[/C][C]0.877594[/C][/ROW]
[ROW][C]9[/C][C]0.066959[/C][C]0.133918[/C][C]0.933041[/C][/ROW]
[ROW][C]10[/C][C]0.238355[/C][C]0.47671[/C][C]0.761645[/C][/ROW]
[ROW][C]11[/C][C]0.509872[/C][C]0.980256[/C][C]0.490128[/C][/ROW]
[ROW][C]12[/C][C]0.523486[/C][C]0.953028[/C][C]0.476514[/C][/ROW]
[ROW][C]13[/C][C]0.493592[/C][C]0.987184[/C][C]0.506408[/C][/ROW]
[ROW][C]14[/C][C]0.478112[/C][C]0.956224[/C][C]0.521888[/C][/ROW]
[ROW][C]15[/C][C]0.416102[/C][C]0.832204[/C][C]0.583898[/C][/ROW]
[ROW][C]16[/C][C]0.423766[/C][C]0.847531[/C][C]0.576234[/C][/ROW]
[ROW][C]17[/C][C]0.396503[/C][C]0.793005[/C][C]0.603497[/C][/ROW]
[ROW][C]18[/C][C]0.319152[/C][C]0.638303[/C][C]0.680848[/C][/ROW]
[ROW][C]19[/C][C]0.329163[/C][C]0.658325[/C][C]0.670837[/C][/ROW]
[ROW][C]20[/C][C]0.420718[/C][C]0.841436[/C][C]0.579282[/C][/ROW]
[ROW][C]21[/C][C]0.366674[/C][C]0.733348[/C][C]0.633326[/C][/ROW]
[ROW][C]22[/C][C]0.312545[/C][C]0.62509[/C][C]0.687455[/C][/ROW]
[ROW][C]23[/C][C]0.430981[/C][C]0.861962[/C][C]0.569019[/C][/ROW]
[ROW][C]24[/C][C]0.479078[/C][C]0.958156[/C][C]0.520922[/C][/ROW]
[ROW][C]25[/C][C]0.489802[/C][C]0.979604[/C][C]0.510198[/C][/ROW]
[ROW][C]26[/C][C]0.44527[/C][C]0.890541[/C][C]0.55473[/C][/ROW]
[ROW][C]27[/C][C]0.473656[/C][C]0.947312[/C][C]0.526344[/C][/ROW]
[ROW][C]28[/C][C]0.477897[/C][C]0.955795[/C][C]0.522103[/C][/ROW]
[ROW][C]29[/C][C]0.513697[/C][C]0.972607[/C][C]0.486303[/C][/ROW]
[ROW][C]30[/C][C]0.619034[/C][C]0.761933[/C][C]0.380966[/C][/ROW]
[ROW][C]31[/C][C]0.593274[/C][C]0.813452[/C][C]0.406726[/C][/ROW]
[ROW][C]32[/C][C]0.548733[/C][C]0.902534[/C][C]0.451267[/C][/ROW]
[ROW][C]33[/C][C]0.492883[/C][C]0.985766[/C][C]0.507117[/C][/ROW]
[ROW][C]34[/C][C]0.473393[/C][C]0.946785[/C][C]0.526607[/C][/ROW]
[ROW][C]35[/C][C]0.45758[/C][C]0.91516[/C][C]0.54242[/C][/ROW]
[ROW][C]36[/C][C]0.424028[/C][C]0.848055[/C][C]0.575972[/C][/ROW]
[ROW][C]37[/C][C]0.402351[/C][C]0.804702[/C][C]0.597649[/C][/ROW]
[ROW][C]38[/C][C]0.474428[/C][C]0.948856[/C][C]0.525572[/C][/ROW]
[ROW][C]39[/C][C]0.416977[/C][C]0.833955[/C][C]0.583023[/C][/ROW]
[ROW][C]40[/C][C]0.371479[/C][C]0.742958[/C][C]0.628521[/C][/ROW]
[ROW][C]41[/C][C]0.365356[/C][C]0.730712[/C][C]0.634644[/C][/ROW]
[ROW][C]42[/C][C]0.314983[/C][C]0.629966[/C][C]0.685017[/C][/ROW]
[ROW][C]43[/C][C]0.325232[/C][C]0.650464[/C][C]0.674768[/C][/ROW]
[ROW][C]44[/C][C]0.260771[/C][C]0.521543[/C][C]0.739229[/C][/ROW]
[ROW][C]45[/C][C]0.280651[/C][C]0.561302[/C][C]0.719349[/C][/ROW]
[ROW][C]46[/C][C]0.329711[/C][C]0.659423[/C][C]0.670289[/C][/ROW]
[ROW][C]47[/C][C]0.414362[/C][C]0.828724[/C][C]0.585638[/C][/ROW]
[ROW][C]48[/C][C]0.469907[/C][C]0.939814[/C][C]0.530093[/C][/ROW]
[ROW][C]49[/C][C]0.387343[/C][C]0.774687[/C][C]0.612657[/C][/ROW]
[ROW][C]50[/C][C]0.27708[/C][C]0.55416[/C][C]0.72292[/C][/ROW]
[ROW][C]51[/C][C]0.179438[/C][C]0.358875[/C][C]0.820562[/C][/ROW]
[ROW][C]52[/C][C]0.116778[/C][C]0.233556[/C][C]0.883222[/C][/ROW]
[/TABLE]
Source: https://freestatistics.org/blog/index.php?pk=254563&T=5

Globally Unique Identifier (entire table): ba.freestatistics.org/blog/index.php?pk=254563&T=5

As an alternative you can also use a QR Code:  

The GUIDs for individual cells are displayed in the table below:

Goldfeld-Quandt test for Heteroskedasticity
p-valuesAlternative Hypothesis
breakpoint indexgreater2-sidedless
80.1224060.2448120.877594
90.0669590.1339180.933041
100.2383550.476710.761645
110.5098720.9802560.490128
120.5234860.9530280.476514
130.4935920.9871840.506408
140.4781120.9562240.521888
150.4161020.8322040.583898
160.4237660.8475310.576234
170.3965030.7930050.603497
180.3191520.6383030.680848
190.3291630.6583250.670837
200.4207180.8414360.579282
210.3666740.7333480.633326
220.3125450.625090.687455
230.4309810.8619620.569019
240.4790780.9581560.520922
250.4898020.9796040.510198
260.445270.8905410.55473
270.4736560.9473120.526344
280.4778970.9557950.522103
290.5136970.9726070.486303
300.6190340.7619330.380966
310.5932740.8134520.406726
320.5487330.9025340.451267
330.4928830.9857660.507117
340.4733930.9467850.526607
350.457580.915160.54242
360.4240280.8480550.575972
370.4023510.8047020.597649
380.4744280.9488560.525572
390.4169770.8339550.583023
400.3714790.7429580.628521
410.3653560.7307120.634644
420.3149830.6299660.685017
430.3252320.6504640.674768
440.2607710.5215430.739229
450.2806510.5613020.719349
460.3297110.6594230.670289
470.4143620.8287240.585638
480.4699070.9398140.530093
490.3873430.7746870.612657
500.277080.554160.72292
510.1794380.3588750.820562
520.1167780.2335560.883222


Meta Analysis of Goldfeld-Quandt test for Heteroskedasticity
Description# significant tests% significant testsOK/NOK
1% type I error level00OK
5% type I error level00OK
10% type I error level00OK

\begin{tabular}{lllllllll}
\hline
Meta Analysis of Goldfeld-Quandt test for Heteroskedasticity \tabularnewline
Description & # significant tests & % significant tests & OK/NOK \tabularnewline
1% type I error level & 0 & 0 & OK \tabularnewline
5% type I error level & 0 & 0 & OK \tabularnewline
10% type I error level & 0 & 0 & OK \tabularnewline
\hline
\end{tabular}
%Source: https://freestatistics.org/blog/index.php?pk=254563&T=6

[TABLE]
[ROW][C]Meta Analysis of Goldfeld-Quandt test for Heteroskedasticity[/C][/ROW]
[ROW][C]Description[/C][C]# significant tests[/C][C]% significant tests[/C][C]OK/NOK[/C][/ROW]
[ROW][C]1% type I error level[/C][C]0[/C][C]0[/C][C]OK[/C][/ROW]
[ROW][C]5% type I error level[/C][C]0[/C][C]0[/C][C]OK[/C][/ROW]
[ROW][C]10% type I error level[/C][C]0[/C][C]0[/C][C]OK[/C][/ROW]
[/TABLE]
Source: https://freestatistics.org/blog/index.php?pk=254563&T=6

Globally Unique Identifier (entire table): ba.freestatistics.org/blog/index.php?pk=254563&T=6

As an alternative you can also use a QR Code:  

The GUIDs for individual cells are displayed in the table below:

Meta Analysis of Goldfeld-Quandt test for Heteroskedasticity
Description# significant tests% significant testsOK/NOK
1% type I error level00OK
5% type I error level00OK
10% type I error level00OK


Parameters (Session):
par1 = 1 ; par2 = Do not include Seasonal Dummies ; par3 = No Linear Trend ;
Parameters (R input):
par1 = 1 ; par2 = Do not include Seasonal Dummies ; par3 = No Linear Trend ;
R code (references can be found in the software module):
library(lattice)
library(lmtest)
n25 <- 25 #minimum number of obs. for Goldfeld-Quandt test
par1 <- as.numeric(par1)
x <- t(y)
k <- length(x[1,])
n <- length(x[,1])
x1 <- cbind(x[,par1], x[,1:k!=par1])
mycolnames <- c(colnames(x)[par1], colnames(x)[1:k!=par1])
colnames(x1) <- mycolnames #colnames(x)[par1]
x <- x1
if (par3 == 'First Differences'){
x2 <- array(0, dim=c(n-1,k), dimnames=list(1:(n-1), paste('(1-B)',colnames(x),sep='')))
for (i in 1:n-1) {
for (j in 1:k) {
x2[i,j] <- x[i+1,j] - x[i,j]
}
}
x <- x2
}
if (par2 == 'Include Monthly Dummies'){
x2 <- array(0, dim=c(n,11), dimnames=list(1:n, paste('M', seq(1:11), sep ='')))
for (i in 1:11){
x2[seq(i,n,12),i] <- 1
}
x <- cbind(x, x2)
}
if (par2 == 'Include Quarterly Dummies'){
x2 <- array(0, dim=c(n,3), dimnames=list(1:n, paste('Q', seq(1:3), sep ='')))
for (i in 1:3){
x2[seq(i,n,4),i] <- 1
}
x <- cbind(x, x2)
}
k <- length(x[1,])
if (par3 == 'Linear Trend'){
x <- cbind(x, c(1:n))
colnames(x)[k+1] <- 't'
}
x
k <- length(x[1,])
df <- as.data.frame(x)
(mylm <- lm(df))
(mysum <- summary(mylm))
if (n > n25) {
kp3 <- k + 3
nmkm3 <- n - k - 3
gqarr <- array(NA, dim=c(nmkm3-kp3+1,3))
numgqtests <- 0
numsignificant1 <- 0
numsignificant5 <- 0
numsignificant10 <- 0
for (mypoint in kp3:nmkm3) {
j <- 0
numgqtests <- numgqtests + 1
for (myalt in c('greater', 'two.sided', 'less')) {
j <- j + 1
gqarr[mypoint-kp3+1,j] <- gqtest(mylm, point=mypoint, alternative=myalt)$p.value
}
if (gqarr[mypoint-kp3+1,2] < 0.01) numsignificant1 <- numsignificant1 + 1
if (gqarr[mypoint-kp3+1,2] < 0.05) numsignificant5 <- numsignificant5 + 1
if (gqarr[mypoint-kp3+1,2] < 0.10) numsignificant10 <- numsignificant10 + 1
}
gqarr
}
bitmap(file='test0.png')
plot(x[,1], type='l', main='Actuals and Interpolation', ylab='value of Actuals and Interpolation (dots)', xlab='time or index')
points(x[,1]-mysum$resid)
grid()
dev.off()
bitmap(file='test1.png')
plot(mysum$resid, type='b', pch=19, main='Residuals', ylab='value of Residuals', xlab='time or index')
grid()
dev.off()
bitmap(file='test2.png')
hist(mysum$resid, main='Residual Histogram', xlab='values of Residuals')
grid()
dev.off()
bitmap(file='test3.png')
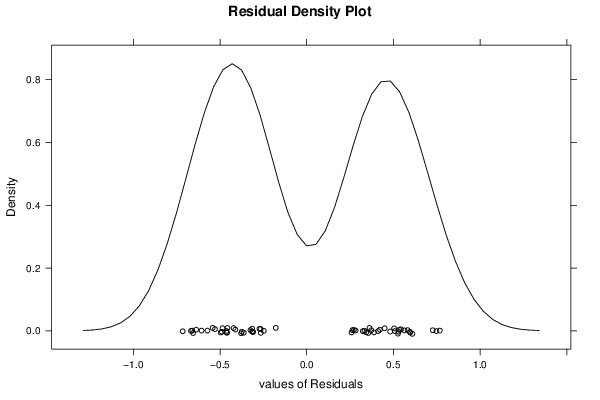
densityplot(~mysum$resid,col='black',main='Residual Density Plot', xlab='values of Residuals')
dev.off()
bitmap(file='test4.png')
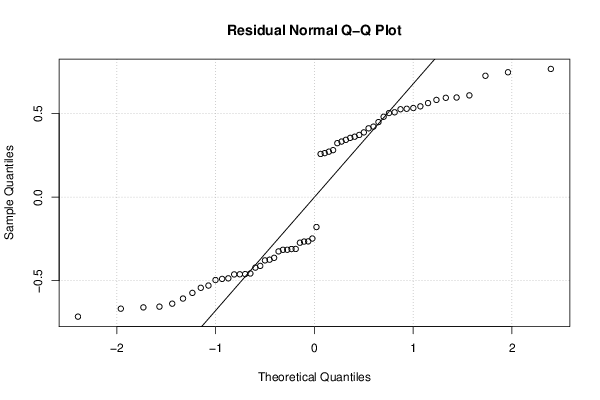
qqnorm(mysum$resid, main='Residual Normal Q-Q Plot')
qqline(mysum$resid)
grid()
dev.off()
(myerror <- as.ts(mysum$resid))
bitmap(file='test5.png')
dum <- cbind(lag(myerror,k=1),myerror)
dum
dum1 <- dum[2:length(myerror),]
dum1
z <- as.data.frame(dum1)
z
plot(z,main=paste('Residual Lag plot, lowess, and regression line'), ylab='values of Residuals', xlab='lagged values of Residuals')
lines(lowess(z))
abline(lm(z))
grid()
dev.off()
bitmap(file='test6.png')
acf(mysum$resid, lag.max=length(mysum$resid)/2, main='Residual Autocorrelation Function')
grid()
dev.off()
bitmap(file='test7.png')
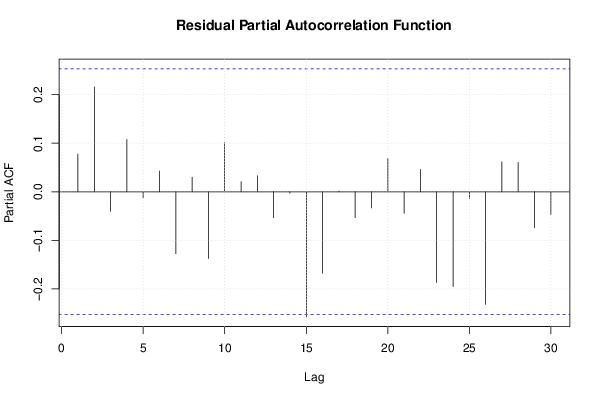
pacf(mysum$resid, lag.max=length(mysum$resid)/2, main='Residual Partial Autocorrelation Function')
grid()
dev.off()
bitmap(file='test8.png')
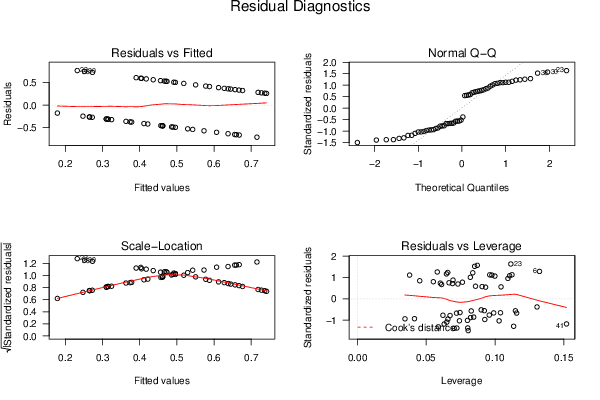
opar <- par(mfrow = c(2,2), oma = c(0, 0, 1.1, 0))
plot(mylm, las = 1, sub='Residual Diagnostics')
par(opar)
dev.off()
if (n > n25) {
bitmap(file='test9.png')
plot(kp3:nmkm3,gqarr[,2], main='Goldfeld-Quandt test',ylab='2-sided p-value',xlab='breakpoint')
grid()
dev.off()
}
load(file='createtable')
a<-table.start()
a<-table.row.start(a)
a<-table.element(a, 'Multiple Linear Regression - Estimated Regression Equation', 1, TRUE)
a<-table.row.end(a)
myeq <- colnames(x)[1]
myeq <- paste(myeq, '[t] = ', sep='')
for (i in 1:k){
if (mysum$coefficients[i,1] > 0) myeq <- paste(myeq, '+', '')
myeq <- paste(myeq, signif(mysum$coefficients[i,1],6), sep=' ')
if (rownames(mysum$coefficients)[i] != '(Intercept)') {
myeq <- paste(myeq, rownames(mysum$coefficients)[i], sep='')
if (rownames(mysum$coefficients)[i] != 't') myeq <- paste(myeq, '[t]', sep='')
}
}
myeq <- paste(myeq, ' + e[t]')
a<-table.row.start(a)
a<-table.element(a, myeq)
a<-table.row.end(a)
a<-table.end(a)
table.save(a,file='mytable1.tab')
a<-table.start()
a<-table.row.start(a)
a<-table.element(a,hyperlink('ols1.htm','Multiple Linear Regression - Ordinary Least Squares',''), 6, TRUE)
a<-table.row.end(a)
a<-table.row.start(a)
a<-table.element(a,'Variable',header=TRUE)
a<-table.element(a,'Parameter',header=TRUE)
a<-table.element(a,'S.D.',header=TRUE)
a<-table.element(a,'T-STAT
H0: parameter = 0',header=TRUE)
a<-table.element(a,'2-tail p-value',header=TRUE)
a<-table.element(a,'1-tail p-value',header=TRUE)
a<-table.row.end(a)
for (i in 1:k){
a<-table.row.start(a)
a<-table.element(a,rownames(mysum$coefficients)[i],header=TRUE)
a<-table.element(a,signif(mysum$coefficients[i,1],6))
a<-table.element(a, signif(mysum$coefficients[i,2],6))
a<-table.element(a, signif(mysum$coefficients[i,3],4))
a<-table.element(a, signif(mysum$coefficients[i,4],6))
a<-table.element(a, signif(mysum$coefficients[i,4]/2,6))
a<-table.row.end(a)
}
a<-table.end(a)
table.save(a,file='mytable2.tab')
a<-table.start()
a<-table.row.start(a)
a<-table.element(a, 'Multiple Linear Regression - Regression Statistics', 2, TRUE)
a<-table.row.end(a)
a<-table.row.start(a)
a<-table.element(a, 'Multiple R',1,TRUE)
a<-table.element(a, signif(sqrt(mysum$r.squared),6))
a<-table.row.end(a)
a<-table.row.start(a)
a<-table.element(a, 'R-squared',1,TRUE)
a<-table.element(a, signif(mysum$r.squared,6))
a<-table.row.end(a)
a<-table.row.start(a)
a<-table.element(a, 'Adjusted R-squared',1,TRUE)
a<-table.element(a, signif(mysum$adj.r.squared,6))
a<-table.row.end(a)
a<-table.row.start(a)
a<-table.element(a, 'F-TEST (value)',1,TRUE)
a<-table.element(a, signif(mysum$fstatistic[1],6))
a<-table.row.end(a)
a<-table.row.start(a)
a<-table.element(a, 'F-TEST (DF numerator)',1,TRUE)
a<-table.element(a, signif(mysum$fstatistic[2],6))
a<-table.row.end(a)
a<-table.row.start(a)
a<-table.element(a, 'F-TEST (DF denominator)',1,TRUE)
a<-table.element(a, signif(mysum$fstatistic[3],6))
a<-table.row.end(a)
a<-table.row.start(a)
a<-table.element(a, 'p-value',1,TRUE)
a<-table.element(a, signif(1-pf(mysum$fstatistic[1],mysum$fstatistic[2],mysum$fstatistic[3]),6))
a<-table.row.end(a)
a<-table.row.start(a)
a<-table.element(a, 'Multiple Linear Regression - Residual Statistics', 2, TRUE)
a<-table.row.end(a)
a<-table.row.start(a)
a<-table.element(a, 'Residual Standard Deviation',1,TRUE)
a<-table.element(a, signif(mysum$sigma,6))
a<-table.row.end(a)
a<-table.row.start(a)
a<-table.element(a, 'Sum Squared Residuals',1,TRUE)
a<-table.element(a, signif(sum(myerror*myerror),6))
a<-table.row.end(a)
a<-table.end(a)
table.save(a,file='mytable3.tab')
a<-table.start()
a<-table.row.start(a)
a<-table.element(a, 'Multiple Linear Regression - Actuals, Interpolation, and Residuals', 4, TRUE)
a<-table.row.end(a)
a<-table.row.start(a)
a<-table.element(a, 'Time or Index', 1, TRUE)
a<-table.element(a, 'Actuals', 1, TRUE)
a<-table.element(a, 'Interpolation
Forecast', 1, TRUE)
a<-table.element(a, 'Residuals
Prediction Error', 1, TRUE)
a<-table.row.end(a)
for (i in 1:n) {
a<-table.row.start(a)
a<-table.element(a,i, 1, TRUE)
a<-table.element(a,signif(x[i],6))
a<-table.element(a,signif(x[i]-mysum$resid[i],6))
a<-table.element(a,signif(mysum$resid[i],6))
a<-table.row.end(a)
}
a<-table.end(a)
table.save(a,file='mytable4.tab')
if (n > n25) {
a<-table.start()
a<-table.row.start(a)
a<-table.element(a,'Goldfeld-Quandt test for Heteroskedasticity',4,TRUE)
a<-table.row.end(a)
a<-table.row.start(a)
a<-table.element(a,'p-values',header=TRUE)
a<-table.element(a,'Alternative Hypothesis',3,header=TRUE)
a<-table.row.end(a)
a<-table.row.start(a)
a<-table.element(a,'breakpoint index',header=TRUE)
a<-table.element(a,'greater',header=TRUE)
a<-table.element(a,'2-sided',header=TRUE)
a<-table.element(a,'less',header=TRUE)
a<-table.row.end(a)
for (mypoint in kp3:nmkm3) {
a<-table.row.start(a)
a<-table.element(a,mypoint,header=TRUE)
a<-table.element(a,signif(gqarr[mypoint-kp3+1,1],6))
a<-table.element(a,signif(gqarr[mypoint-kp3+1,2],6))
a<-table.element(a,signif(gqarr[mypoint-kp3+1,3],6))
a<-table.row.end(a)
}
a<-table.end(a)
table.save(a,file='mytable5.tab')
a<-table.start()
a<-table.row.start(a)
a<-table.element(a,'Meta Analysis of Goldfeld-Quandt test for Heteroskedasticity',4,TRUE)
a<-table.row.end(a)
a<-table.row.start(a)
a<-table.element(a,'Description',header=TRUE)
a<-table.element(a,'# significant tests',header=TRUE)
a<-table.element(a,'% significant tests',header=TRUE)
a<-table.element(a,'OK/NOK',header=TRUE)
a<-table.row.end(a)
a<-table.row.start(a)
a<-table.element(a,'1% type I error level',header=TRUE)
a<-table.element(a,signif(numsignificant1,6))
a<-table.element(a,signif(numsignificant1/numgqtests,6))
if (numsignificant1/numgqtests < 0.01) dum <- 'OK' else dum <- 'NOK'
a<-table.element(a,dum)
a<-table.row.end(a)
a<-table.row.start(a)
a<-table.element(a,'5% type I error level',header=TRUE)
a<-table.element(a,signif(numsignificant5,6))
a<-table.element(a,signif(numsignificant5/numgqtests,6))
if (numsignificant5/numgqtests < 0.05) dum <- 'OK' else dum <- 'NOK'
a<-table.element(a,dum)
a<-table.row.end(a)
a<-table.row.start(a)
a<-table.element(a,'10% type I error level',header=TRUE)
a<-table.element(a,signif(numsignificant10,6))
a<-table.element(a,signif(numsignificant10/numgqtests,6))
if (numsignificant10/numgqtests < 0.1) dum <- 'OK' else dum <- 'NOK'
a<-table.element(a,dum)
a<-table.row.end(a)
a<-table.end(a)
table.save(a,file='mytable6.tab')
}