Free Statistics

of Irreproducible Research!

Author's title

Author*Unverified author*
R Software Modulerwasp_autocorrelation.wasp
Title produced by software(Partial) Autocorrelation Function
Date of computationThu, 13 Nov 2014 07:41:19 +0000
Cite this page as followsStatistical Computations at FreeStatistics.org, Office for Research Development and Education, URL https://freestatistics.org/blog/index.php?v=date/2014/Nov/13/t14158644998j9gxtrgykuw7vm.htm/, Retrieved Sun, 19 May 2024 10:52:01 +0000
Statistical Computations at FreeStatistics.org, Office for Research Development and Education, URL https://freestatistics.org/blog/index.php?pk=254086, Retrieved Sun, 19 May 2024 10:52:01 +0000
QR Codes:

Original text written by user:
IsPrivate?No (this computation is public)
User-defined keywords
Estimated Impact116
Family? (F = Feedback message, R = changed R code, M = changed R Module, P = changed Parameters, D = changed Data)
-       [(Partial) Autocorrelation Function] [] [2014-11-13 07:41:19] [0c3693ead1e3fa463b40b3108c1b2028] [Current]
Feedback Forum

Post a new message
Dataseries X:
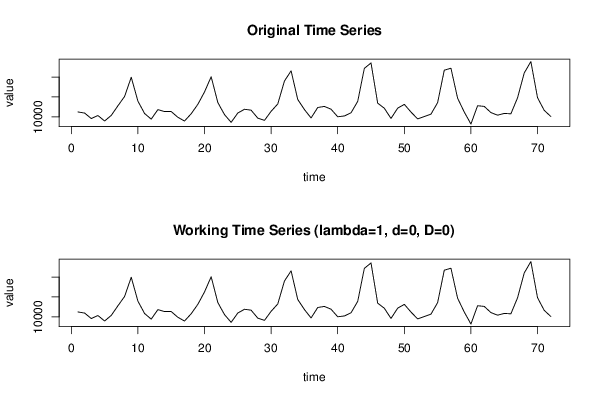
11236
10954
9580
10337
8961
10372
12782
15119
19940
13957
10849
9429
11816
11329
11334
9898
8961
10783
13149
16244
20067
13601
10573
8623
10962
11911
11677
9679
9116
11394
13240
18983
21545
14360
11839
9726
12347
12624
11918
10028
10228
11026
13878
22165
23533
13445
12164
9606
12177
13142
11210
9485
10082
10680
13579
21709
22205
14687
11222
8196
12794
12627
11080
10425
10865
10771
14771
20993
23882
14825
11648
10091


Summary of computational transaction
Raw Inputview raw input (R code)
Raw Outputview raw output of R engine
Computing time1 seconds
R Server'Gwilym Jenkins' @ jenkins.wessa.net

\begin{tabular}{lllllllll}
\hline
Summary of computational transaction \tabularnewline
Raw Input & view raw input (R code)  \tabularnewline
Raw Output & view raw output of R engine  \tabularnewline
Computing time & 1 seconds \tabularnewline
R Server & 'Gwilym Jenkins' @ jenkins.wessa.net \tabularnewline
\hline
\end{tabular}
%Source: https://freestatistics.org/blog/index.php?pk=254086&T=0

[TABLE]
[ROW][C]Summary of computational transaction[/C][/ROW]
[ROW][C]Raw Input[/C][C]view raw input (R code) [/C][/ROW]
[ROW][C]Raw Output[/C][C]view raw output of R engine [/C][/ROW]
[ROW][C]Computing time[/C][C]1 seconds[/C][/ROW]
[ROW][C]R Server[/C][C]'Gwilym Jenkins' @ jenkins.wessa.net[/C][/ROW]
[/TABLE]
Source: https://freestatistics.org/blog/index.php?pk=254086&T=0

Globally Unique Identifier (entire table): ba.freestatistics.org/blog/index.php?pk=254086&T=0

As an alternative you can also use a QR Code:  

The GUIDs for individual cells are displayed in the table below:

Summary of computational transaction
Raw Inputview raw input (R code)
Raw Outputview raw output of R engine
Computing time1 seconds
R Server'Gwilym Jenkins' @ jenkins.wessa.net


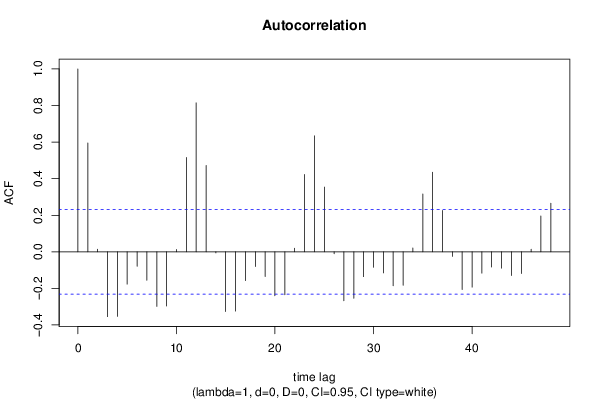
Autocorrelation Function
Time lag kACF(k)T-STATP-value
10.5955515.05342e-06
20.0143720.1220.451639
3-0.354449-3.00760.001813
4-0.353018-2.99550.001878
5-0.176521-1.49780.069274
6-0.078848-0.6690.252802
7-0.155813-1.32210.095157
8-0.298288-2.53110.006778
9-0.295932-2.51110.007141
100.0125140.10620.457865
110.5159954.37842e-05
120.8144496.91080
130.4723774.00837.4e-05
14-0.005832-0.04950.480336
15-0.32598-2.7660.003602
16-0.324068-2.74980.003767
17-0.157301-1.33470.093083
18-0.080414-0.68230.248608
19-0.135012-1.14560.127873
20-0.240204-2.03820.022602
21-0.235089-1.99480.024926
220.0191860.16280.435566
230.4225173.58520.000305
240.6339745.37950
250.3539313.00320.001836
26-0.010242-0.08690.465493
27-0.26798-2.27390.012978
28-0.254269-2.15750.01715
29-0.135699-1.15140.126679
30-0.083909-0.7120.239385
31-0.115054-0.97630.1661
32-0.185637-1.57520.059799
33-0.183012-1.55290.062415
340.0208210.17670.430133
350.3167142.68740.004469
360.4350863.69180.000215
370.2264951.92190.02929
38-0.024887-0.21120.416675
39-0.205727-1.74560.042569
40-0.19301-1.63770.052919
41-0.116669-0.990.162752
42-0.082669-0.70150.242637
43-0.089183-0.75670.225837
44-0.12927-1.09690.138172
45-0.118581-1.00620.158846
460.0137190.11640.453827
470.1959561.66270.050356
480.2654262.25220.013679

\begin{tabular}{lllllllll}
\hline
Autocorrelation Function \tabularnewline
Time lag k & ACF(k) & T-STAT & P-value \tabularnewline
1 & 0.595551 & 5.0534 & 2e-06 \tabularnewline
2 & 0.014372 & 0.122 & 0.451639 \tabularnewline
3 & -0.354449 & -3.0076 & 0.001813 \tabularnewline
4 & -0.353018 & -2.9955 & 0.001878 \tabularnewline
5 & -0.176521 & -1.4978 & 0.069274 \tabularnewline
6 & -0.078848 & -0.669 & 0.252802 \tabularnewline
7 & -0.155813 & -1.3221 & 0.095157 \tabularnewline
8 & -0.298288 & -2.5311 & 0.006778 \tabularnewline
9 & -0.295932 & -2.5111 & 0.007141 \tabularnewline
10 & 0.012514 & 0.1062 & 0.457865 \tabularnewline
11 & 0.515995 & 4.3784 & 2e-05 \tabularnewline
12 & 0.814449 & 6.9108 & 0 \tabularnewline
13 & 0.472377 & 4.0083 & 7.4e-05 \tabularnewline
14 & -0.005832 & -0.0495 & 0.480336 \tabularnewline
15 & -0.32598 & -2.766 & 0.003602 \tabularnewline
16 & -0.324068 & -2.7498 & 0.003767 \tabularnewline
17 & -0.157301 & -1.3347 & 0.093083 \tabularnewline
18 & -0.080414 & -0.6823 & 0.248608 \tabularnewline
19 & -0.135012 & -1.1456 & 0.127873 \tabularnewline
20 & -0.240204 & -2.0382 & 0.022602 \tabularnewline
21 & -0.235089 & -1.9948 & 0.024926 \tabularnewline
22 & 0.019186 & 0.1628 & 0.435566 \tabularnewline
23 & 0.422517 & 3.5852 & 0.000305 \tabularnewline
24 & 0.633974 & 5.3795 & 0 \tabularnewline
25 & 0.353931 & 3.0032 & 0.001836 \tabularnewline
26 & -0.010242 & -0.0869 & 0.465493 \tabularnewline
27 & -0.26798 & -2.2739 & 0.012978 \tabularnewline
28 & -0.254269 & -2.1575 & 0.01715 \tabularnewline
29 & -0.135699 & -1.1514 & 0.126679 \tabularnewline
30 & -0.083909 & -0.712 & 0.239385 \tabularnewline
31 & -0.115054 & -0.9763 & 0.1661 \tabularnewline
32 & -0.185637 & -1.5752 & 0.059799 \tabularnewline
33 & -0.183012 & -1.5529 & 0.062415 \tabularnewline
34 & 0.020821 & 0.1767 & 0.430133 \tabularnewline
35 & 0.316714 & 2.6874 & 0.004469 \tabularnewline
36 & 0.435086 & 3.6918 & 0.000215 \tabularnewline
37 & 0.226495 & 1.9219 & 0.02929 \tabularnewline
38 & -0.024887 & -0.2112 & 0.416675 \tabularnewline
39 & -0.205727 & -1.7456 & 0.042569 \tabularnewline
40 & -0.19301 & -1.6377 & 0.052919 \tabularnewline
41 & -0.116669 & -0.99 & 0.162752 \tabularnewline
42 & -0.082669 & -0.7015 & 0.242637 \tabularnewline
43 & -0.089183 & -0.7567 & 0.225837 \tabularnewline
44 & -0.12927 & -1.0969 & 0.138172 \tabularnewline
45 & -0.118581 & -1.0062 & 0.158846 \tabularnewline
46 & 0.013719 & 0.1164 & 0.453827 \tabularnewline
47 & 0.195956 & 1.6627 & 0.050356 \tabularnewline
48 & 0.265426 & 2.2522 & 0.013679 \tabularnewline
\hline
\end{tabular}
%Source: https://freestatistics.org/blog/index.php?pk=254086&T=1

[TABLE]
[ROW][C]Autocorrelation Function[/C][/ROW]
[ROW][C]Time lag k[/C][C]ACF(k)[/C][C]T-STAT[/C][C]P-value[/C][/ROW]
[ROW][C]1[/C][C]0.595551[/C][C]5.0534[/C][C]2e-06[/C][/ROW]
[ROW][C]2[/C][C]0.014372[/C][C]0.122[/C][C]0.451639[/C][/ROW]
[ROW][C]3[/C][C]-0.354449[/C][C]-3.0076[/C][C]0.001813[/C][/ROW]
[ROW][C]4[/C][C]-0.353018[/C][C]-2.9955[/C][C]0.001878[/C][/ROW]
[ROW][C]5[/C][C]-0.176521[/C][C]-1.4978[/C][C]0.069274[/C][/ROW]
[ROW][C]6[/C][C]-0.078848[/C][C]-0.669[/C][C]0.252802[/C][/ROW]
[ROW][C]7[/C][C]-0.155813[/C][C]-1.3221[/C][C]0.095157[/C][/ROW]
[ROW][C]8[/C][C]-0.298288[/C][C]-2.5311[/C][C]0.006778[/C][/ROW]
[ROW][C]9[/C][C]-0.295932[/C][C]-2.5111[/C][C]0.007141[/C][/ROW]
[ROW][C]10[/C][C]0.012514[/C][C]0.1062[/C][C]0.457865[/C][/ROW]
[ROW][C]11[/C][C]0.515995[/C][C]4.3784[/C][C]2e-05[/C][/ROW]
[ROW][C]12[/C][C]0.814449[/C][C]6.9108[/C][C]0[/C][/ROW]
[ROW][C]13[/C][C]0.472377[/C][C]4.0083[/C][C]7.4e-05[/C][/ROW]
[ROW][C]14[/C][C]-0.005832[/C][C]-0.0495[/C][C]0.480336[/C][/ROW]
[ROW][C]15[/C][C]-0.32598[/C][C]-2.766[/C][C]0.003602[/C][/ROW]
[ROW][C]16[/C][C]-0.324068[/C][C]-2.7498[/C][C]0.003767[/C][/ROW]
[ROW][C]17[/C][C]-0.157301[/C][C]-1.3347[/C][C]0.093083[/C][/ROW]
[ROW][C]18[/C][C]-0.080414[/C][C]-0.6823[/C][C]0.248608[/C][/ROW]
[ROW][C]19[/C][C]-0.135012[/C][C]-1.1456[/C][C]0.127873[/C][/ROW]
[ROW][C]20[/C][C]-0.240204[/C][C]-2.0382[/C][C]0.022602[/C][/ROW]
[ROW][C]21[/C][C]-0.235089[/C][C]-1.9948[/C][C]0.024926[/C][/ROW]
[ROW][C]22[/C][C]0.019186[/C][C]0.1628[/C][C]0.435566[/C][/ROW]
[ROW][C]23[/C][C]0.422517[/C][C]3.5852[/C][C]0.000305[/C][/ROW]
[ROW][C]24[/C][C]0.633974[/C][C]5.3795[/C][C]0[/C][/ROW]
[ROW][C]25[/C][C]0.353931[/C][C]3.0032[/C][C]0.001836[/C][/ROW]
[ROW][C]26[/C][C]-0.010242[/C][C]-0.0869[/C][C]0.465493[/C][/ROW]
[ROW][C]27[/C][C]-0.26798[/C][C]-2.2739[/C][C]0.012978[/C][/ROW]
[ROW][C]28[/C][C]-0.254269[/C][C]-2.1575[/C][C]0.01715[/C][/ROW]
[ROW][C]29[/C][C]-0.135699[/C][C]-1.1514[/C][C]0.126679[/C][/ROW]
[ROW][C]30[/C][C]-0.083909[/C][C]-0.712[/C][C]0.239385[/C][/ROW]
[ROW][C]31[/C][C]-0.115054[/C][C]-0.9763[/C][C]0.1661[/C][/ROW]
[ROW][C]32[/C][C]-0.185637[/C][C]-1.5752[/C][C]0.059799[/C][/ROW]
[ROW][C]33[/C][C]-0.183012[/C][C]-1.5529[/C][C]0.062415[/C][/ROW]
[ROW][C]34[/C][C]0.020821[/C][C]0.1767[/C][C]0.430133[/C][/ROW]
[ROW][C]35[/C][C]0.316714[/C][C]2.6874[/C][C]0.004469[/C][/ROW]
[ROW][C]36[/C][C]0.435086[/C][C]3.6918[/C][C]0.000215[/C][/ROW]
[ROW][C]37[/C][C]0.226495[/C][C]1.9219[/C][C]0.02929[/C][/ROW]
[ROW][C]38[/C][C]-0.024887[/C][C]-0.2112[/C][C]0.416675[/C][/ROW]
[ROW][C]39[/C][C]-0.205727[/C][C]-1.7456[/C][C]0.042569[/C][/ROW]
[ROW][C]40[/C][C]-0.19301[/C][C]-1.6377[/C][C]0.052919[/C][/ROW]
[ROW][C]41[/C][C]-0.116669[/C][C]-0.99[/C][C]0.162752[/C][/ROW]
[ROW][C]42[/C][C]-0.082669[/C][C]-0.7015[/C][C]0.242637[/C][/ROW]
[ROW][C]43[/C][C]-0.089183[/C][C]-0.7567[/C][C]0.225837[/C][/ROW]
[ROW][C]44[/C][C]-0.12927[/C][C]-1.0969[/C][C]0.138172[/C][/ROW]
[ROW][C]45[/C][C]-0.118581[/C][C]-1.0062[/C][C]0.158846[/C][/ROW]
[ROW][C]46[/C][C]0.013719[/C][C]0.1164[/C][C]0.453827[/C][/ROW]
[ROW][C]47[/C][C]0.195956[/C][C]1.6627[/C][C]0.050356[/C][/ROW]
[ROW][C]48[/C][C]0.265426[/C][C]2.2522[/C][C]0.013679[/C][/ROW]
[/TABLE]
Source: https://freestatistics.org/blog/index.php?pk=254086&T=1

Globally Unique Identifier (entire table): ba.freestatistics.org/blog/index.php?pk=254086&T=1

As an alternative you can also use a QR Code:  

The GUIDs for individual cells are displayed in the table below:

Autocorrelation Function
Time lag kACF(k)T-STATP-value
10.5955515.05342e-06
20.0143720.1220.451639
3-0.354449-3.00760.001813
4-0.353018-2.99550.001878
5-0.176521-1.49780.069274
6-0.078848-0.6690.252802
7-0.155813-1.32210.095157
8-0.298288-2.53110.006778
9-0.295932-2.51110.007141
100.0125140.10620.457865
110.5159954.37842e-05
120.8144496.91080
130.4723774.00837.4e-05
14-0.005832-0.04950.480336
15-0.32598-2.7660.003602
16-0.324068-2.74980.003767
17-0.157301-1.33470.093083
18-0.080414-0.68230.248608
19-0.135012-1.14560.127873
20-0.240204-2.03820.022602
21-0.235089-1.99480.024926
220.0191860.16280.435566
230.4225173.58520.000305
240.6339745.37950
250.3539313.00320.001836
26-0.010242-0.08690.465493
27-0.26798-2.27390.012978
28-0.254269-2.15750.01715
29-0.135699-1.15140.126679
30-0.083909-0.7120.239385
31-0.115054-0.97630.1661
32-0.185637-1.57520.059799
33-0.183012-1.55290.062415
340.0208210.17670.430133
350.3167142.68740.004469
360.4350863.69180.000215
370.2264951.92190.02929
38-0.024887-0.21120.416675
39-0.205727-1.74560.042569
40-0.19301-1.63770.052919
41-0.116669-0.990.162752
42-0.082669-0.70150.242637
43-0.089183-0.75670.225837
44-0.12927-1.09690.138172
45-0.118581-1.00620.158846
460.0137190.11640.453827
470.1959561.66270.050356
480.2654262.25220.013679


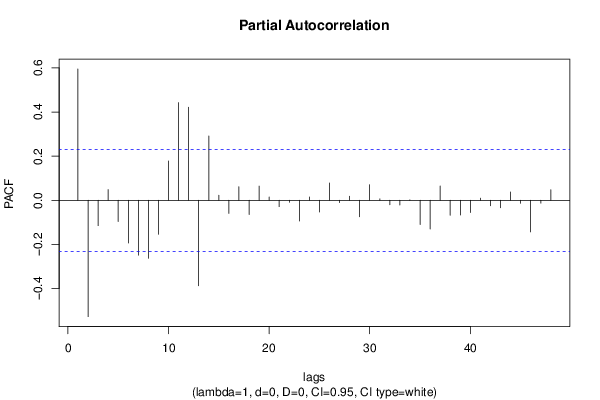
Partial Autocorrelation Function
Time lag kPACF(k)T-STATP-value
10.5955515.05342e-06
2-0.52735-4.47471.4e-05
3-0.114751-0.97370.166734
40.0486450.41280.340501
5-0.096283-0.8170.208315
6-0.19388-1.64510.052151
7-0.248452-2.10820.019248
8-0.262692-2.2290.014467
9-0.154204-1.30850.097438
100.1784051.51380.067225
110.4429353.75840.000172
120.4219883.58070.000309
13-0.387226-3.28570.000787
140.2916512.47470.007845
150.0228130.19360.423526
16-0.059114-0.50160.30874
170.0617670.52410.300905
18-0.064094-0.54390.294111
190.0644470.54690.293086
200.0152450.12940.448716
21-0.028672-0.24330.404237
22-0.008643-0.07330.47087
23-0.093876-0.79660.214162
240.0152820.12970.448593
25-0.052768-0.44780.327839
260.0788530.66910.252788
27-0.010329-0.08760.465203
280.0183610.15580.438314
29-0.074483-0.6320.26469
300.0703080.59660.276328
310.006640.05630.477612
32-0.020317-0.17240.431805
33-0.021455-0.18210.428025
340.0020910.01770.492948
35-0.109648-0.93040.177638
36-0.129755-1.1010.13728
370.0647870.54970.2921
38-0.067579-0.57340.284072
39-0.066817-0.5670.286251
40-0.055175-0.46820.320537
410.0098650.08370.466762
42-0.024828-0.21070.416868
43-0.033487-0.28410.388556
440.0374060.31740.37593
45-0.013574-0.11520.454313
46-0.143185-1.2150.114175
47-0.012819-0.10880.456843
480.0482290.40920.341792

\begin{tabular}{lllllllll}
\hline
Partial Autocorrelation Function \tabularnewline
Time lag k & PACF(k) & T-STAT & P-value \tabularnewline
1 & 0.595551 & 5.0534 & 2e-06 \tabularnewline
2 & -0.52735 & -4.4747 & 1.4e-05 \tabularnewline
3 & -0.114751 & -0.9737 & 0.166734 \tabularnewline
4 & 0.048645 & 0.4128 & 0.340501 \tabularnewline
5 & -0.096283 & -0.817 & 0.208315 \tabularnewline
6 & -0.19388 & -1.6451 & 0.052151 \tabularnewline
7 & -0.248452 & -2.1082 & 0.019248 \tabularnewline
8 & -0.262692 & -2.229 & 0.014467 \tabularnewline
9 & -0.154204 & -1.3085 & 0.097438 \tabularnewline
10 & 0.178405 & 1.5138 & 0.067225 \tabularnewline
11 & 0.442935 & 3.7584 & 0.000172 \tabularnewline
12 & 0.421988 & 3.5807 & 0.000309 \tabularnewline
13 & -0.387226 & -3.2857 & 0.000787 \tabularnewline
14 & 0.291651 & 2.4747 & 0.007845 \tabularnewline
15 & 0.022813 & 0.1936 & 0.423526 \tabularnewline
16 & -0.059114 & -0.5016 & 0.30874 \tabularnewline
17 & 0.061767 & 0.5241 & 0.300905 \tabularnewline
18 & -0.064094 & -0.5439 & 0.294111 \tabularnewline
19 & 0.064447 & 0.5469 & 0.293086 \tabularnewline
20 & 0.015245 & 0.1294 & 0.448716 \tabularnewline
21 & -0.028672 & -0.2433 & 0.404237 \tabularnewline
22 & -0.008643 & -0.0733 & 0.47087 \tabularnewline
23 & -0.093876 & -0.7966 & 0.214162 \tabularnewline
24 & 0.015282 & 0.1297 & 0.448593 \tabularnewline
25 & -0.052768 & -0.4478 & 0.327839 \tabularnewline
26 & 0.078853 & 0.6691 & 0.252788 \tabularnewline
27 & -0.010329 & -0.0876 & 0.465203 \tabularnewline
28 & 0.018361 & 0.1558 & 0.438314 \tabularnewline
29 & -0.074483 & -0.632 & 0.26469 \tabularnewline
30 & 0.070308 & 0.5966 & 0.276328 \tabularnewline
31 & 0.00664 & 0.0563 & 0.477612 \tabularnewline
32 & -0.020317 & -0.1724 & 0.431805 \tabularnewline
33 & -0.021455 & -0.1821 & 0.428025 \tabularnewline
34 & 0.002091 & 0.0177 & 0.492948 \tabularnewline
35 & -0.109648 & -0.9304 & 0.177638 \tabularnewline
36 & -0.129755 & -1.101 & 0.13728 \tabularnewline
37 & 0.064787 & 0.5497 & 0.2921 \tabularnewline
38 & -0.067579 & -0.5734 & 0.284072 \tabularnewline
39 & -0.066817 & -0.567 & 0.286251 \tabularnewline
40 & -0.055175 & -0.4682 & 0.320537 \tabularnewline
41 & 0.009865 & 0.0837 & 0.466762 \tabularnewline
42 & -0.024828 & -0.2107 & 0.416868 \tabularnewline
43 & -0.033487 & -0.2841 & 0.388556 \tabularnewline
44 & 0.037406 & 0.3174 & 0.37593 \tabularnewline
45 & -0.013574 & -0.1152 & 0.454313 \tabularnewline
46 & -0.143185 & -1.215 & 0.114175 \tabularnewline
47 & -0.012819 & -0.1088 & 0.456843 \tabularnewline
48 & 0.048229 & 0.4092 & 0.341792 \tabularnewline
\hline
\end{tabular}
%Source: https://freestatistics.org/blog/index.php?pk=254086&T=2

[TABLE]
[ROW][C]Partial Autocorrelation Function[/C][/ROW]
[ROW][C]Time lag k[/C][C]PACF(k)[/C][C]T-STAT[/C][C]P-value[/C][/ROW]
[ROW][C]1[/C][C]0.595551[/C][C]5.0534[/C][C]2e-06[/C][/ROW]
[ROW][C]2[/C][C]-0.52735[/C][C]-4.4747[/C][C]1.4e-05[/C][/ROW]
[ROW][C]3[/C][C]-0.114751[/C][C]-0.9737[/C][C]0.166734[/C][/ROW]
[ROW][C]4[/C][C]0.048645[/C][C]0.4128[/C][C]0.340501[/C][/ROW]
[ROW][C]5[/C][C]-0.096283[/C][C]-0.817[/C][C]0.208315[/C][/ROW]
[ROW][C]6[/C][C]-0.19388[/C][C]-1.6451[/C][C]0.052151[/C][/ROW]
[ROW][C]7[/C][C]-0.248452[/C][C]-2.1082[/C][C]0.019248[/C][/ROW]
[ROW][C]8[/C][C]-0.262692[/C][C]-2.229[/C][C]0.014467[/C][/ROW]
[ROW][C]9[/C][C]-0.154204[/C][C]-1.3085[/C][C]0.097438[/C][/ROW]
[ROW][C]10[/C][C]0.178405[/C][C]1.5138[/C][C]0.067225[/C][/ROW]
[ROW][C]11[/C][C]0.442935[/C][C]3.7584[/C][C]0.000172[/C][/ROW]
[ROW][C]12[/C][C]0.421988[/C][C]3.5807[/C][C]0.000309[/C][/ROW]
[ROW][C]13[/C][C]-0.387226[/C][C]-3.2857[/C][C]0.000787[/C][/ROW]
[ROW][C]14[/C][C]0.291651[/C][C]2.4747[/C][C]0.007845[/C][/ROW]
[ROW][C]15[/C][C]0.022813[/C][C]0.1936[/C][C]0.423526[/C][/ROW]
[ROW][C]16[/C][C]-0.059114[/C][C]-0.5016[/C][C]0.30874[/C][/ROW]
[ROW][C]17[/C][C]0.061767[/C][C]0.5241[/C][C]0.300905[/C][/ROW]
[ROW][C]18[/C][C]-0.064094[/C][C]-0.5439[/C][C]0.294111[/C][/ROW]
[ROW][C]19[/C][C]0.064447[/C][C]0.5469[/C][C]0.293086[/C][/ROW]
[ROW][C]20[/C][C]0.015245[/C][C]0.1294[/C][C]0.448716[/C][/ROW]
[ROW][C]21[/C][C]-0.028672[/C][C]-0.2433[/C][C]0.404237[/C][/ROW]
[ROW][C]22[/C][C]-0.008643[/C][C]-0.0733[/C][C]0.47087[/C][/ROW]
[ROW][C]23[/C][C]-0.093876[/C][C]-0.7966[/C][C]0.214162[/C][/ROW]
[ROW][C]24[/C][C]0.015282[/C][C]0.1297[/C][C]0.448593[/C][/ROW]
[ROW][C]25[/C][C]-0.052768[/C][C]-0.4478[/C][C]0.327839[/C][/ROW]
[ROW][C]26[/C][C]0.078853[/C][C]0.6691[/C][C]0.252788[/C][/ROW]
[ROW][C]27[/C][C]-0.010329[/C][C]-0.0876[/C][C]0.465203[/C][/ROW]
[ROW][C]28[/C][C]0.018361[/C][C]0.1558[/C][C]0.438314[/C][/ROW]
[ROW][C]29[/C][C]-0.074483[/C][C]-0.632[/C][C]0.26469[/C][/ROW]
[ROW][C]30[/C][C]0.070308[/C][C]0.5966[/C][C]0.276328[/C][/ROW]
[ROW][C]31[/C][C]0.00664[/C][C]0.0563[/C][C]0.477612[/C][/ROW]
[ROW][C]32[/C][C]-0.020317[/C][C]-0.1724[/C][C]0.431805[/C][/ROW]
[ROW][C]33[/C][C]-0.021455[/C][C]-0.1821[/C][C]0.428025[/C][/ROW]
[ROW][C]34[/C][C]0.002091[/C][C]0.0177[/C][C]0.492948[/C][/ROW]
[ROW][C]35[/C][C]-0.109648[/C][C]-0.9304[/C][C]0.177638[/C][/ROW]
[ROW][C]36[/C][C]-0.129755[/C][C]-1.101[/C][C]0.13728[/C][/ROW]
[ROW][C]37[/C][C]0.064787[/C][C]0.5497[/C][C]0.2921[/C][/ROW]
[ROW][C]38[/C][C]-0.067579[/C][C]-0.5734[/C][C]0.284072[/C][/ROW]
[ROW][C]39[/C][C]-0.066817[/C][C]-0.567[/C][C]0.286251[/C][/ROW]
[ROW][C]40[/C][C]-0.055175[/C][C]-0.4682[/C][C]0.320537[/C][/ROW]
[ROW][C]41[/C][C]0.009865[/C][C]0.0837[/C][C]0.466762[/C][/ROW]
[ROW][C]42[/C][C]-0.024828[/C][C]-0.2107[/C][C]0.416868[/C][/ROW]
[ROW][C]43[/C][C]-0.033487[/C][C]-0.2841[/C][C]0.388556[/C][/ROW]
[ROW][C]44[/C][C]0.037406[/C][C]0.3174[/C][C]0.37593[/C][/ROW]
[ROW][C]45[/C][C]-0.013574[/C][C]-0.1152[/C][C]0.454313[/C][/ROW]
[ROW][C]46[/C][C]-0.143185[/C][C]-1.215[/C][C]0.114175[/C][/ROW]
[ROW][C]47[/C][C]-0.012819[/C][C]-0.1088[/C][C]0.456843[/C][/ROW]
[ROW][C]48[/C][C]0.048229[/C][C]0.4092[/C][C]0.341792[/C][/ROW]
[/TABLE]
Source: https://freestatistics.org/blog/index.php?pk=254086&T=2

Globally Unique Identifier (entire table): ba.freestatistics.org/blog/index.php?pk=254086&T=2

As an alternative you can also use a QR Code:  

The GUIDs for individual cells are displayed in the table below:

Partial Autocorrelation Function
Time lag kPACF(k)T-STATP-value
10.5955515.05342e-06
2-0.52735-4.47471.4e-05
3-0.114751-0.97370.166734
40.0486450.41280.340501
5-0.096283-0.8170.208315
6-0.19388-1.64510.052151
7-0.248452-2.10820.019248
8-0.262692-2.2290.014467
9-0.154204-1.30850.097438
100.1784051.51380.067225
110.4429353.75840.000172
120.4219883.58070.000309
13-0.387226-3.28570.000787
140.2916512.47470.007845
150.0228130.19360.423526
16-0.059114-0.50160.30874
170.0617670.52410.300905
18-0.064094-0.54390.294111
190.0644470.54690.293086
200.0152450.12940.448716
21-0.028672-0.24330.404237
22-0.008643-0.07330.47087
23-0.093876-0.79660.214162
240.0152820.12970.448593
25-0.052768-0.44780.327839
260.0788530.66910.252788
27-0.010329-0.08760.465203
280.0183610.15580.438314
29-0.074483-0.6320.26469
300.0703080.59660.276328
310.006640.05630.477612
32-0.020317-0.17240.431805
33-0.021455-0.18210.428025
340.0020910.01770.492948
35-0.109648-0.93040.177638
36-0.129755-1.1010.13728
370.0647870.54970.2921
38-0.067579-0.57340.284072
39-0.066817-0.5670.286251
40-0.055175-0.46820.320537
410.0098650.08370.466762
42-0.024828-0.21070.416868
43-0.033487-0.28410.388556
440.0374060.31740.37593
45-0.013574-0.11520.454313
46-0.143185-1.2150.114175
47-0.012819-0.10880.456843
480.0482290.40920.341792


Parameters (Session):
par1 = 48 ; par2 = 1 ; par3 = 0 ; par4 = 0 ; par5 = 12 ; par6 = White Noise ; par7 = 0.95 ;
Parameters (R input):
par1 = 48 ; par2 = 1 ; par3 = 0 ; par4 = 0 ; par5 = 12 ; par6 = White Noise ; par7 = 0.95 ; par8 = ;
R code (references can be found in the software module):
par8 <- ''
par7 <- '0.95'
par6 <- 'White Noise'
par5 <- '12'
par4 <- '0'
par3 <- '0'
par2 <- '1'
par1 <- '48'
if (par1 == 'Default') {
par1 = 10*log10(length(x))
} else {
par1 <- as.numeric(par1)
}
par2 <- as.numeric(par2)
par3 <- as.numeric(par3)
par4 <- as.numeric(par4)
par5 <- as.numeric(par5)
if (par6 == 'White Noise') par6 <- 'white' else par6 <- 'ma'
par7 <- as.numeric(par7)
if (par8 != '') par8 <- as.numeric(par8)
ox <- x
if (par8 == '') {
if (par2 == 0) {
x <- log(x)
} else {
x <- (x ^ par2 - 1) / par2
}
} else {
x <- log(x,base=par8)
}
if (par3 > 0) x <- diff(x,lag=1,difference=par3)
if (par4 > 0) x <- diff(x,lag=par5,difference=par4)
bitmap(file='picts.png')
op <- par(mfrow=c(2,1))
plot(ox,type='l',main='Original Time Series',xlab='time',ylab='value')
if (par8=='') {
mytitle <- paste('Working Time Series (lambda=',par2,', d=',par3,', D=',par4,')',sep='')
mysub <- paste('(lambda=',par2,', d=',par3,', D=',par4,', CI=', par7, ', CI type=',par6,')',sep='')
} else {
mytitle <- paste('Working Time Series (base=',par8,', d=',par3,', D=',par4,')',sep='')
mysub <- paste('(base=',par8,', d=',par3,', D=',par4,', CI=', par7, ', CI type=',par6,')',sep='')
}
plot(x,type='l', main=mytitle,xlab='time',ylab='value')
par(op)
dev.off()
bitmap(file='pic1.png')
racf <- acf(x, par1, main='Autocorrelation', xlab='time lag', ylab='ACF', ci.type=par6, ci=par7, sub=mysub)
dev.off()
bitmap(file='pic2.png')
rpacf <- pacf(x,par1,main='Partial Autocorrelation',xlab='lags',ylab='PACF',sub=mysub)
dev.off()
(myacf <- c(racf$acf))
(mypacf <- c(rpacf$acf))
lengthx <- length(x)
sqrtn <- sqrt(lengthx)
load(file='createtable')
a<-table.start()
a<-table.row.start(a)
a<-table.element(a,'Autocorrelation Function',4,TRUE)
a<-table.row.end(a)
a<-table.row.start(a)
a<-table.element(a,'Time lag k',header=TRUE)
a<-table.element(a,hyperlink('basics.htm','ACF(k)','click here for more information about the Autocorrelation Function'),header=TRUE)
a<-table.element(a,'T-STAT',header=TRUE)
a<-table.element(a,'P-value',header=TRUE)
a<-table.row.end(a)
for (i in 2:(par1+1)) {
a<-table.row.start(a)
a<-table.element(a,i-1,header=TRUE)
a<-table.element(a,round(myacf[i],6))
mytstat <- myacf[i]*sqrtn
a<-table.element(a,round(mytstat,4))
a<-table.element(a,round(1-pt(abs(mytstat),lengthx),6))
a<-table.row.end(a)
}
a<-table.end(a)
table.save(a,file='mytable.tab')
a<-table.start()
a<-table.row.start(a)
a<-table.element(a,'Partial Autocorrelation Function',4,TRUE)
a<-table.row.end(a)
a<-table.row.start(a)
a<-table.element(a,'Time lag k',header=TRUE)
a<-table.element(a,hyperlink('basics.htm','PACF(k)','click here for more information about the Partial Autocorrelation Function'),header=TRUE)
a<-table.element(a,'T-STAT',header=TRUE)
a<-table.element(a,'P-value',header=TRUE)
a<-table.row.end(a)
for (i in 1:par1) {
a<-table.row.start(a)
a<-table.element(a,i,header=TRUE)
a<-table.element(a,round(mypacf[i],6))
mytstat <- mypacf[i]*sqrtn
a<-table.element(a,round(mytstat,4))
a<-table.element(a,round(1-pt(abs(mytstat),lengthx),6))
a<-table.row.end(a)
}
a<-table.end(a)
table.save(a,file='mytable1.tab')