Free Statistics

of Irreproducible Research!

Author's title

Author*The author of this computation has been verified*
R Software Modulerwasp_bootstrapplot1.wasp
Title produced by softwareBootstrap Plot - Central Tendency
Date of computationThu, 13 Nov 2014 07:39:21 +0000
Cite this page as followsStatistical Computations at FreeStatistics.org, Office for Research Development and Education, URL https://freestatistics.org/blog/index.php?v=date/2014/Nov/13/t1415864408xikd303krhreznj.htm/, Retrieved Sun, 19 May 2024 10:48:42 +0000
Statistical Computations at FreeStatistics.org, Office for Research Development and Education, URL https://freestatistics.org/blog/index.php?pk=254085, Retrieved Sun, 19 May 2024 10:48:42 +0000
QR Codes:

Original text written by user:
IsPrivate?No (this computation is public)
User-defined keywords
Estimated Impact89
Family? (F = Feedback message, R = changed R code, M = changed R Module, P = changed Parameters, D = changed Data)
-       [Bootstrap Plot - Central Tendency] [WS7] [2014-11-13 07:39:21] [9c0bd235307a1b4a36b3290850d9d0d3] [Current]
Feedback Forum

Post a new message
Dataseries X:
137.058
150.284
137.196
141.061
10.844
141.185
105.199
147.937
149.525
140.505
152.958
154.604
131.642
132.941
155.452
131.148
135.677
156.347
15.255
135.707
151.126
13.423
14.37
13.322
152.027
15.838
148.633
130.317
13.702
13.629
154.676
122.572
148.719
150.242
137.439
151.455
103.677
141.104
15.099
150.437
155.532
134.215
158.968
129.218
14.433
133.613
151.836
146.669
133.354
145.968
15.091
131.935
113.862
133.919
137.247
133.654
140.817
152.838
150.745
131.957
10.362
145.128
145.201
128.779
135.198
150.516
125.707
144.686
134.389
135.645
132.805
125.785
144.336
153.637
149.214
120.568
139.845
123.674
136.251
150.264
148.847
154.919
142.835
142.074
14.05
139.392
142.578
127.065
103.949
135.372
128.959
141.659
132.393
138.862
150.082
128.121
148.616
149.669
149.673
152.477
129.194
151.278
14.384
130.418
113.411
149.893
129.637
128.444
902.436
138.307
13.19
152.494
120.604
140.395
156.558
129.885
137.162
15.066
137.036
124.838
135.583
14.878
160.066
146.174
148.025
162.131
154.535
148.408
135.249
146.709
104.175
153.552
124.668
14.245
136.949
926.364
132.865
118.263
141.266
136.983
146.816
137.486
147.065
14.308
145.162
145.508
13.399
147.271
114.081
141.093
126.446
155.109
144.525
114.997
115.297
128.959
132.291
148.408
15.733
119.513
124.794
918.271
132.498
11.705
120.372
895.814
141.939
12.864
127.685
120.378
105.535
144.003
141.526
112.452
13.48
154.845
123.553
114.879
146.947
132.936
143.521
148.094
149.649
15.201
139.734
117.913
137.834
14.313
125.014
101.828
12.949
152.811
127.218
126.585
132.162
142.659
118.602
135.739
112.497
139.456
122.927
138.784
142.141
127.024
146.208
139.261
146.928
127.868
130.115
145.092
118.139
147.441
123.462
139.661
123.691
134.155
151.329
144.546
100.558
137.855
140.984
138.859
12.312
149.782
987.723
143.667
140.296
13.917
951.227
135.005
139.842
120.859
151.652
127.592
15.126
12.991
112.447
130.765
146.154
137.035
149.208
108.506
117.585
124.091
137.327
107.802
128.992
891.141
101.952
116.417
129.737
119.239
143.171
139.529
119.638
128.688
110.686
11.595
128.088
147.867
139.112
137.258
992.786
140.466


Summary of computational transaction
Raw Inputview raw input (R code)
Raw Outputview raw output of R engine
Computing time6 seconds
R Server'Gwilym Jenkins' @ jenkins.wessa.net

\begin{tabular}{lllllllll}
\hline
Summary of computational transaction \tabularnewline
Raw Input & view raw input (R code)  \tabularnewline
Raw Output & view raw output of R engine  \tabularnewline
Computing time & 6 seconds \tabularnewline
R Server & 'Gwilym Jenkins' @ jenkins.wessa.net \tabularnewline
\hline
\end{tabular}
%Source: https://freestatistics.org/blog/index.php?pk=254085&T=0

[TABLE]
[ROW][C]Summary of computational transaction[/C][/ROW]
[ROW][C]Raw Input[/C][C]view raw input (R code) [/C][/ROW]
[ROW][C]Raw Output[/C][C]view raw output of R engine [/C][/ROW]
[ROW][C]Computing time[/C][C]6 seconds[/C][/ROW]
[ROW][C]R Server[/C][C]'Gwilym Jenkins' @ jenkins.wessa.net[/C][/ROW]
[/TABLE]
Source: https://freestatistics.org/blog/index.php?pk=254085&T=0

Globally Unique Identifier (entire table): ba.freestatistics.org/blog/index.php?pk=254085&T=0

As an alternative you can also use a QR Code:  

The GUIDs for individual cells are displayed in the table below:

Summary of computational transaction
Raw Inputview raw input (R code)
Raw Outputview raw output of R engine
Computing time6 seconds
R Server'Gwilym Jenkins' @ jenkins.wessa.net


Estimation Results of Bootstrap
statisticP1P5Q1EstimateQ3P95P99S.D.IQR
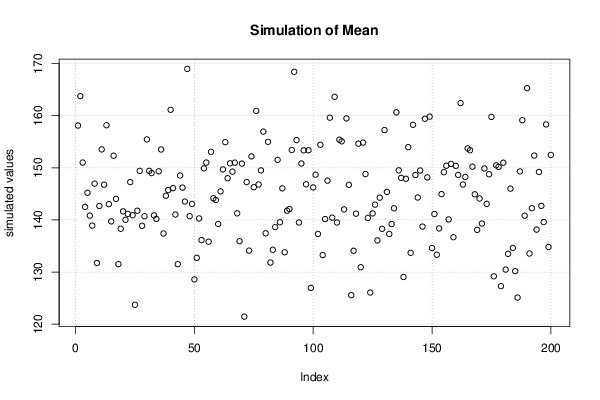
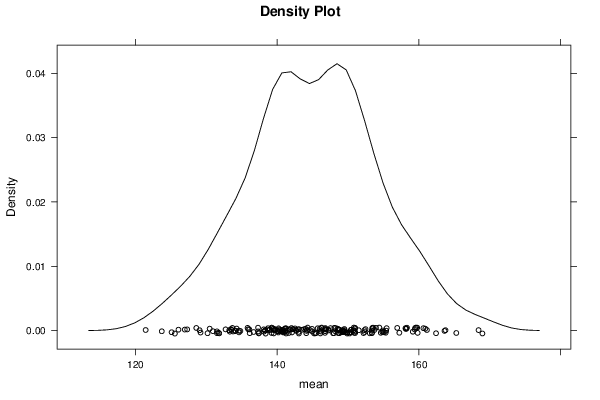
mean125.1130.13139.29145.53150.8159.76165.39.088711.517
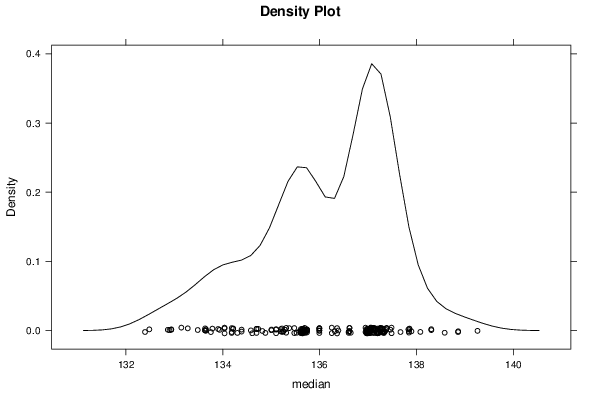
median132.86133.63135.31136137.13137.85138.861.37051.8215
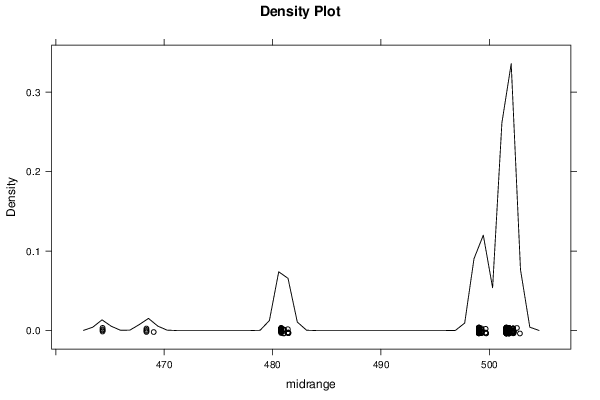
midrange464.32480.79499.04501.57501.57502.19502.259.62572.5315
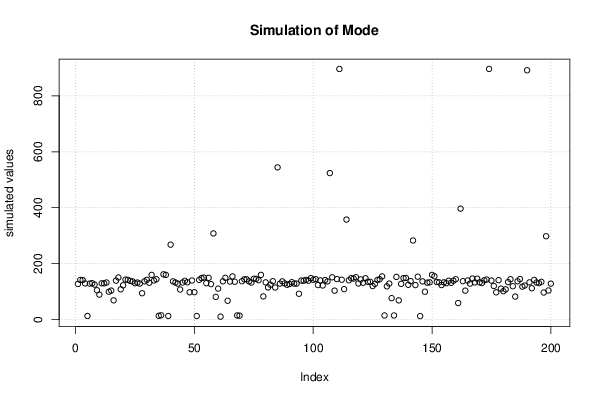
mode13.18715.706122.75138.68142.9268.69891.19111.4820.141
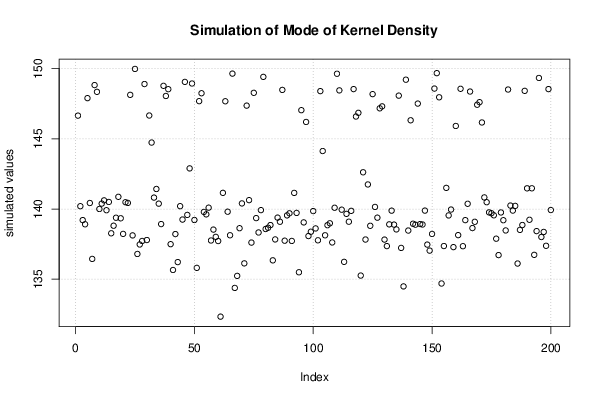
mode k.dens134.49136.13138.23138.75144.28148.83149.644.29896.0538

\begin{tabular}{lllllllll}
\hline
Estimation Results of Bootstrap \tabularnewline
statistic & P1 & P5 & Q1 & Estimate & Q3 & P95 & P99 & S.D. & IQR \tabularnewline
mean & 125.1 & 130.13 & 139.29 & 145.53 & 150.8 & 159.76 & 165.3 & 9.0887 & 11.517 \tabularnewline
median & 132.86 & 133.63 & 135.31 & 136 & 137.13 & 137.85 & 138.86 & 1.3705 & 1.8215 \tabularnewline
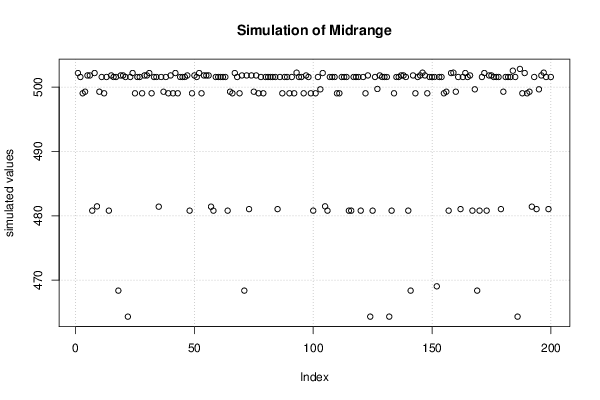
midrange & 464.32 & 480.79 & 499.04 & 501.57 & 501.57 & 502.19 & 502.25 & 9.6257 & 2.5315 \tabularnewline
mode & 13.187 & 15.706 & 122.75 & 138.68 & 142.9 & 268.69 & 891.19 & 111.48 & 20.141 \tabularnewline
mode k.dens & 134.49 & 136.13 & 138.23 & 138.75 & 144.28 & 148.83 & 149.64 & 4.2989 & 6.0538 \tabularnewline
\hline
\end{tabular}
%Source: https://freestatistics.org/blog/index.php?pk=254085&T=1

[TABLE]
[ROW][C]Estimation Results of Bootstrap[/C][/ROW]
[ROW][C]statistic[/C][C]P1[/C][C]P5[/C][C]Q1[/C][C]Estimate[/C][C]Q3[/C][C]P95[/C][C]P99[/C][C]S.D.[/C][C]IQR[/C][/ROW]
[ROW][C]mean[/C][C]125.1[/C][C]130.13[/C][C]139.29[/C][C]145.53[/C][C]150.8[/C][C]159.76[/C][C]165.3[/C][C]9.0887[/C][C]11.517[/C][/ROW]
[ROW][C]median[/C][C]132.86[/C][C]133.63[/C][C]135.31[/C][C]136[/C][C]137.13[/C][C]137.85[/C][C]138.86[/C][C]1.3705[/C][C]1.8215[/C][/ROW]
[ROW][C]midrange[/C][C]464.32[/C][C]480.79[/C][C]499.04[/C][C]501.57[/C][C]501.57[/C][C]502.19[/C][C]502.25[/C][C]9.6257[/C][C]2.5315[/C][/ROW]
[ROW][C]mode[/C][C]13.187[/C][C]15.706[/C][C]122.75[/C][C]138.68[/C][C]142.9[/C][C]268.69[/C][C]891.19[/C][C]111.48[/C][C]20.141[/C][/ROW]
[ROW][C]mode k.dens[/C][C]134.49[/C][C]136.13[/C][C]138.23[/C][C]138.75[/C][C]144.28[/C][C]148.83[/C][C]149.64[/C][C]4.2989[/C][C]6.0538[/C][/ROW]
[/TABLE]
Source: https://freestatistics.org/blog/index.php?pk=254085&T=1

Globally Unique Identifier (entire table): ba.freestatistics.org/blog/index.php?pk=254085&T=1

As an alternative you can also use a QR Code:  

The GUIDs for individual cells are displayed in the table below:

Estimation Results of Bootstrap
statisticP1P5Q1EstimateQ3P95P99S.D.IQR
mean125.1130.13139.29145.53150.8159.76165.39.088711.517
median132.86133.63135.31136137.13137.85138.861.37051.8215
midrange464.32480.79499.04501.57501.57502.19502.259.62572.5315
mode13.18715.706122.75138.68142.9268.69891.19111.4820.141
mode k.dens134.49136.13138.23138.75144.28148.83149.644.29896.0538


Parameters (Session):
par1 = 200 ; par2 = 5 ; par3 = 0 ; par4 = P1 P5 Q1 Q3 P95 P99 ;
Parameters (R input):
par1 = 200 ; par2 = 5 ; par3 = 0 ; par4 = P1 P5 Q1 Q3 P95 P99 ;
R code (references can be found in the software module):
par1 <- as.numeric(par1)
par2 <- as.numeric(par2)
if (par3 == '0') bw <- NULL
if (par3 != '0') bw <- as.numeric(par3)
if (par1 < 10) par1 = 10
if (par1 > 5000) par1 = 5000
library(modeest)
library(lattice)
library(boot)
boot.stat <- function(s,i)
{
s.mean <- mean(s[i])
s.median <- median(s[i])
s.midrange <- (max(s[i]) + min(s[i])) / 2
s.mode <- mlv(s[i], method='mfv')$M
s.kernelmode <- mlv(s[i], method='kernel', bw=bw)$M
c(s.mean, s.median, s.midrange, s.mode, s.kernelmode)
}
(r <- boot(x,boot.stat, R=par1, stype='i'))
bitmap(file='plot1.png')
plot(r$t[,1],type='p',ylab='simulated values',main='Simulation of Mean')
grid()
dev.off()
bitmap(file='plot2.png')
plot(r$t[,2],type='p',ylab='simulated values',main='Simulation of Median')
grid()
dev.off()
bitmap(file='plot3.png')
plot(r$t[,3],type='p',ylab='simulated values',main='Simulation of Midrange')
grid()
dev.off()
bitmap(file='plot7.png')
plot(r$t[,4],type='p',ylab='simulated values',main='Simulation of Mode')
grid()
dev.off()
bitmap(file='plot8.png')
plot(r$t[,5],type='p',ylab='simulated values',main='Simulation of Mode of Kernel Density')
grid()
dev.off()
bitmap(file='plot4.png')
densityplot(~r$t[,1],col='black',main='Density Plot',xlab='mean')
dev.off()
bitmap(file='plot5.png')
densityplot(~r$t[,2],col='black',main='Density Plot',xlab='median')
dev.off()
bitmap(file='plot6.png')
densityplot(~r$t[,3],col='black',main='Density Plot',xlab='midrange')
dev.off()
bitmap(file='plot9.png')
densityplot(~r$t[,4],col='black',main='Density Plot',xlab='mode')
dev.off()
bitmap(file='plot10.png')
densityplot(~r$t[,5],col='black',main='Density Plot',xlab='mode of kernel dens.')
dev.off()
z <- data.frame(cbind(r$t[,1],r$t[,2],r$t[,3],r$t[,4],r$t[,5]))
colnames(z) <- list('mean','median','midrange','mode','mode k.dens')
bitmap(file='plot11.png')
boxplot(z,notch=TRUE,ylab='simulated values',main='Bootstrap Simulation - Central Tendency')
grid()
dev.off()
load(file='createtable')
a<-table.start()
a<-table.row.start(a)
a<-table.element(a,'Estimation Results of Bootstrap',10,TRUE)
a<-table.row.end(a)
if (par4 == 'P1 P5 Q1 Q3 P95 P99') {
myq.1 <- 0.01
myq.2 <- 0.05
myq.3 <- 0.95
myq.4 <- 0.99
myl.1 <- 'P1'
myl.2 <- 'P5'
myl.3 <- 'P95'
myl.4 <- 'P99'
}
if (par4 == 'P0.5 P2.5 Q1 Q3 P97.5 P99.5') {
myq.1 <- 0.005
myq.2 <- 0.025
myq.3 <- 0.975
myq.4 <- 0.995
myl.1 <- 'P0.5'
myl.2 <- 'P2.5'
myl.3 <- 'P97.5'
myl.4 <- 'P99.5'
}
if (par4 == 'P10 P20 Q1 Q3 P80 P90') {
myq.1 <- 0.10
myq.2 <- 0.20
myq.3 <- 0.80
myq.4 <- 0.90
myl.1 <- 'P10'
myl.2 <- 'P20'
myl.3 <- 'P80'
myl.4 <- 'P90'
}
a<-table.row.start(a)
a<-table.element(a,'statistic',header=TRUE)
a<-table.element(a,myl.1,header=TRUE)
a<-table.element(a,myl.2,header=TRUE)
a<-table.element(a,'Q1',header=TRUE)
a<-table.element(a,'Estimate',header=TRUE)
a<-table.element(a,'Q3',header=TRUE)
a<-table.element(a,myl.3,header=TRUE)
a<-table.element(a,myl.4,header=TRUE)
a<-table.element(a,'S.D.',header=TRUE)
a<-table.element(a,'IQR',header=TRUE)
a<-table.row.end(a)
a<-table.row.start(a)
a<-table.element(a,'mean',header=TRUE)
q1 <- quantile(r$t[,1],0.25)[[1]]
q3 <- quantile(r$t[,1],0.75)[[1]]
p01 <- quantile(r$t[,1],myq.1)[[1]]
p05 <- quantile(r$t[,1],myq.2)[[1]]
p95 <- quantile(r$t[,1],myq.3)[[1]]
p99 <- quantile(r$t[,1],myq.4)[[1]]
a<-table.element(a,signif(p01,par2))
a<-table.element(a,signif(p05,par2))
a<-table.element(a,signif(q1,par2))
a<-table.element(a,signif(r$t0[1],par2))
a<-table.element(a,signif(q3,par2))
a<-table.element(a,signif(p95,par2))
a<-table.element(a,signif(p99,par2))
a<-table.element( a,signif( sqrt(var(r$t[,1])),par2 ) )
a<-table.element(a,signif(q3-q1,par2))
a<-table.row.end(a)
a<-table.row.start(a)
a<-table.element(a,'median',header=TRUE)
q1 <- quantile(r$t[,2],0.25)[[1]]
q3 <- quantile(r$t[,2],0.75)[[1]]
p01 <- quantile(r$t[,2],myq.1)[[1]]
p05 <- quantile(r$t[,2],myq.2)[[1]]
p95 <- quantile(r$t[,2],myq.3)[[1]]
p99 <- quantile(r$t[,2],myq.4)[[1]]
a<-table.element(a,signif(p01,par2))
a<-table.element(a,signif(p05,par2))
a<-table.element(a,signif(q1,par2))
a<-table.element(a,signif(r$t0[2],par2))
a<-table.element(a,signif(q3,par2))
a<-table.element(a,signif(p95,par2))
a<-table.element(a,signif(p99,par2))
a<-table.element(a,signif(sqrt(var(r$t[,2])),par2))
a<-table.element(a,signif(q3-q1,par2))
a<-table.row.end(a)
a<-table.row.start(a)
a<-table.element(a,'midrange',header=TRUE)
q1 <- quantile(r$t[,3],0.25)[[1]]
q3 <- quantile(r$t[,3],0.75)[[1]]
p01 <- quantile(r$t[,3],myq.1)[[1]]
p05 <- quantile(r$t[,3],myq.2)[[1]]
p95 <- quantile(r$t[,3],myq.3)[[1]]
p99 <- quantile(r$t[,3],myq.4)[[1]]
a<-table.element(a,signif(p01,par2))
a<-table.element(a,signif(p05,par2))
a<-table.element(a,signif(q1,par2))
a<-table.element(a,signif(r$t0[3],par2))
a<-table.element(a,signif(q3,par2))
a<-table.element(a,signif(p95,par2))
a<-table.element(a,signif(p99,par2))
a<-table.element(a,signif(sqrt(var(r$t[,3])),par2))
a<-table.element(a,signif(q3-q1,par2))
a<-table.row.end(a)
a<-table.row.start(a)
a<-table.element(a,'mode',header=TRUE)
q1 <- quantile(r$t[,4],0.25)[[1]]
q3 <- quantile(r$t[,4],0.75)[[1]]
p01 <- quantile(r$t[,4],myq.1)[[1]]
p05 <- quantile(r$t[,4],myq.2)[[1]]
p95 <- quantile(r$t[,4],myq.3)[[1]]
p99 <- quantile(r$t[,4],myq.4)[[1]]
a<-table.element(a,signif(p01,par2))
a<-table.element(a,signif(p05,par2))
a<-table.element(a,signif(q1,par2))
a<-table.element(a,signif(r$t0[4],par2))
a<-table.element(a,signif(q3,par2))
a<-table.element(a,signif(p95,par2))
a<-table.element(a,signif(p99,par2))
a<-table.element(a,signif(sqrt(var(r$t[,4])),par2))
a<-table.element(a,signif(q3-q1,par2))
a<-table.row.end(a)
a<-table.row.start(a)
a<-table.element(a,'mode k.dens',header=TRUE)
q1 <- quantile(r$t[,5],0.25)[[1]]
q3 <- quantile(r$t[,5],0.75)[[1]]
p01 <- quantile(r$t[,5],myq.1)[[1]]
p05 <- quantile(r$t[,5],myq.2)[[1]]
p95 <- quantile(r$t[,5],myq.3)[[1]]
p99 <- quantile(r$t[,5],myq.4)[[1]]
a<-table.element(a,signif(p01,par2))
a<-table.element(a,signif(p05,par2))
a<-table.element(a,signif(q1,par2))
a<-table.element(a,signif(r$t0[5],par2))
a<-table.element(a,signif(q3,par2))
a<-table.element(a,signif(p95,par2))
a<-table.element(a,signif(p99,par2))
a<-table.element(a,signif(sqrt(var(r$t[,5])),par2))
a<-table.element(a,signif(q3-q1,par2))
a<-table.row.end(a)
a<-table.end(a)
table.save(a,file='mytable.tab')