Free Statistics

of Irreproducible Research!

Author's title

Author*The author of this computation has been verified*
R Software Modulerwasp_bootstrapplot1.wasp
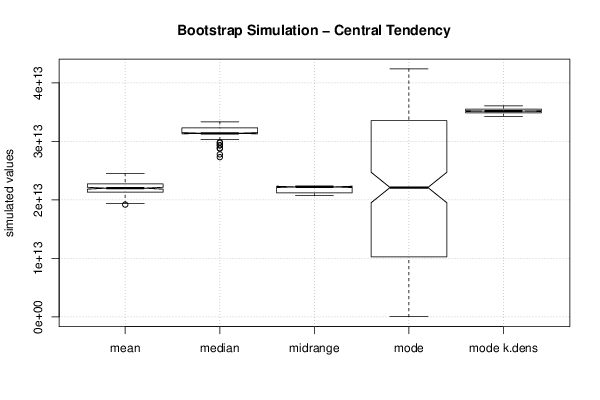
Title produced by softwareBootstrap Plot - Central Tendency
Date of computationWed, 12 Nov 2014 18:27:59 +0000
Cite this page as followsStatistical Computations at FreeStatistics.org, Office for Research Development and Education, URL https://freestatistics.org/blog/index.php?v=date/2014/Nov/12/t1415816948vgbvnbp2h673qaz.htm/, Retrieved Sun, 19 May 2024 12:58:13 +0000
Statistical Computations at FreeStatistics.org, Office for Research Development and Education, URL https://freestatistics.org/blog/index.php?pk=254013, Retrieved Sun, 19 May 2024 12:58:13 +0000
QR Codes:

Original text written by user:
IsPrivate?No (this computation is public)
User-defined keywords
Estimated Impact82
Family? (F = Feedback message, R = changed R code, M = changed R Module, P = changed Parameters, D = changed Data)
-     [Multiple Regression] [WS 7 Depression] [2014-11-12 17:27:06] [837635e05a8b7d15572545de61d5b5ed]
- RMPD    [Bootstrap Plot - Central Tendency] [WS 7 Mean] [2014-11-12 18:27:59] [cf0ec5d34597f312b7dfbfe84499cd1d] [Current]
Feedback Forum

Post a new message
Dataseries X:
41381312141253
39321611181183
30351915111466
3133156121267
34371413162176
35291310181278
39311912142253
34361514141180
36351412151074
3738159151376
38311610171079
3634161219854
38351612101567
39381611161454
33371715181087
32331512141458
36321510141475
38382012171188
39381811141064
32321612161357
32331611189.566
31311612111468
39381913141254
37391611121456
39321712171186
413217139980
36351610161176
33371514141569
33331612151478
34331410111367
3131151216980
2732128131554
37311410171071
34371612151184
34301412141374
323310716871
293110992063
36331412151271
29311610171076
35331610131069
3732161015974
34331412161475
3832201516854
35331410121452
38281410151169
37351112111368
3839141315965
33341511151175
36381611171574
38321412131175
32381614161072
32301410141467
32331212111863
34381613121462
323295121163
37351461514.576
39341612161374
2934161215967
37361511121073
35341610121570
302812782053
38341612131277
34351614111280
31351411141452
34311612151354
35371713101180
36351814111766
30271811121273
39401212151363
35371612151469
3836108141367
31381411161554
34391814151381
38411814151069
34271612131184
3930179121980
37371613171370
34311611131769
28311312151377
3727161213954
33361612151179
3537161215971
37331512161273
32341511151272
33311610141377
3839149151375
33341612141269
29321612131554
3333151272270
3136129171373
36321715131554
35411612151377
32281512141582
293013121312.580
39361610161180
37351613121669
3531169141178
37341612171181
32361410151076
38361614171076
37351611121673
36372015161285
32281511111166
33391611151679
4032131291968
38351712161176
41391612151671
36351611101554
4342127102446
30341612151485
31331614111574
32411711131188
32331311141538
37341210181276
37321813161086
33401413141454
3440148141367
3335131114969
38361612141590
33371311121554
31271613141476
38391312151189
3738161415876
36311513151173
31331615131179
3932151017890
44391711171074
3336159191181
35331211151372
32331610131171
2832101192066
4037168151077
27301211151565
37381412151274
32291512161485
2822139112354
34351511141463
30351110111654
3534128151164
3135119131269
3234168151054
3037159161484
30351715141286
31231611151277
4031108161189
32271813161276
36361312111360
32311612121175
353213991973
3839107161285
42371513131779
343816916971
3539166121272
383414891969
3331108131878
36321715131554
3237136141469
3336159191181
3432161113984
3238128121884
3436138131669
27261310102466
3126128141481
38331714162082
34391510101872
2430108112354
30331411141278
26251112121474
3438131291682
2737161291873
3731125112055
36371612161272
4135121091278
292597131759
36281212161372
3235151113978
373312891668
3030129121869
31311410161067
3837129111474
36361612141154
353011613967
31361915151170
38321512141080
2228812161189
32361612131976
36341711141474
3931127151287
2828117131454
3236115112161
32361412111338
38401612141075
3233123151569
35371611111662
32321310151472
37381512121270
3431169141979
33371612141587
333314981962
26321612131377
3030161291769
24301410151269
3431119171175
34321212131454
3334158151172
34361511151374
35371611141285
35361612161552
36331110131470
34331510161284
3433121291764
41441212161184
32391511111887
3032158101379
35351612111767
28251410151365
33351711171185
39341410141283
363513882261
36391512151482
35331312111276
38361410161258
33321512101772
313212915972
343613992138
323686161078
31321410191154
3334149121263
343311982366
3435129111370
3430136141271
3338101091667
323416615958
41331814131772
3432131016972
36311110111470
373046121776
36271312131350
29311612101172
3730107111272
2732128121088
3535121181953
2828103121658
3533136121666
37311510151482
2935128112069
3235149131568
3632109142344
1921128102056
2120129121653
3134117151470
3332107131778
3634126131171
3332169131372
37331210121768
34331411121567
3537161292175
313214891862
37341311151567
35304310883
27301511141264
34381112151268
403611772262
2932149141272


Summary of computational transaction
Raw Inputview raw input (R code)
Raw Outputview raw output of R engine
Computing time7 seconds
R Server'George Udny Yule' @ yule.wessa.net

\begin{tabular}{lllllllll}
\hline
Summary of computational transaction \tabularnewline
Raw Input & view raw input (R code)  \tabularnewline
Raw Output & view raw output of R engine  \tabularnewline
Computing time & 7 seconds \tabularnewline
R Server & 'George Udny Yule' @ yule.wessa.net \tabularnewline
\hline
\end{tabular}
%Source: https://freestatistics.org/blog/index.php?pk=254013&T=0

[TABLE]
[ROW][C]Summary of computational transaction[/C][/ROW]
[ROW][C]Raw Input[/C][C]view raw input (R code) [/C][/ROW]
[ROW][C]Raw Output[/C][C]view raw output of R engine [/C][/ROW]
[ROW][C]Computing time[/C][C]7 seconds[/C][/ROW]
[ROW][C]R Server[/C][C]'George Udny Yule' @ yule.wessa.net[/C][/ROW]
[/TABLE]
Source: https://freestatistics.org/blog/index.php?pk=254013&T=0

Globally Unique Identifier (entire table): ba.freestatistics.org/blog/index.php?pk=254013&T=0

As an alternative you can also use a QR Code:  

The GUIDs for individual cells are displayed in the table below:

Summary of computational transaction
Raw Inputview raw input (R code)
Raw Outputview raw output of R engine
Computing time7 seconds
R Server'George Udny Yule' @ yule.wessa.net


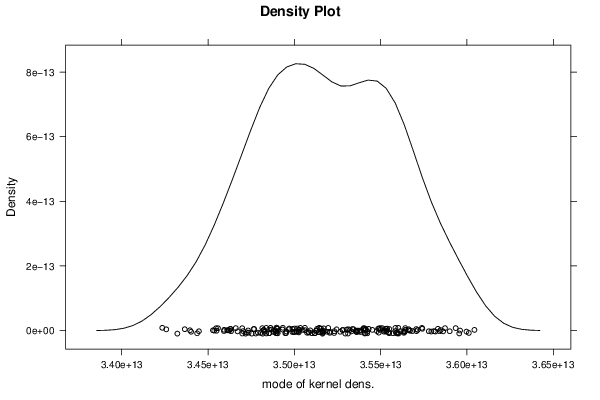
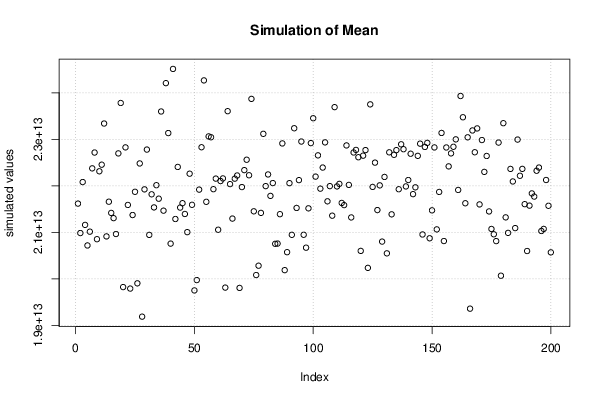
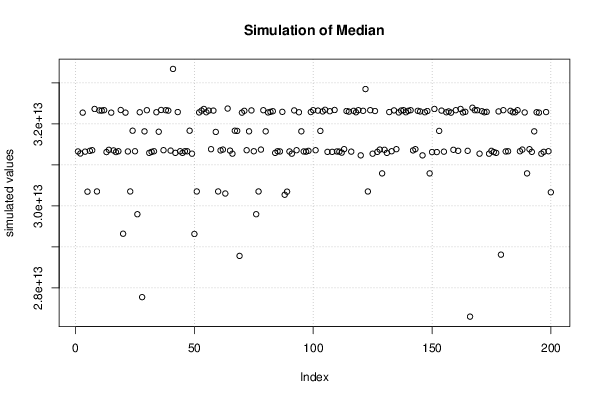
Estimation Results of Bootstrap
statisticP1P5Q1EstimateQ3P95P99S.D.IQR
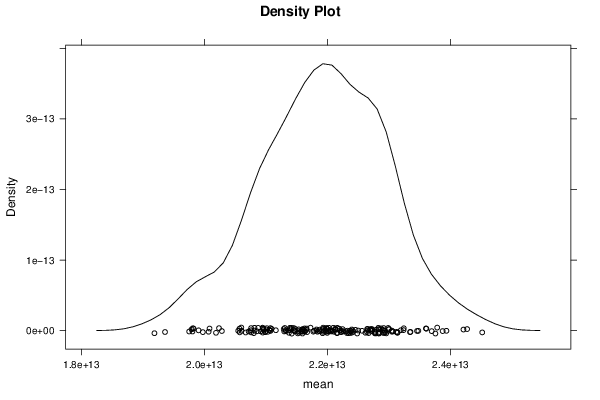
mean1.9749e+132.0083e+132.1318e+132.1907e+132.2704e+132.3482e+132.421e+131.0024e+121.3859e+12
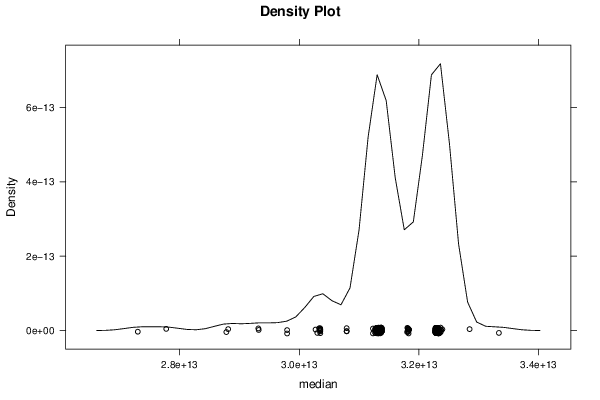
median2.8771e+133.033e+133.132e+133.1372e+133.2303e+133.2337e+133.2396e+138.3488e+119.8261e+11
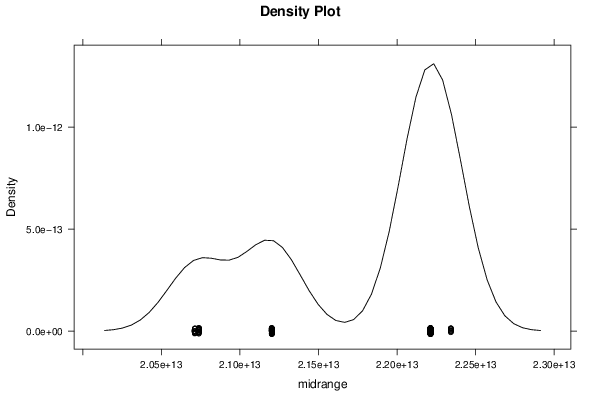
midrange2.0712e+132.0736e+132.1202e+132.2212e+132.2212e+132.2215e+132.2342e+136.0926e+111.0101e+12
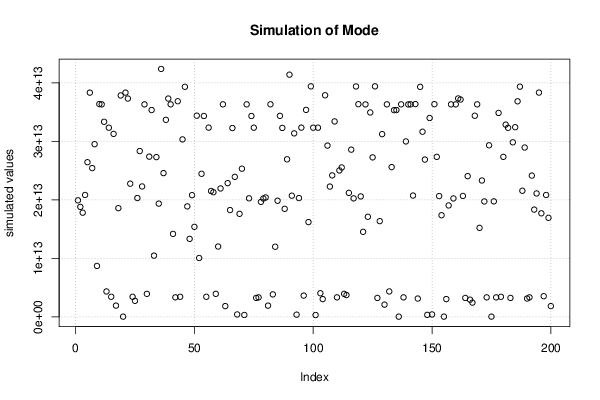
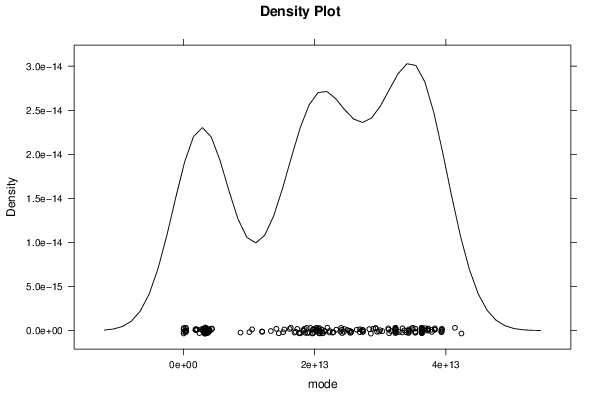
mode3.7331e+101.7686e+121.0363e+131.9829e+133.3469e+133.8321e+133.9421e+131.2884e+132.3106e+13
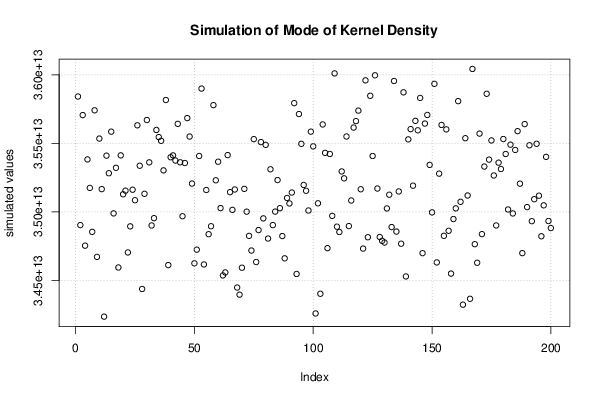
mode k.dens3.4322e+133.4546e+133.4887e+133.5338e+133.5512e+133.5842e+133.5997e+134.0563e+116.2459e+11

\begin{tabular}{lllllllll}
\hline
Estimation Results of Bootstrap \tabularnewline
statistic & P1 & P5 & Q1 & Estimate & Q3 & P95 & P99 & S.D. & IQR \tabularnewline
mean & 1.9749e+13 & 2.0083e+13 & 2.1318e+13 & 2.1907e+13 & 2.2704e+13 & 2.3482e+13 & 2.421e+13 & 1.0024e+12 & 1.3859e+12 \tabularnewline
median & 2.8771e+13 & 3.033e+13 & 3.132e+13 & 3.1372e+13 & 3.2303e+13 & 3.2337e+13 & 3.2396e+13 & 8.3488e+11 & 9.8261e+11 \tabularnewline
midrange & 2.0712e+13 & 2.0736e+13 & 2.1202e+13 & 2.2212e+13 & 2.2212e+13 & 2.2215e+13 & 2.2342e+13 & 6.0926e+11 & 1.0101e+12 \tabularnewline
mode & 3.7331e+10 & 1.7686e+12 & 1.0363e+13 & 1.9829e+13 & 3.3469e+13 & 3.8321e+13 & 3.9421e+13 & 1.2884e+13 & 2.3106e+13 \tabularnewline
mode k.dens & 3.4322e+13 & 3.4546e+13 & 3.4887e+13 & 3.5338e+13 & 3.5512e+13 & 3.5842e+13 & 3.5997e+13 & 4.0563e+11 & 6.2459e+11 \tabularnewline
\hline
\end{tabular}
%Source: https://freestatistics.org/blog/index.php?pk=254013&T=1

[TABLE]
[ROW][C]Estimation Results of Bootstrap[/C][/ROW]
[ROW][C]statistic[/C][C]P1[/C][C]P5[/C][C]Q1[/C][C]Estimate[/C][C]Q3[/C][C]P95[/C][C]P99[/C][C]S.D.[/C][C]IQR[/C][/ROW]
[ROW][C]mean[/C][C]1.9749e+13[/C][C]2.0083e+13[/C][C]2.1318e+13[/C][C]2.1907e+13[/C][C]2.2704e+13[/C][C]2.3482e+13[/C][C]2.421e+13[/C][C]1.0024e+12[/C][C]1.3859e+12[/C][/ROW]
[ROW][C]median[/C][C]2.8771e+13[/C][C]3.033e+13[/C][C]3.132e+13[/C][C]3.1372e+13[/C][C]3.2303e+13[/C][C]3.2337e+13[/C][C]3.2396e+13[/C][C]8.3488e+11[/C][C]9.8261e+11[/C][/ROW]
[ROW][C]midrange[/C][C]2.0712e+13[/C][C]2.0736e+13[/C][C]2.1202e+13[/C][C]2.2212e+13[/C][C]2.2212e+13[/C][C]2.2215e+13[/C][C]2.2342e+13[/C][C]6.0926e+11[/C][C]1.0101e+12[/C][/ROW]
[ROW][C]mode[/C][C]3.7331e+10[/C][C]1.7686e+12[/C][C]1.0363e+13[/C][C]1.9829e+13[/C][C]3.3469e+13[/C][C]3.8321e+13[/C][C]3.9421e+13[/C][C]1.2884e+13[/C][C]2.3106e+13[/C][/ROW]
[ROW][C]mode k.dens[/C][C]3.4322e+13[/C][C]3.4546e+13[/C][C]3.4887e+13[/C][C]3.5338e+13[/C][C]3.5512e+13[/C][C]3.5842e+13[/C][C]3.5997e+13[/C][C]4.0563e+11[/C][C]6.2459e+11[/C][/ROW]
[/TABLE]
Source: https://freestatistics.org/blog/index.php?pk=254013&T=1

Globally Unique Identifier (entire table): ba.freestatistics.org/blog/index.php?pk=254013&T=1

As an alternative you can also use a QR Code:  

The GUIDs for individual cells are displayed in the table below:

Estimation Results of Bootstrap
statisticP1P5Q1EstimateQ3P95P99S.D.IQR
mean1.9749e+132.0083e+132.1318e+132.1907e+132.2704e+132.3482e+132.421e+131.0024e+121.3859e+12
median2.8771e+133.033e+133.132e+133.1372e+133.2303e+133.2337e+133.2396e+138.3488e+119.8261e+11
midrange2.0712e+132.0736e+132.1202e+132.2212e+132.2212e+132.2215e+132.2342e+136.0926e+111.0101e+12
mode3.7331e+101.7686e+121.0363e+131.9829e+133.3469e+133.8321e+133.9421e+131.2884e+132.3106e+13
mode k.dens3.4322e+133.4546e+133.4887e+133.5338e+133.5512e+133.5842e+133.5997e+134.0563e+116.2459e+11


Parameters (Session):
par1 = 200 ; par2 = 5 ; par3 = 0 ; par4 = P1 P5 Q1 Q3 P95 P99 ;
Parameters (R input):
par1 = 200 ; par2 = 5 ; par3 = 0 ; par4 = P1 P5 Q1 Q3 P95 P99 ;
R code (references can be found in the software module):
par1 <- as.numeric(par1)
par2 <- as.numeric(par2)
if (par3 == '0') bw <- NULL
if (par3 != '0') bw <- as.numeric(par3)
if (par1 < 10) par1 = 10
if (par1 > 5000) par1 = 5000
library(modeest)
library(lattice)
library(boot)
boot.stat <- function(s,i)
{
s.mean <- mean(s[i])
s.median <- median(s[i])
s.midrange <- (max(s[i]) + min(s[i])) / 2
s.mode <- mlv(s[i], method='mfv')$M
s.kernelmode <- mlv(s[i], method='kernel', bw=bw)$M
c(s.mean, s.median, s.midrange, s.mode, s.kernelmode)
}
(r <- boot(x,boot.stat, R=par1, stype='i'))
bitmap(file='plot1.png')
plot(r$t[,1],type='p',ylab='simulated values',main='Simulation of Mean')
grid()
dev.off()
bitmap(file='plot2.png')
plot(r$t[,2],type='p',ylab='simulated values',main='Simulation of Median')
grid()
dev.off()
bitmap(file='plot3.png')
plot(r$t[,3],type='p',ylab='simulated values',main='Simulation of Midrange')
grid()
dev.off()
bitmap(file='plot7.png')
plot(r$t[,4],type='p',ylab='simulated values',main='Simulation of Mode')
grid()
dev.off()
bitmap(file='plot8.png')
plot(r$t[,5],type='p',ylab='simulated values',main='Simulation of Mode of Kernel Density')
grid()
dev.off()
bitmap(file='plot4.png')
densityplot(~r$t[,1],col='black',main='Density Plot',xlab='mean')
dev.off()
bitmap(file='plot5.png')
densityplot(~r$t[,2],col='black',main='Density Plot',xlab='median')
dev.off()
bitmap(file='plot6.png')
densityplot(~r$t[,3],col='black',main='Density Plot',xlab='midrange')
dev.off()
bitmap(file='plot9.png')
densityplot(~r$t[,4],col='black',main='Density Plot',xlab='mode')
dev.off()
bitmap(file='plot10.png')
densityplot(~r$t[,5],col='black',main='Density Plot',xlab='mode of kernel dens.')
dev.off()
z <- data.frame(cbind(r$t[,1],r$t[,2],r$t[,3],r$t[,4],r$t[,5]))
colnames(z) <- list('mean','median','midrange','mode','mode k.dens')
bitmap(file='plot11.png')
boxplot(z,notch=TRUE,ylab='simulated values',main='Bootstrap Simulation - Central Tendency')
grid()
dev.off()
load(file='createtable')
a<-table.start()
a<-table.row.start(a)
a<-table.element(a,'Estimation Results of Bootstrap',10,TRUE)
a<-table.row.end(a)
if (par4 == 'P1 P5 Q1 Q3 P95 P99') {
myq.1 <- 0.01
myq.2 <- 0.05
myq.3 <- 0.95
myq.4 <- 0.99
myl.1 <- 'P1'
myl.2 <- 'P5'
myl.3 <- 'P95'
myl.4 <- 'P99'
}
if (par4 == 'P0.5 P2.5 Q1 Q3 P97.5 P99.5') {
myq.1 <- 0.005
myq.2 <- 0.025
myq.3 <- 0.975
myq.4 <- 0.995
myl.1 <- 'P0.5'
myl.2 <- 'P2.5'
myl.3 <- 'P97.5'
myl.4 <- 'P99.5'
}
if (par4 == 'P10 P20 Q1 Q3 P80 P90') {
myq.1 <- 0.10
myq.2 <- 0.20
myq.3 <- 0.80
myq.4 <- 0.90
myl.1 <- 'P10'
myl.2 <- 'P20'
myl.3 <- 'P80'
myl.4 <- 'P90'
}
a<-table.row.start(a)
a<-table.element(a,'statistic',header=TRUE)
a<-table.element(a,myl.1,header=TRUE)
a<-table.element(a,myl.2,header=TRUE)
a<-table.element(a,'Q1',header=TRUE)
a<-table.element(a,'Estimate',header=TRUE)
a<-table.element(a,'Q3',header=TRUE)
a<-table.element(a,myl.3,header=TRUE)
a<-table.element(a,myl.4,header=TRUE)
a<-table.element(a,'S.D.',header=TRUE)
a<-table.element(a,'IQR',header=TRUE)
a<-table.row.end(a)
a<-table.row.start(a)
a<-table.element(a,'mean',header=TRUE)
q1 <- quantile(r$t[,1],0.25)[[1]]
q3 <- quantile(r$t[,1],0.75)[[1]]
p01 <- quantile(r$t[,1],myq.1)[[1]]
p05 <- quantile(r$t[,1],myq.2)[[1]]
p95 <- quantile(r$t[,1],myq.3)[[1]]
p99 <- quantile(r$t[,1],myq.4)[[1]]
a<-table.element(a,signif(p01,par2))
a<-table.element(a,signif(p05,par2))
a<-table.element(a,signif(q1,par2))
a<-table.element(a,signif(r$t0[1],par2))
a<-table.element(a,signif(q3,par2))
a<-table.element(a,signif(p95,par2))
a<-table.element(a,signif(p99,par2))
a<-table.element( a,signif( sqrt(var(r$t[,1])),par2 ) )
a<-table.element(a,signif(q3-q1,par2))
a<-table.row.end(a)
a<-table.row.start(a)
a<-table.element(a,'median',header=TRUE)
q1 <- quantile(r$t[,2],0.25)[[1]]
q3 <- quantile(r$t[,2],0.75)[[1]]
p01 <- quantile(r$t[,2],myq.1)[[1]]
p05 <- quantile(r$t[,2],myq.2)[[1]]
p95 <- quantile(r$t[,2],myq.3)[[1]]
p99 <- quantile(r$t[,2],myq.4)[[1]]
a<-table.element(a,signif(p01,par2))
a<-table.element(a,signif(p05,par2))
a<-table.element(a,signif(q1,par2))
a<-table.element(a,signif(r$t0[2],par2))
a<-table.element(a,signif(q3,par2))
a<-table.element(a,signif(p95,par2))
a<-table.element(a,signif(p99,par2))
a<-table.element(a,signif(sqrt(var(r$t[,2])),par2))
a<-table.element(a,signif(q3-q1,par2))
a<-table.row.end(a)
a<-table.row.start(a)
a<-table.element(a,'midrange',header=TRUE)
q1 <- quantile(r$t[,3],0.25)[[1]]
q3 <- quantile(r$t[,3],0.75)[[1]]
p01 <- quantile(r$t[,3],myq.1)[[1]]
p05 <- quantile(r$t[,3],myq.2)[[1]]
p95 <- quantile(r$t[,3],myq.3)[[1]]
p99 <- quantile(r$t[,3],myq.4)[[1]]
a<-table.element(a,signif(p01,par2))
a<-table.element(a,signif(p05,par2))
a<-table.element(a,signif(q1,par2))
a<-table.element(a,signif(r$t0[3],par2))
a<-table.element(a,signif(q3,par2))
a<-table.element(a,signif(p95,par2))
a<-table.element(a,signif(p99,par2))
a<-table.element(a,signif(sqrt(var(r$t[,3])),par2))
a<-table.element(a,signif(q3-q1,par2))
a<-table.row.end(a)
a<-table.row.start(a)
a<-table.element(a,'mode',header=TRUE)
q1 <- quantile(r$t[,4],0.25)[[1]]
q3 <- quantile(r$t[,4],0.75)[[1]]
p01 <- quantile(r$t[,4],myq.1)[[1]]
p05 <- quantile(r$t[,4],myq.2)[[1]]
p95 <- quantile(r$t[,4],myq.3)[[1]]
p99 <- quantile(r$t[,4],myq.4)[[1]]
a<-table.element(a,signif(p01,par2))
a<-table.element(a,signif(p05,par2))
a<-table.element(a,signif(q1,par2))
a<-table.element(a,signif(r$t0[4],par2))
a<-table.element(a,signif(q3,par2))
a<-table.element(a,signif(p95,par2))
a<-table.element(a,signif(p99,par2))
a<-table.element(a,signif(sqrt(var(r$t[,4])),par2))
a<-table.element(a,signif(q3-q1,par2))
a<-table.row.end(a)
a<-table.row.start(a)
a<-table.element(a,'mode k.dens',header=TRUE)
q1 <- quantile(r$t[,5],0.25)[[1]]
q3 <- quantile(r$t[,5],0.75)[[1]]
p01 <- quantile(r$t[,5],myq.1)[[1]]
p05 <- quantile(r$t[,5],myq.2)[[1]]
p95 <- quantile(r$t[,5],myq.3)[[1]]
p99 <- quantile(r$t[,5],myq.4)[[1]]
a<-table.element(a,signif(p01,par2))
a<-table.element(a,signif(p05,par2))
a<-table.element(a,signif(q1,par2))
a<-table.element(a,signif(r$t0[5],par2))
a<-table.element(a,signif(q3,par2))
a<-table.element(a,signif(p95,par2))
a<-table.element(a,signif(p99,par2))
a<-table.element(a,signif(sqrt(var(r$t[,5])),par2))
a<-table.element(a,signif(q3-q1,par2))
a<-table.row.end(a)
a<-table.end(a)
table.save(a,file='mytable.tab')